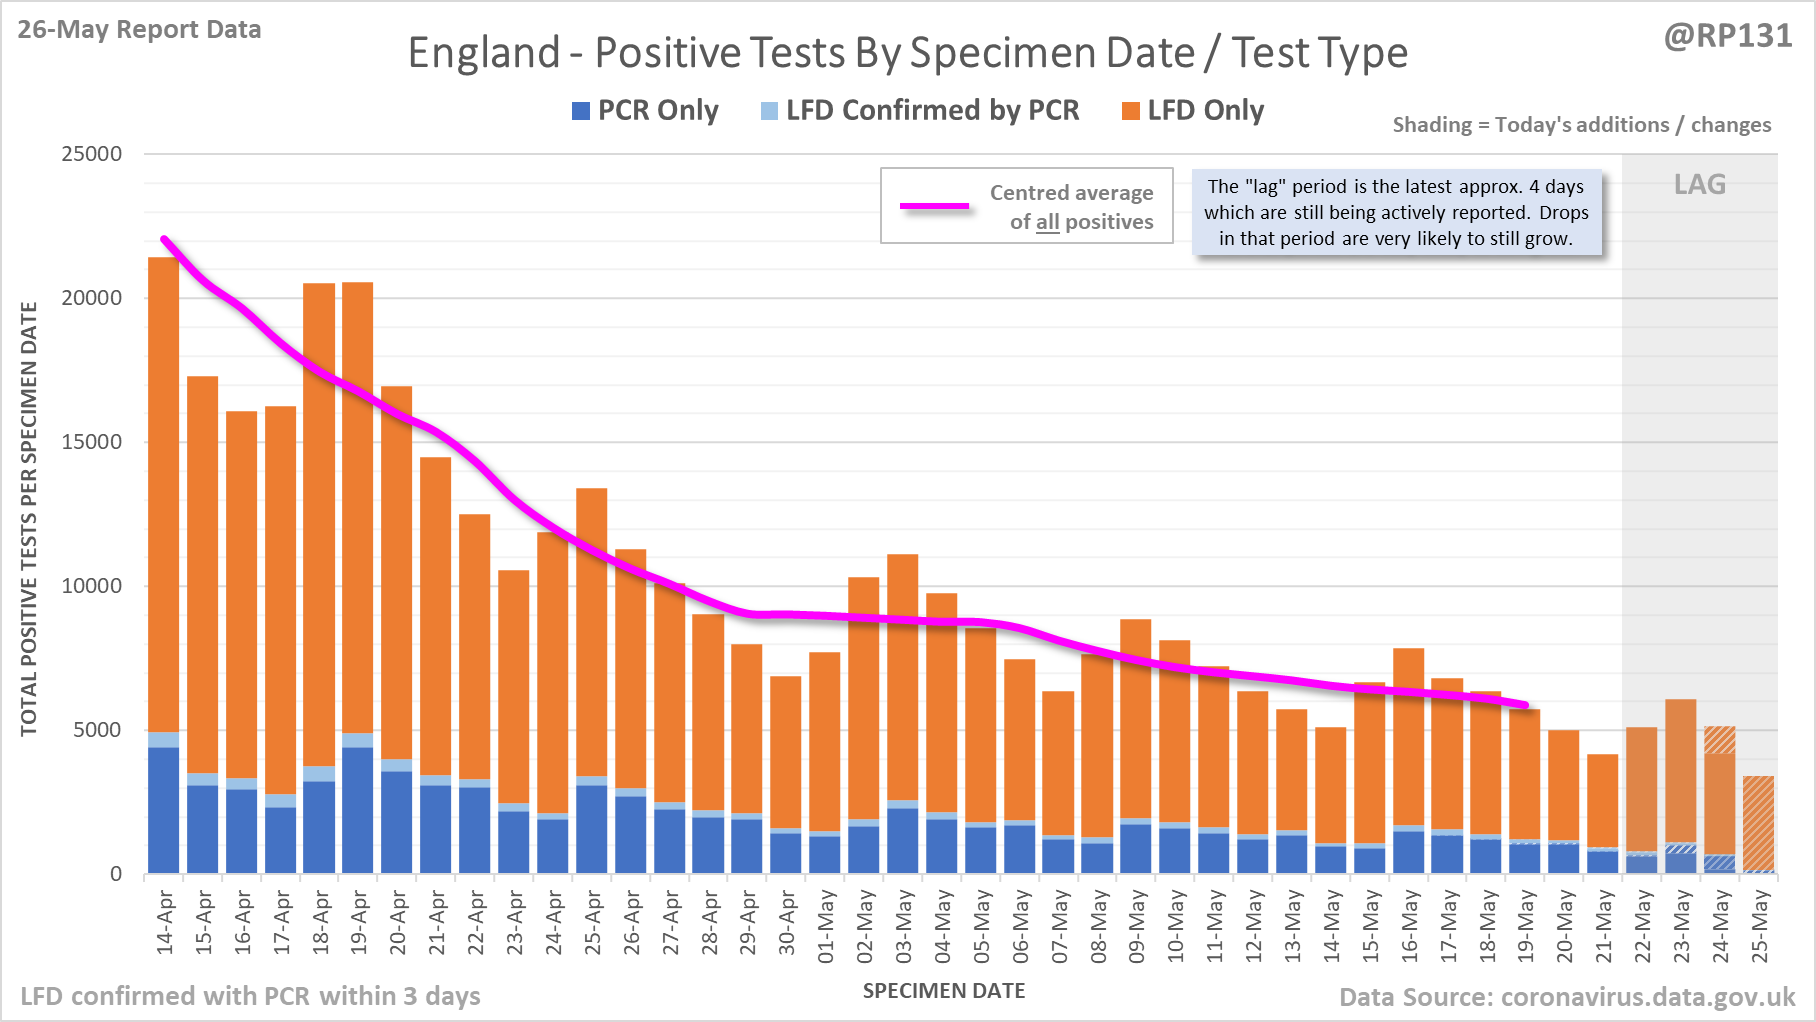
[1/14] 8,369 new #covid19uk positive tests reported today (26-May).
Overall England is DOWN 21% on previous Thursday and day-1 lateral flow positives are also down by 16%.
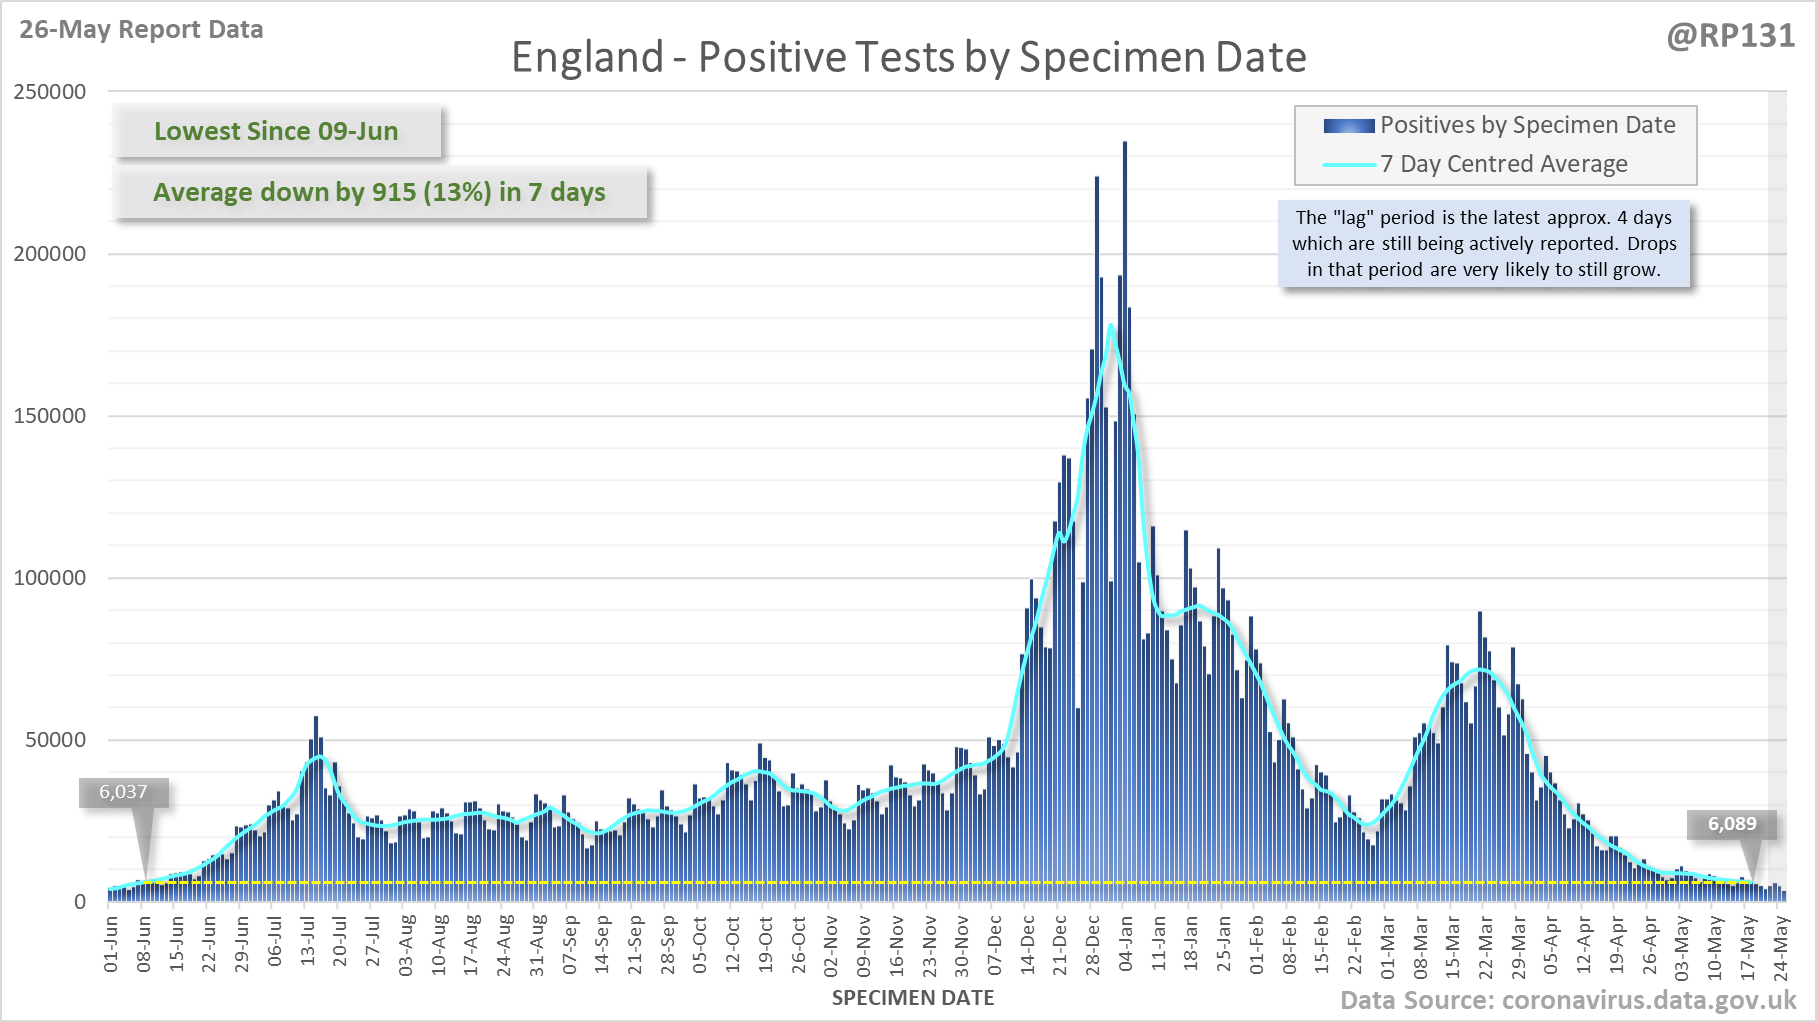
England's rolling average by specimen date has now been dropping since the 21st of March (66 days ago).
Overall England is DOWN 21% on previous Thursday and day-1 lateral flow positives are also down by 16%.
England's rolling average by specimen date has now been dropping since the 21st of March (66 days ago).
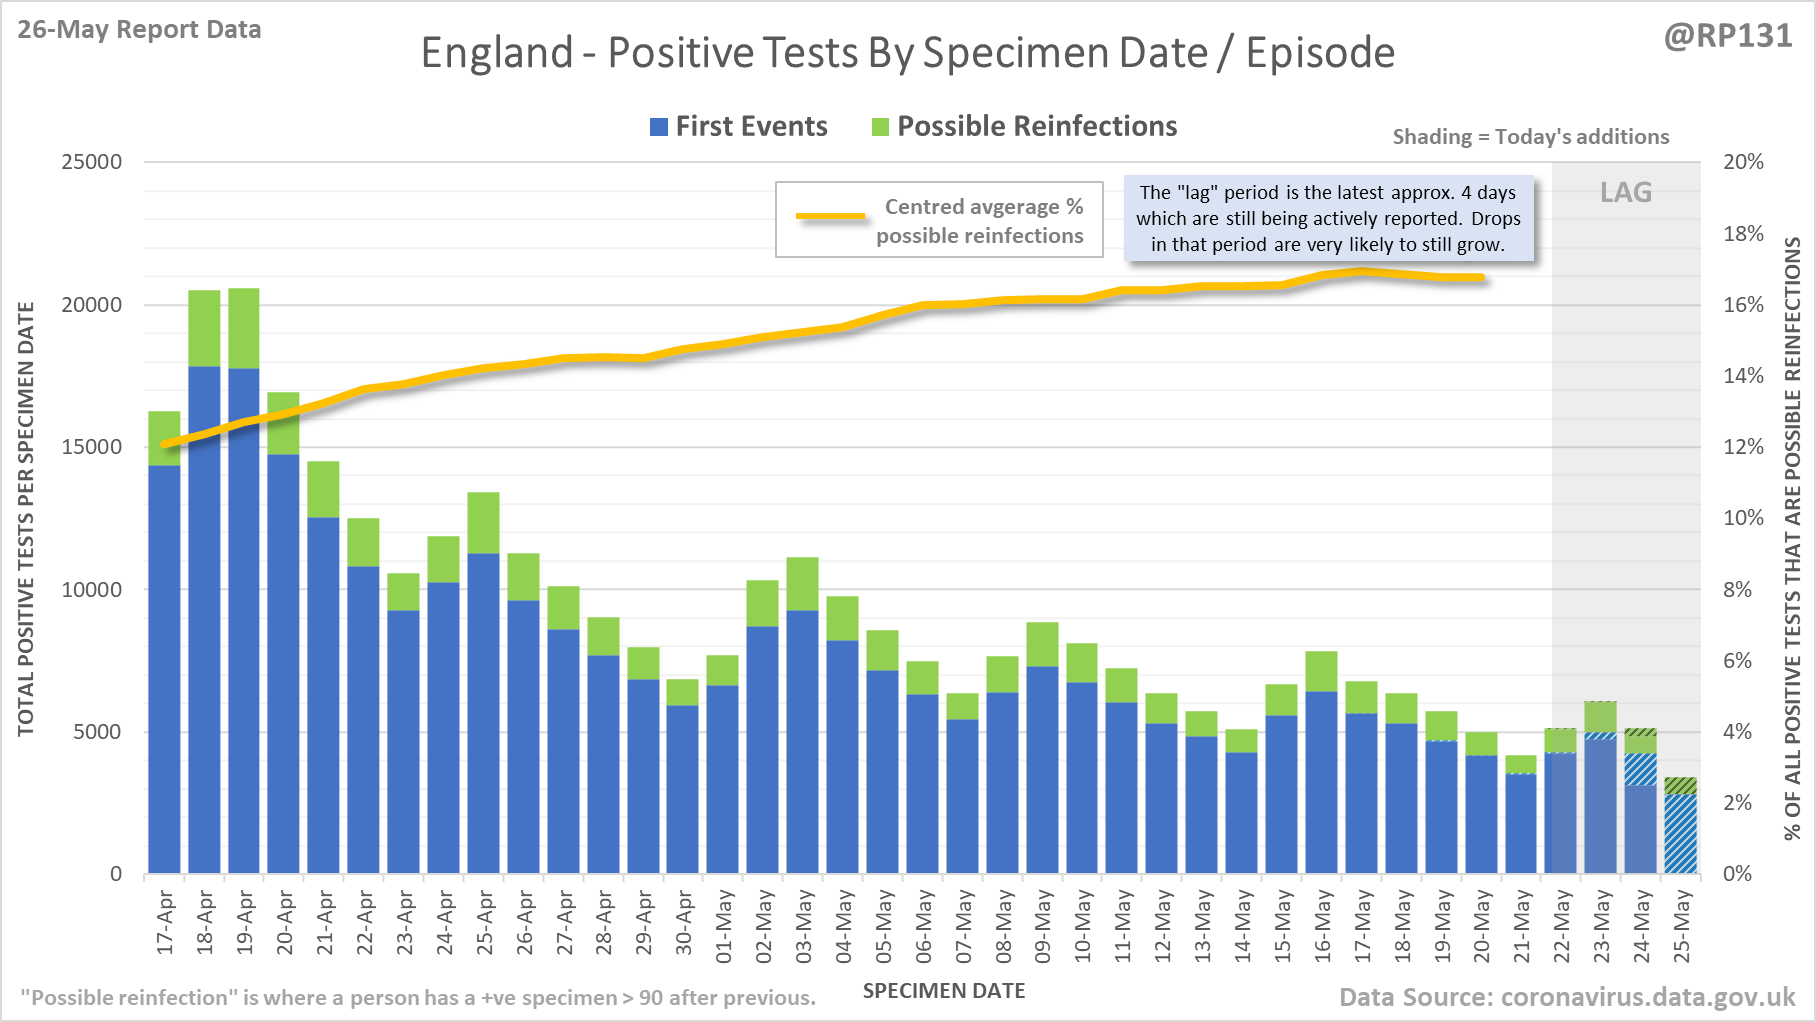
[2/14] Chart to show England positive tests (as of 26-May) by breakdown of first infection events and possible reinfection events.
Possible reinfections were added to the data from 31-Jan and the rolling average vs. total tests is currently about 17%.
Possible reinfections were added to the data from 31-Jan and the rolling average vs. total tests is currently about 17%.
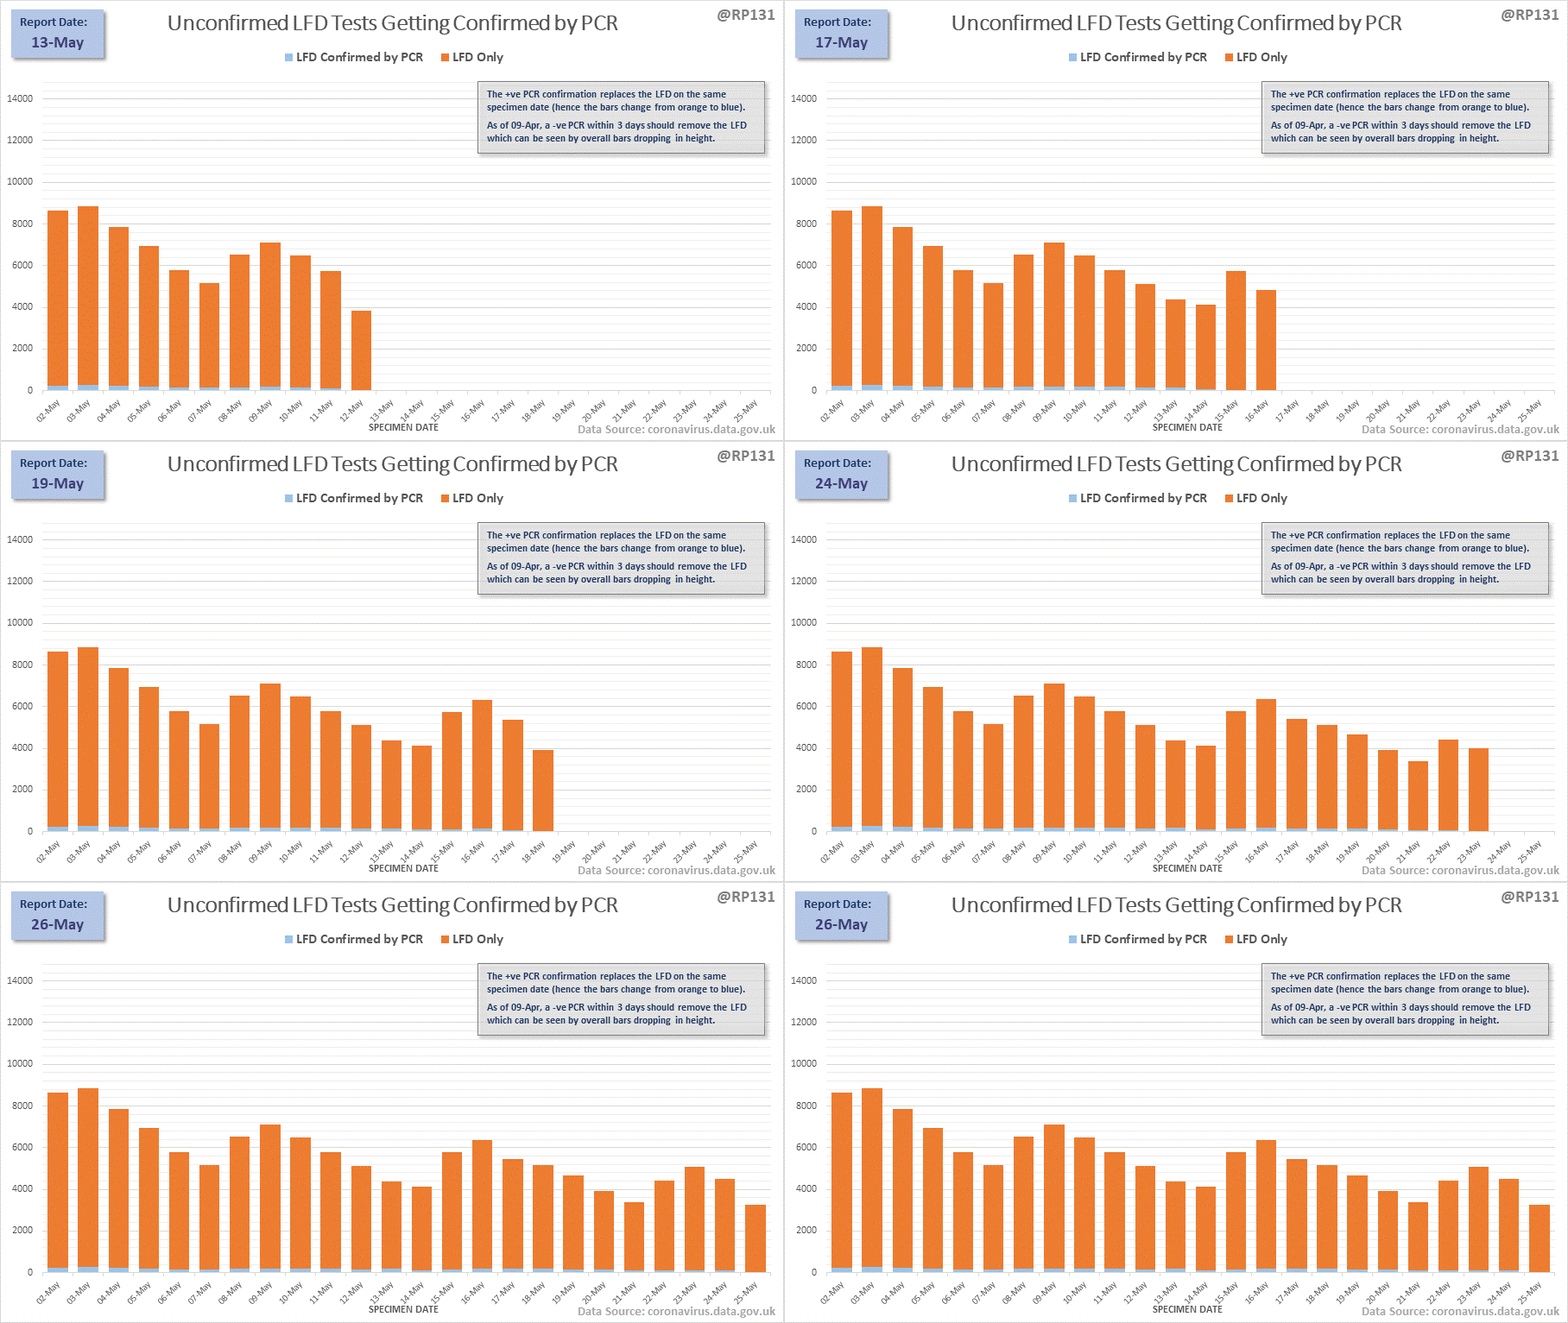
[3/14] Animated chart to show LFD-only positives being either converted into PCR confirmed positives or removed due to negattive confirmation, over the last 14 days of reports.
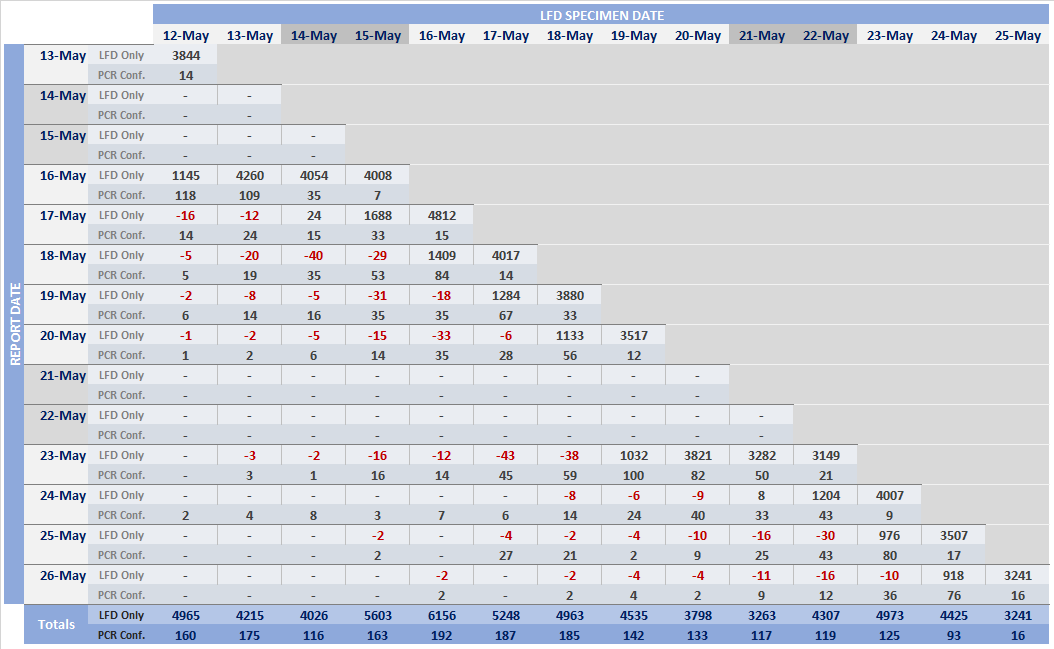
[4/14] Pivot table of daily changes to LFD Only and LFD Confirmed by PCR figures to see if we can identify where LFDs are now being removed due to negative follow-up PCRs.
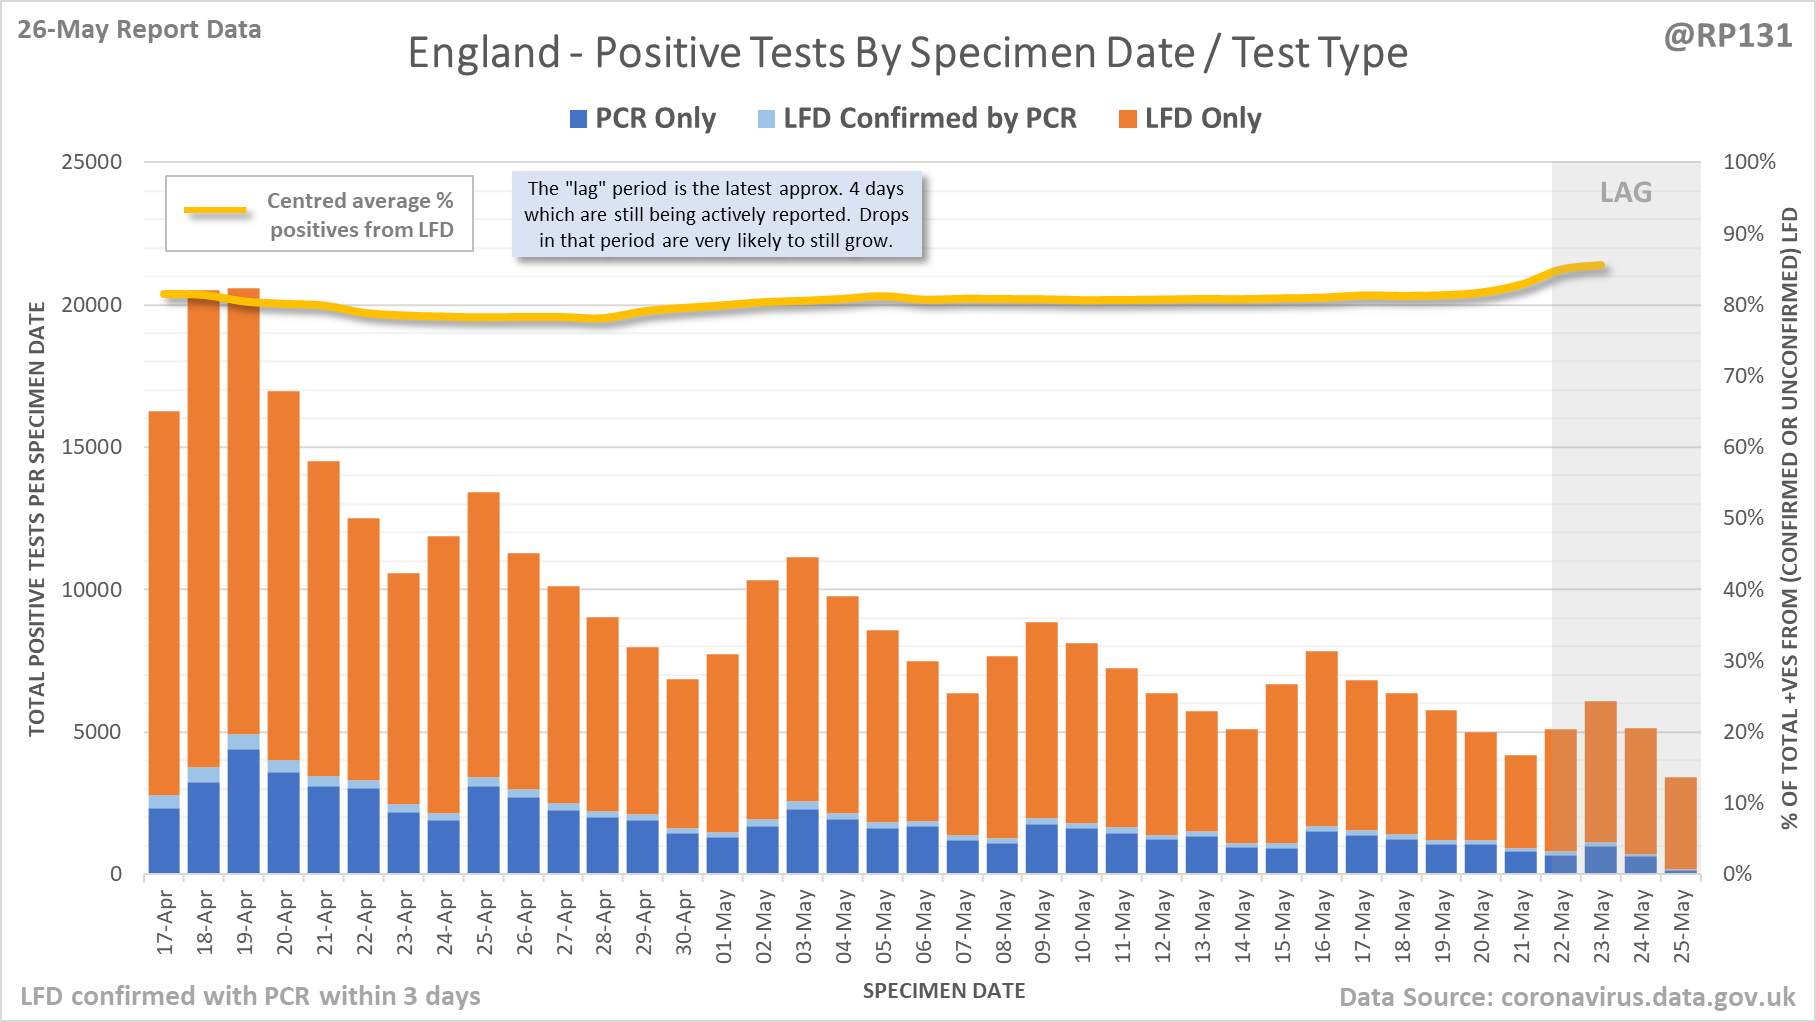
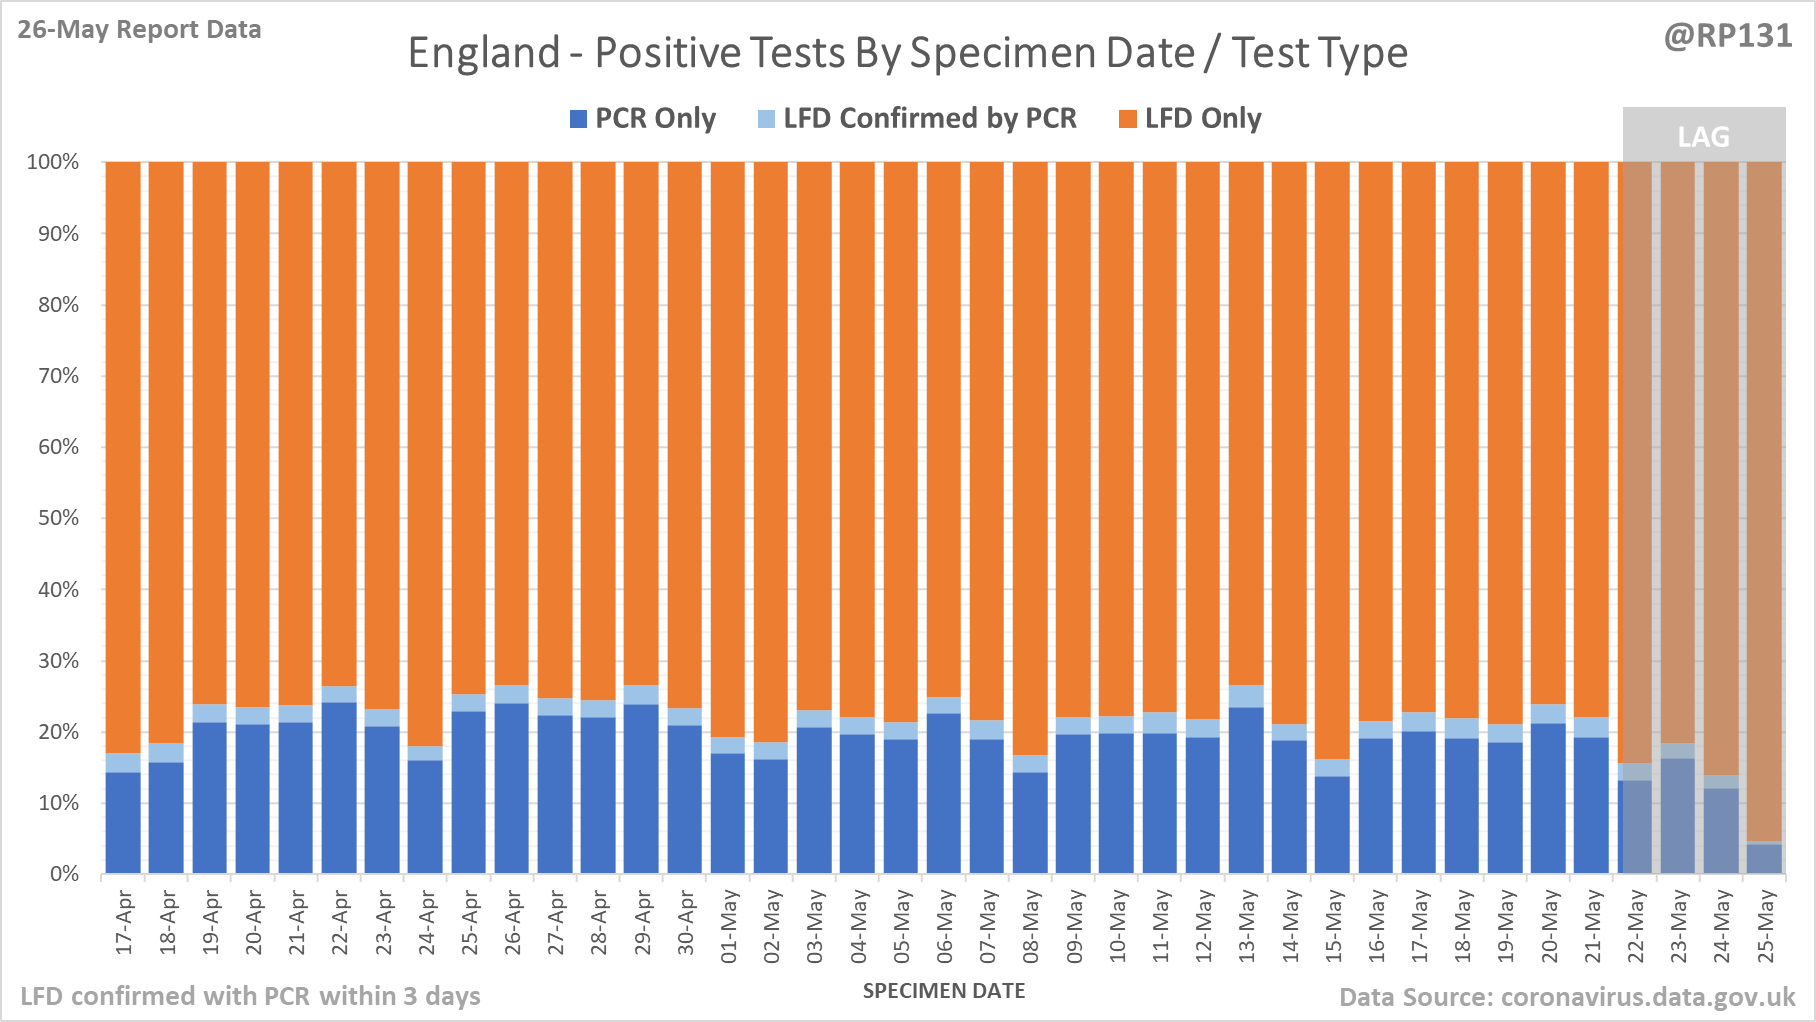
[5/14] England positive tests by type of test used. Version with the rolling average percentage of tests from LFD.
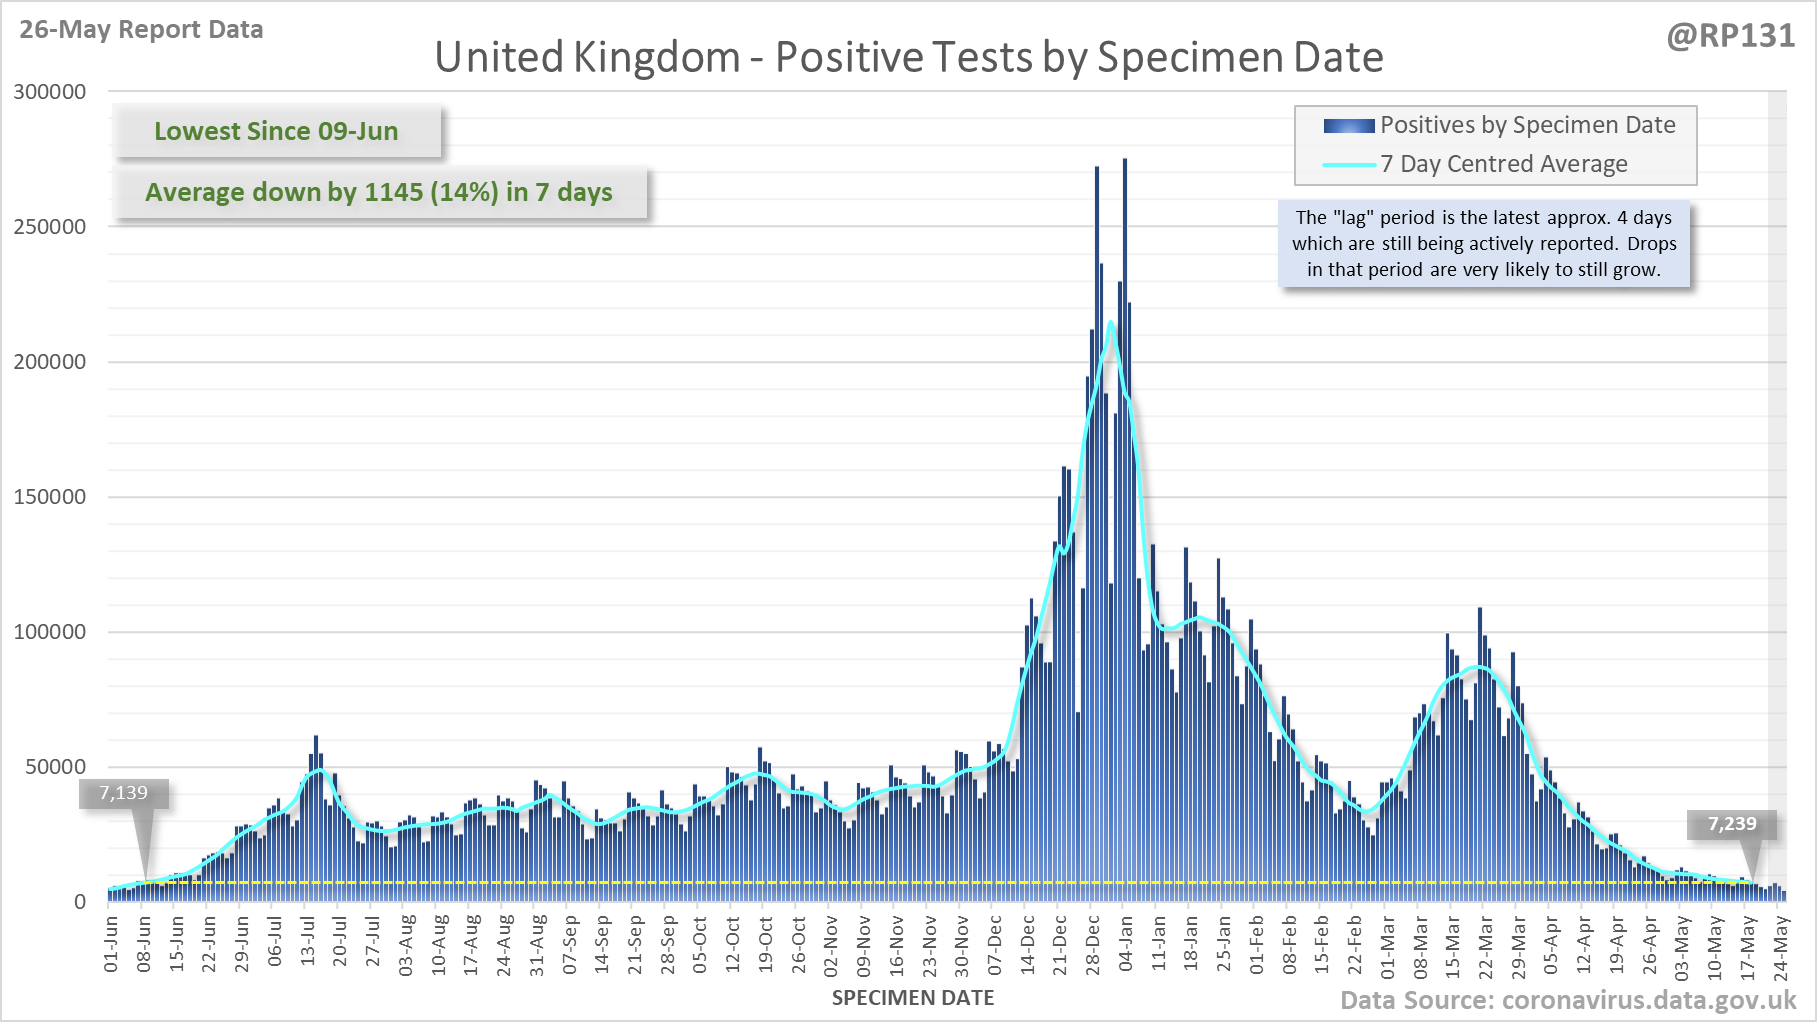
[7/14] Longer term view. 8,369 new #covid19uk positive tests reported today (26-May). This brings the rolling average by specimen date (allowing 4 days for lag) to 7,239, equivalent to around 09-Jun (i.e. 344 days ago), a reduction of 1145 (14%) in the last week.
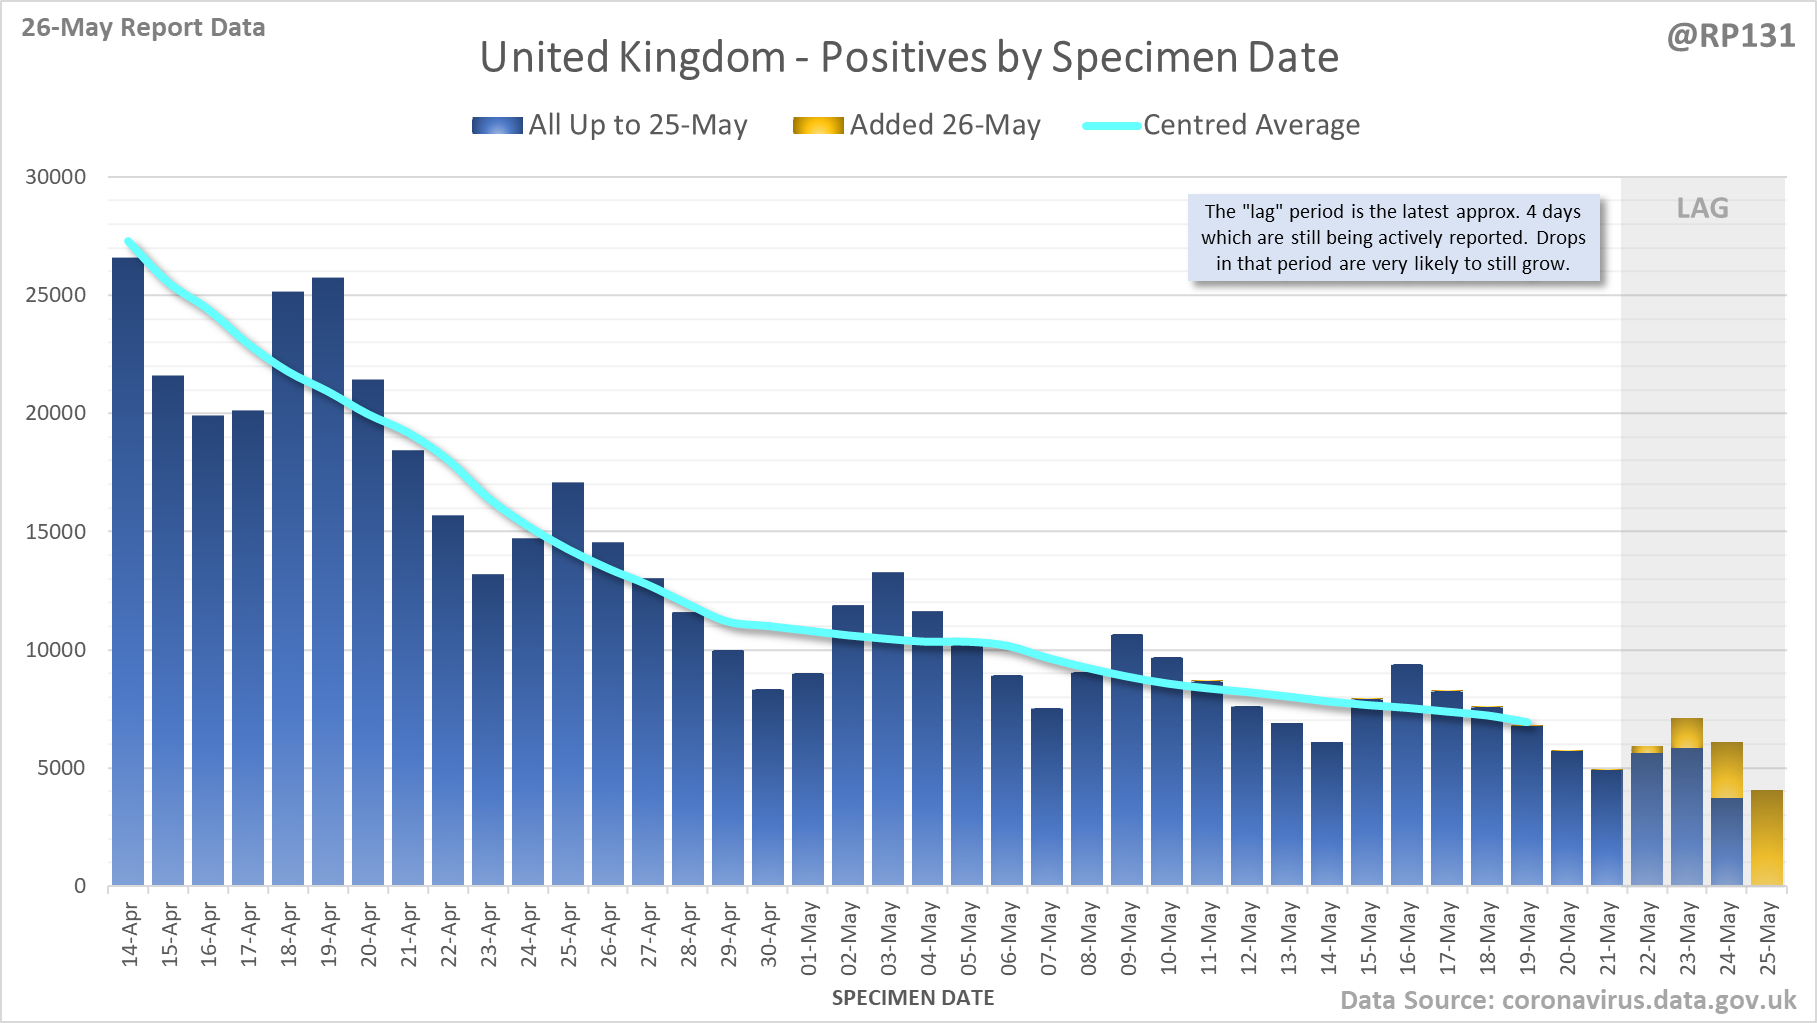
[9/14] Closer look at the latest 45 days, with today's added numbers highlighted in yellow. Individual nations and animated England charts further down the thread.
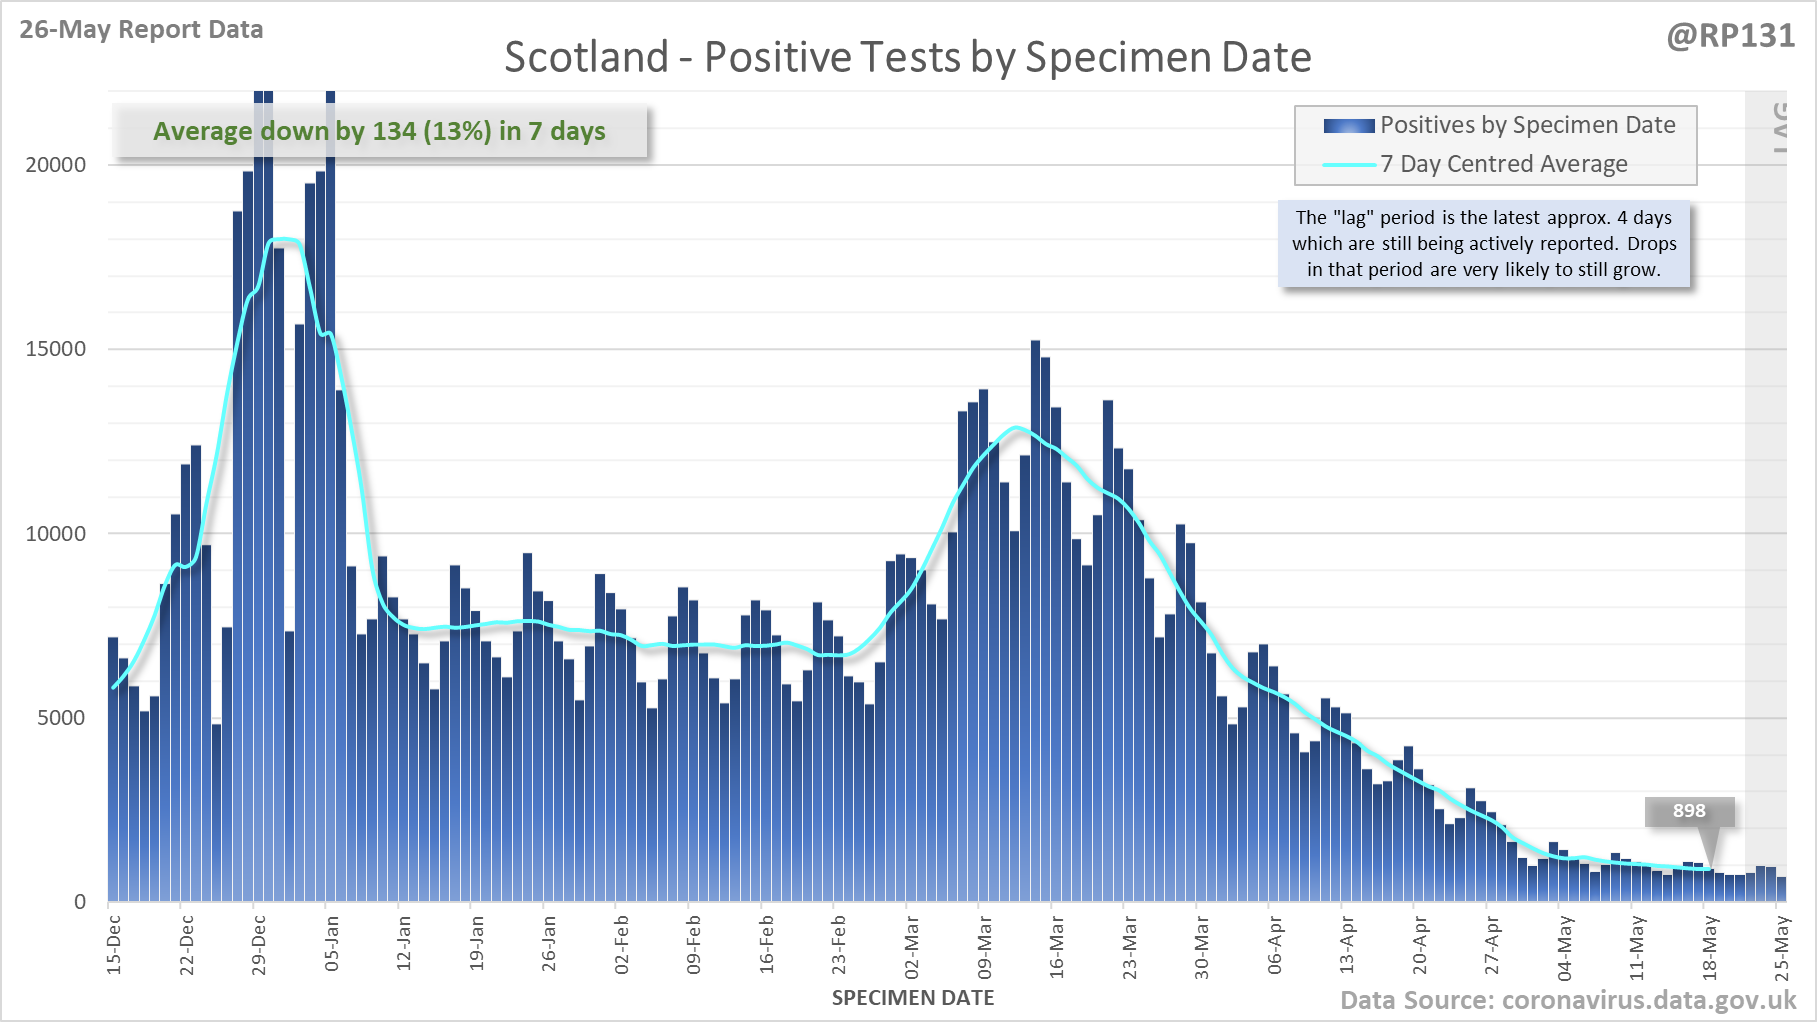
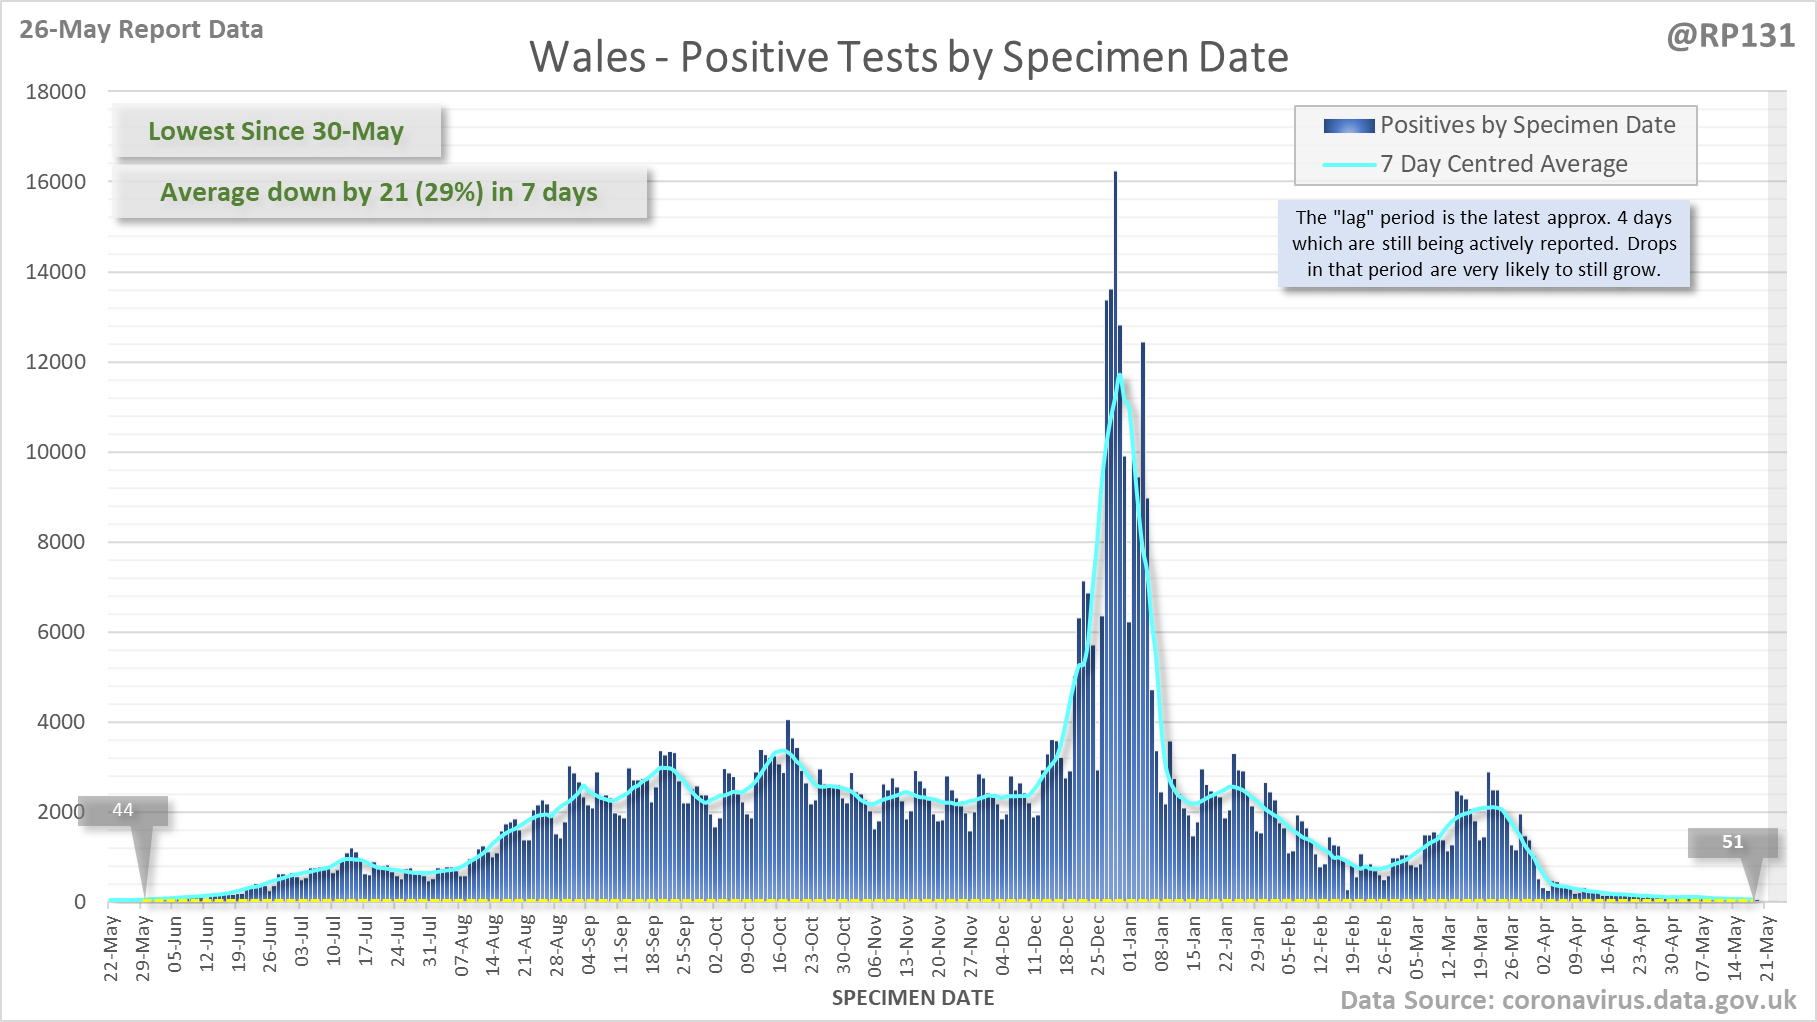
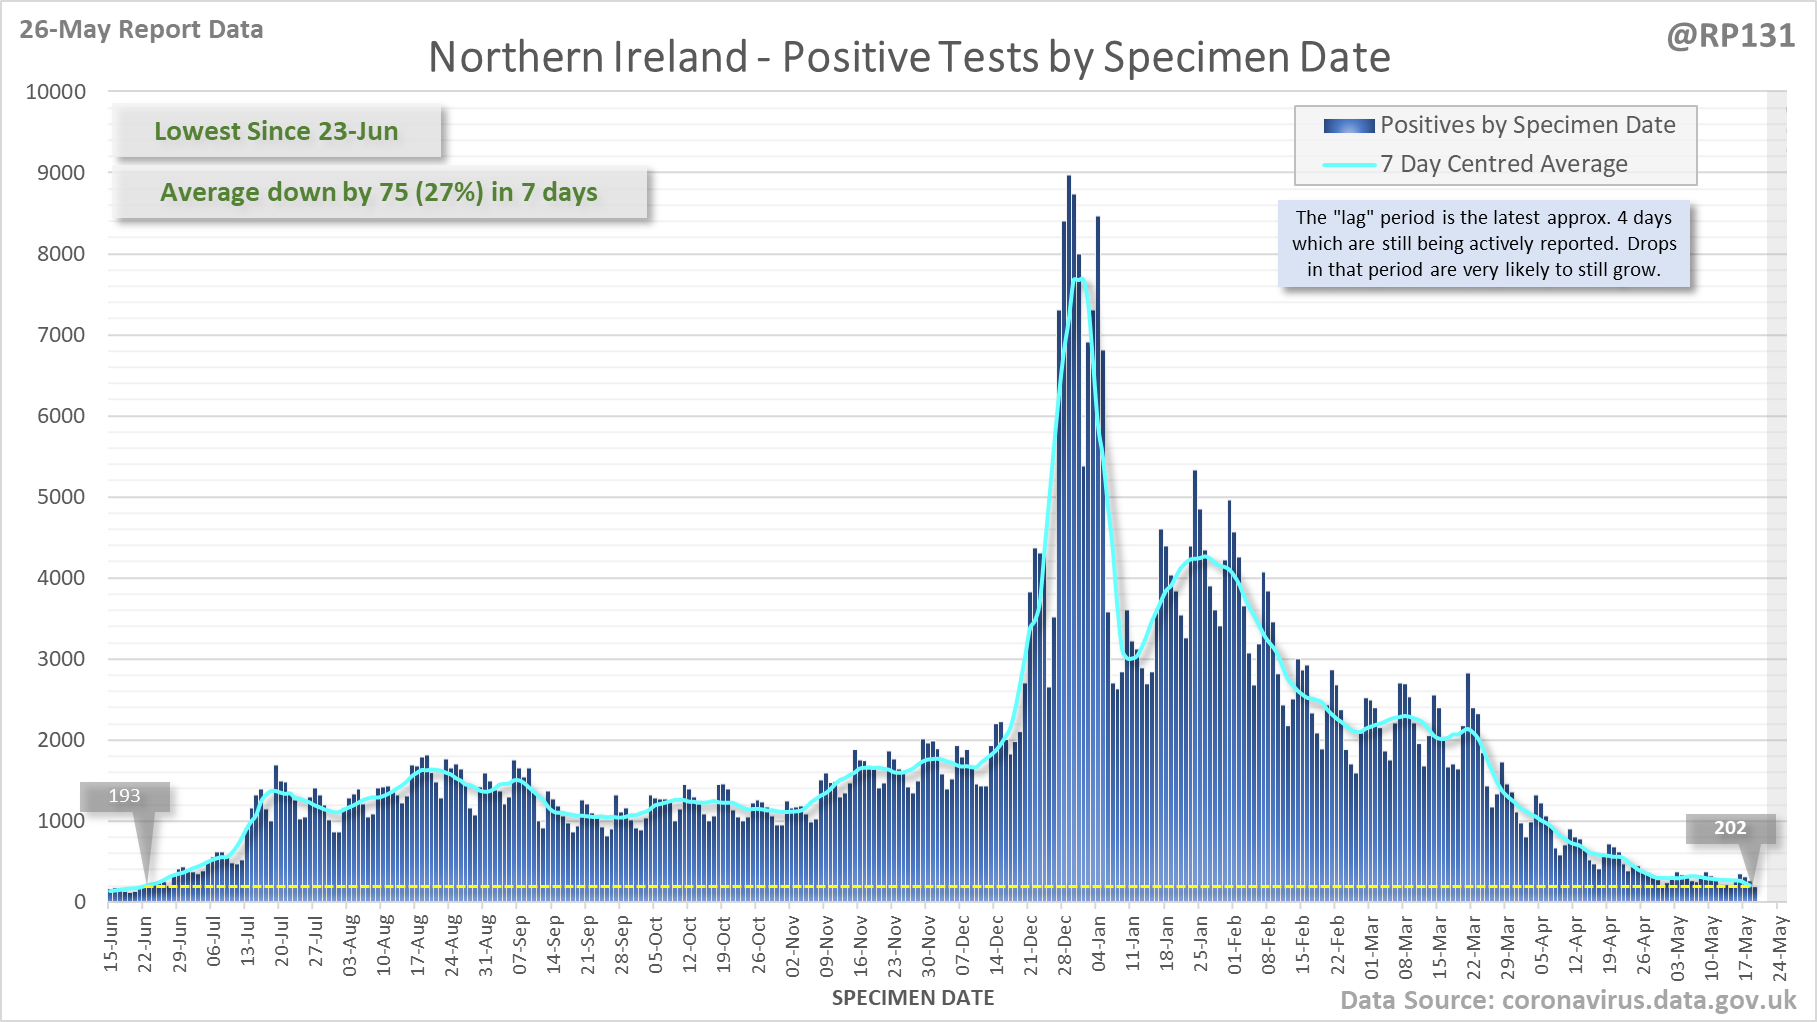
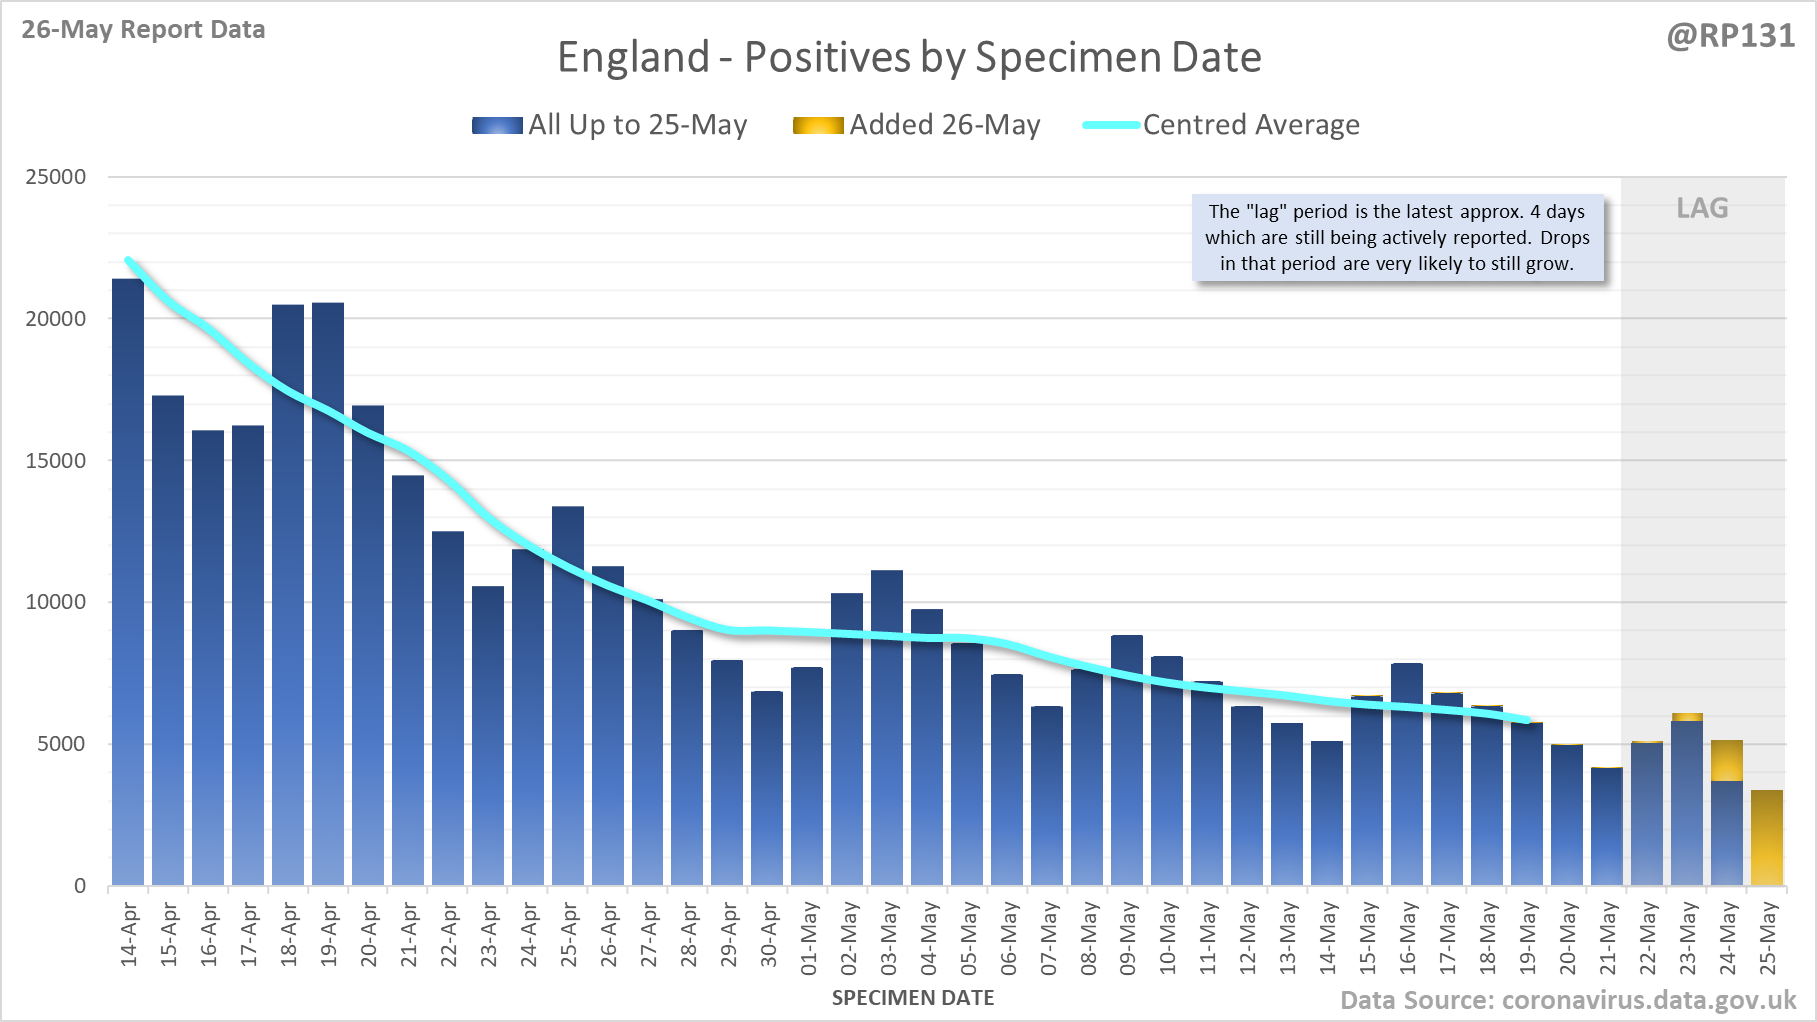
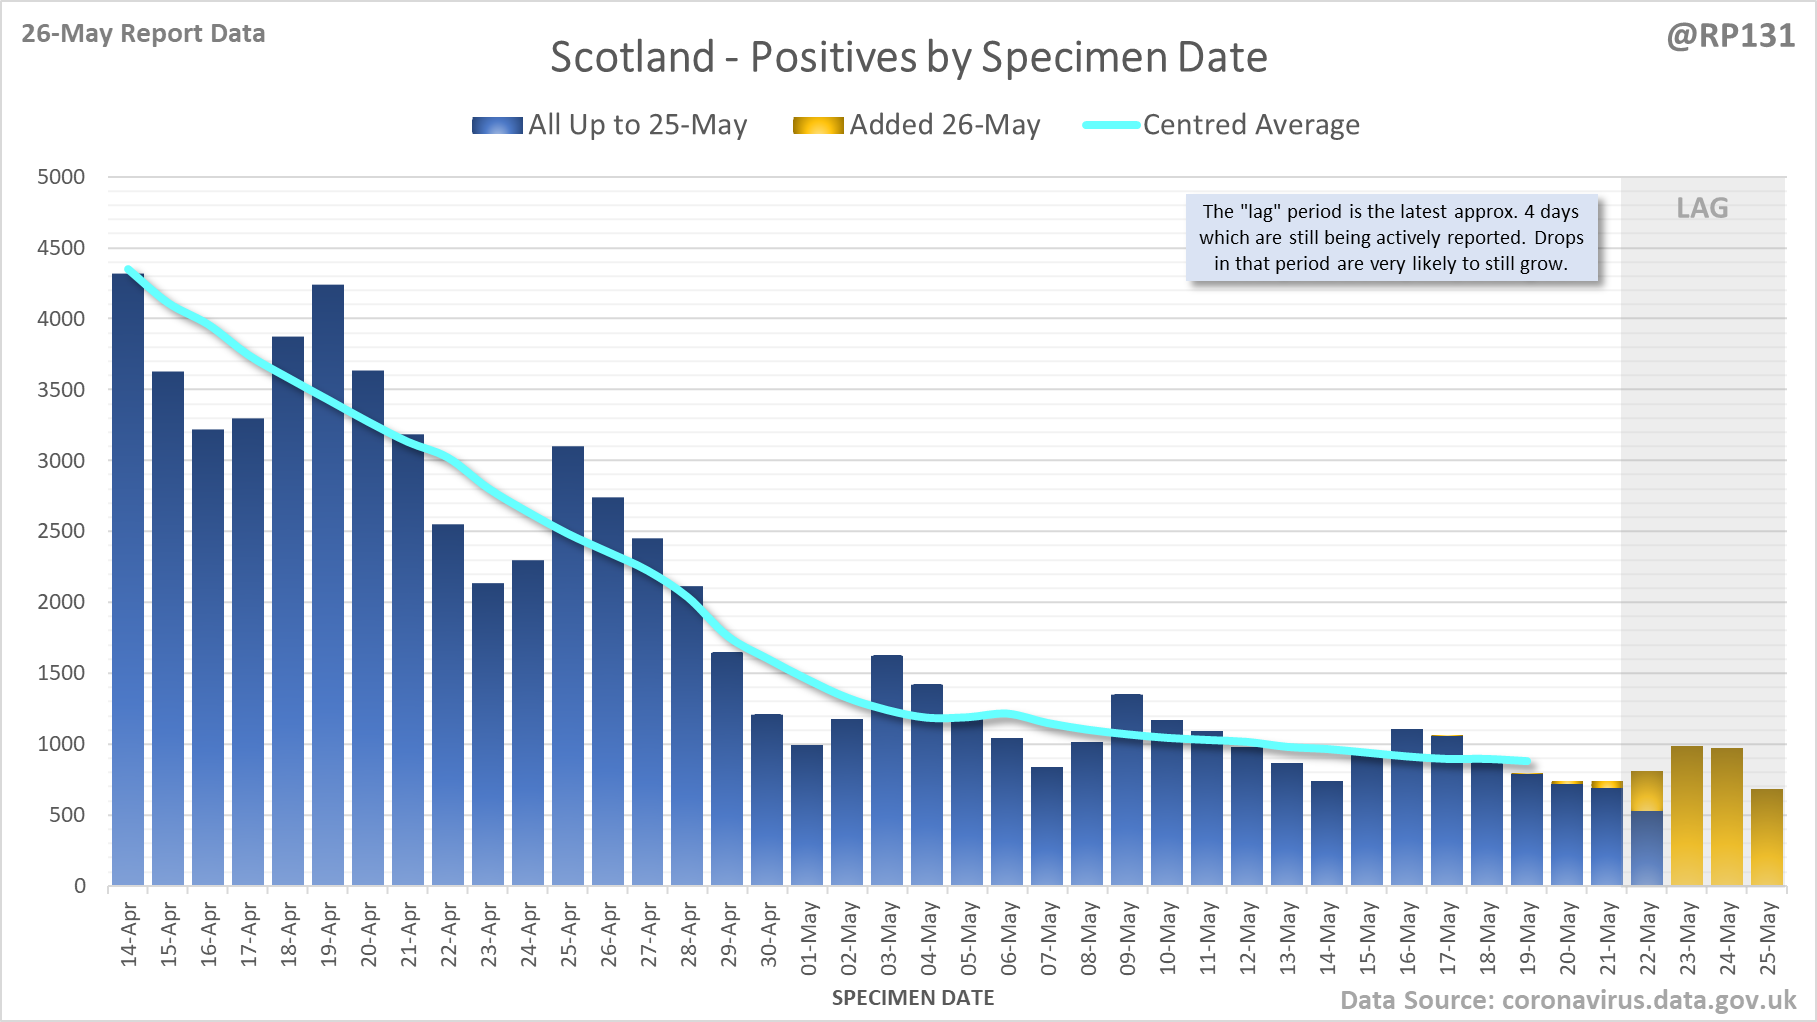
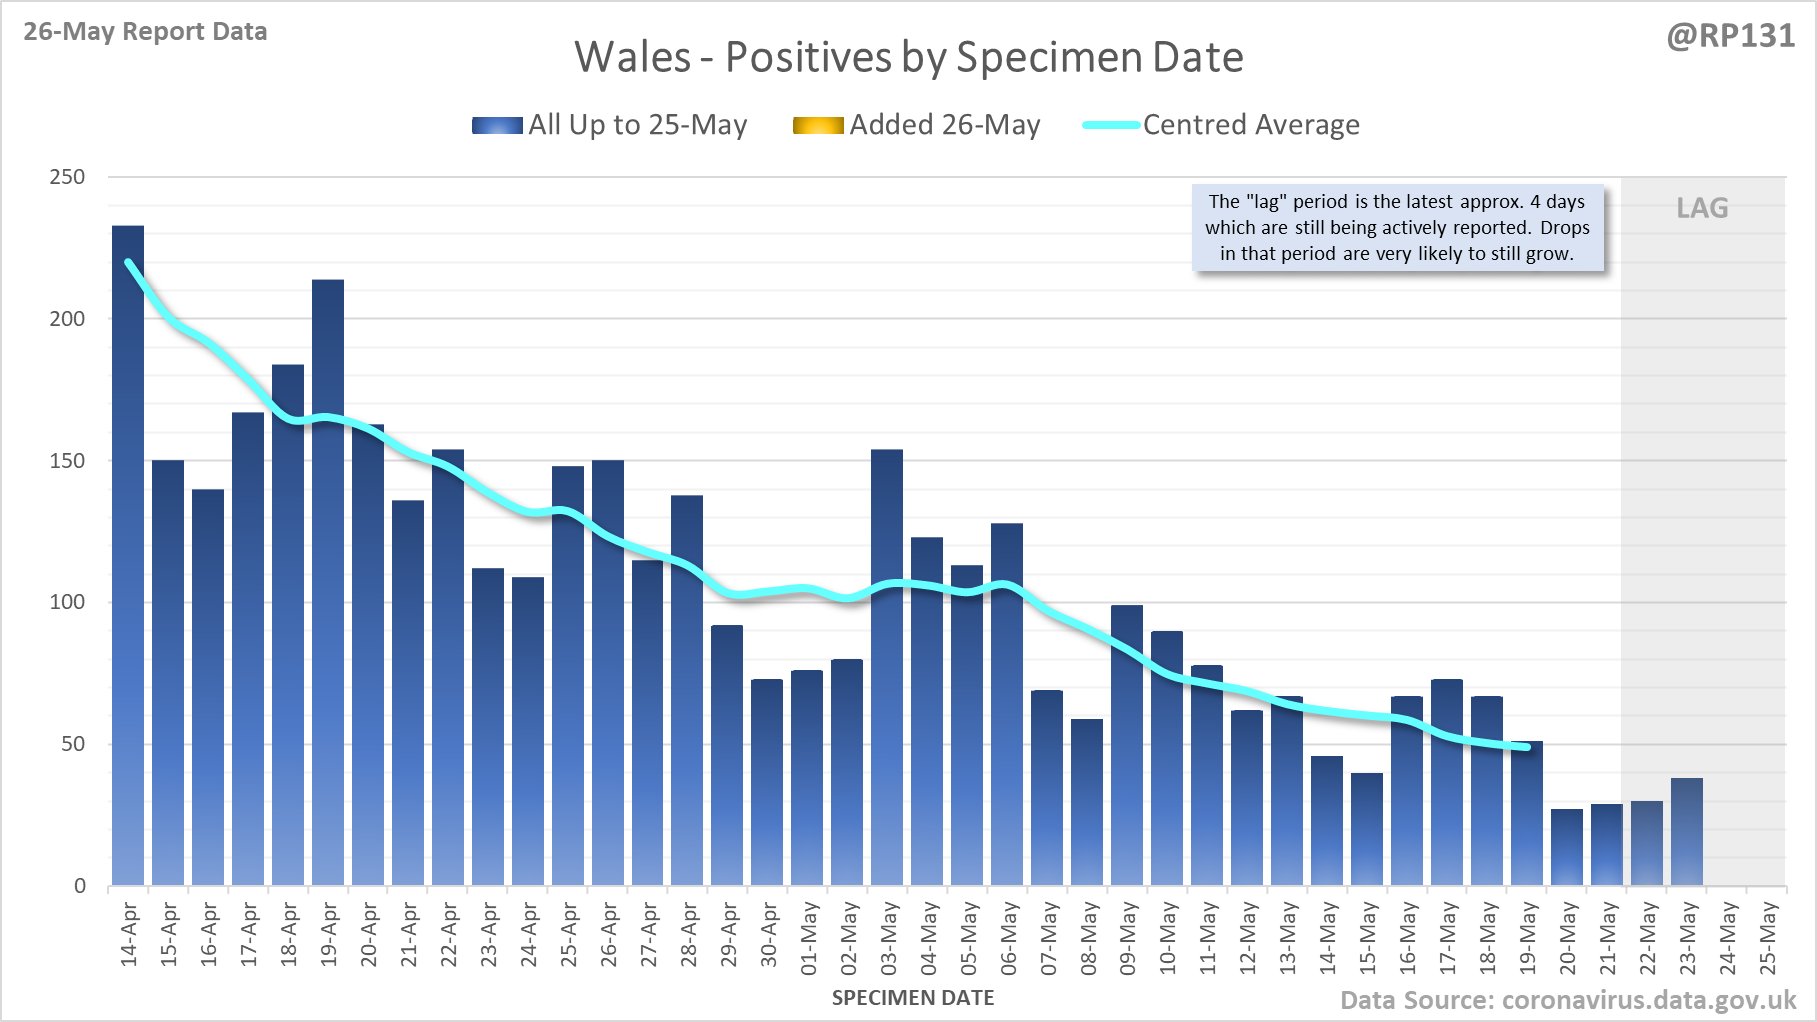
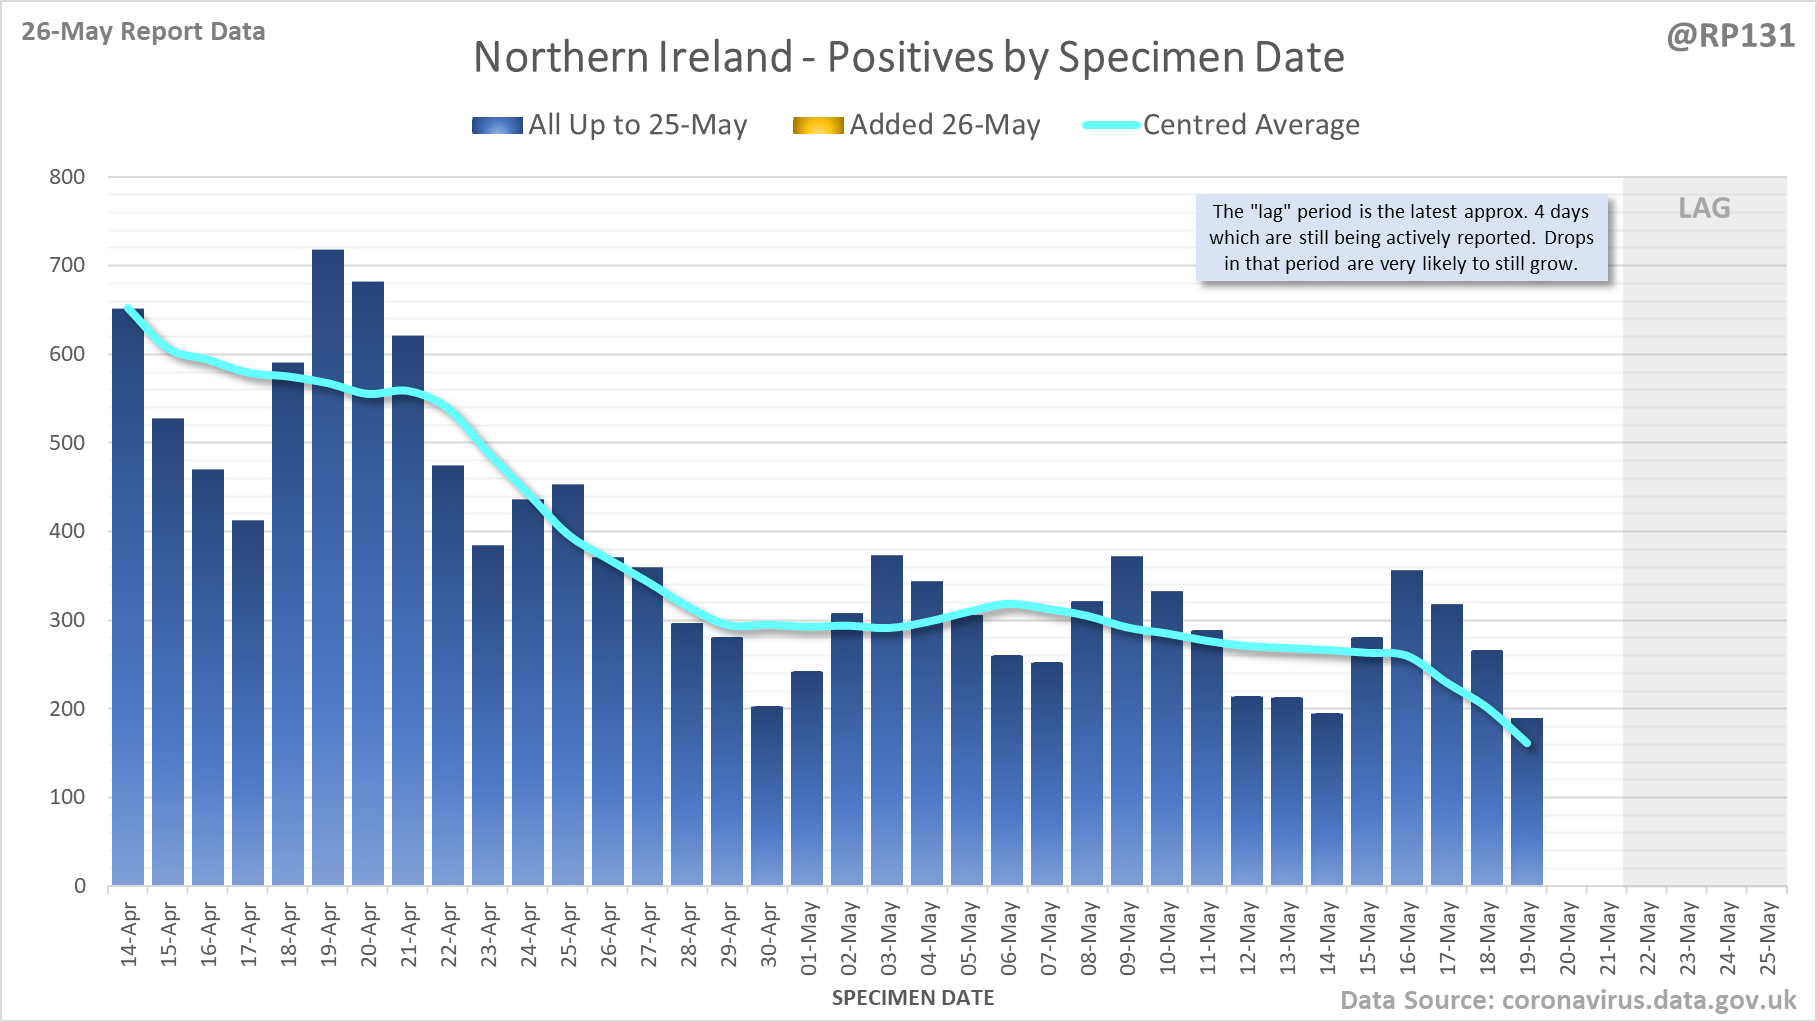
[10/14] Separate charts for England (5293) Scotland (3024) Wales (52) and Northern Ireland (0). Note the different scales. Also on certain days the specimen-date data for Scotland/Wales/NI doesn't get updated so the yellow bars may be mising or include multiple day's numbers.
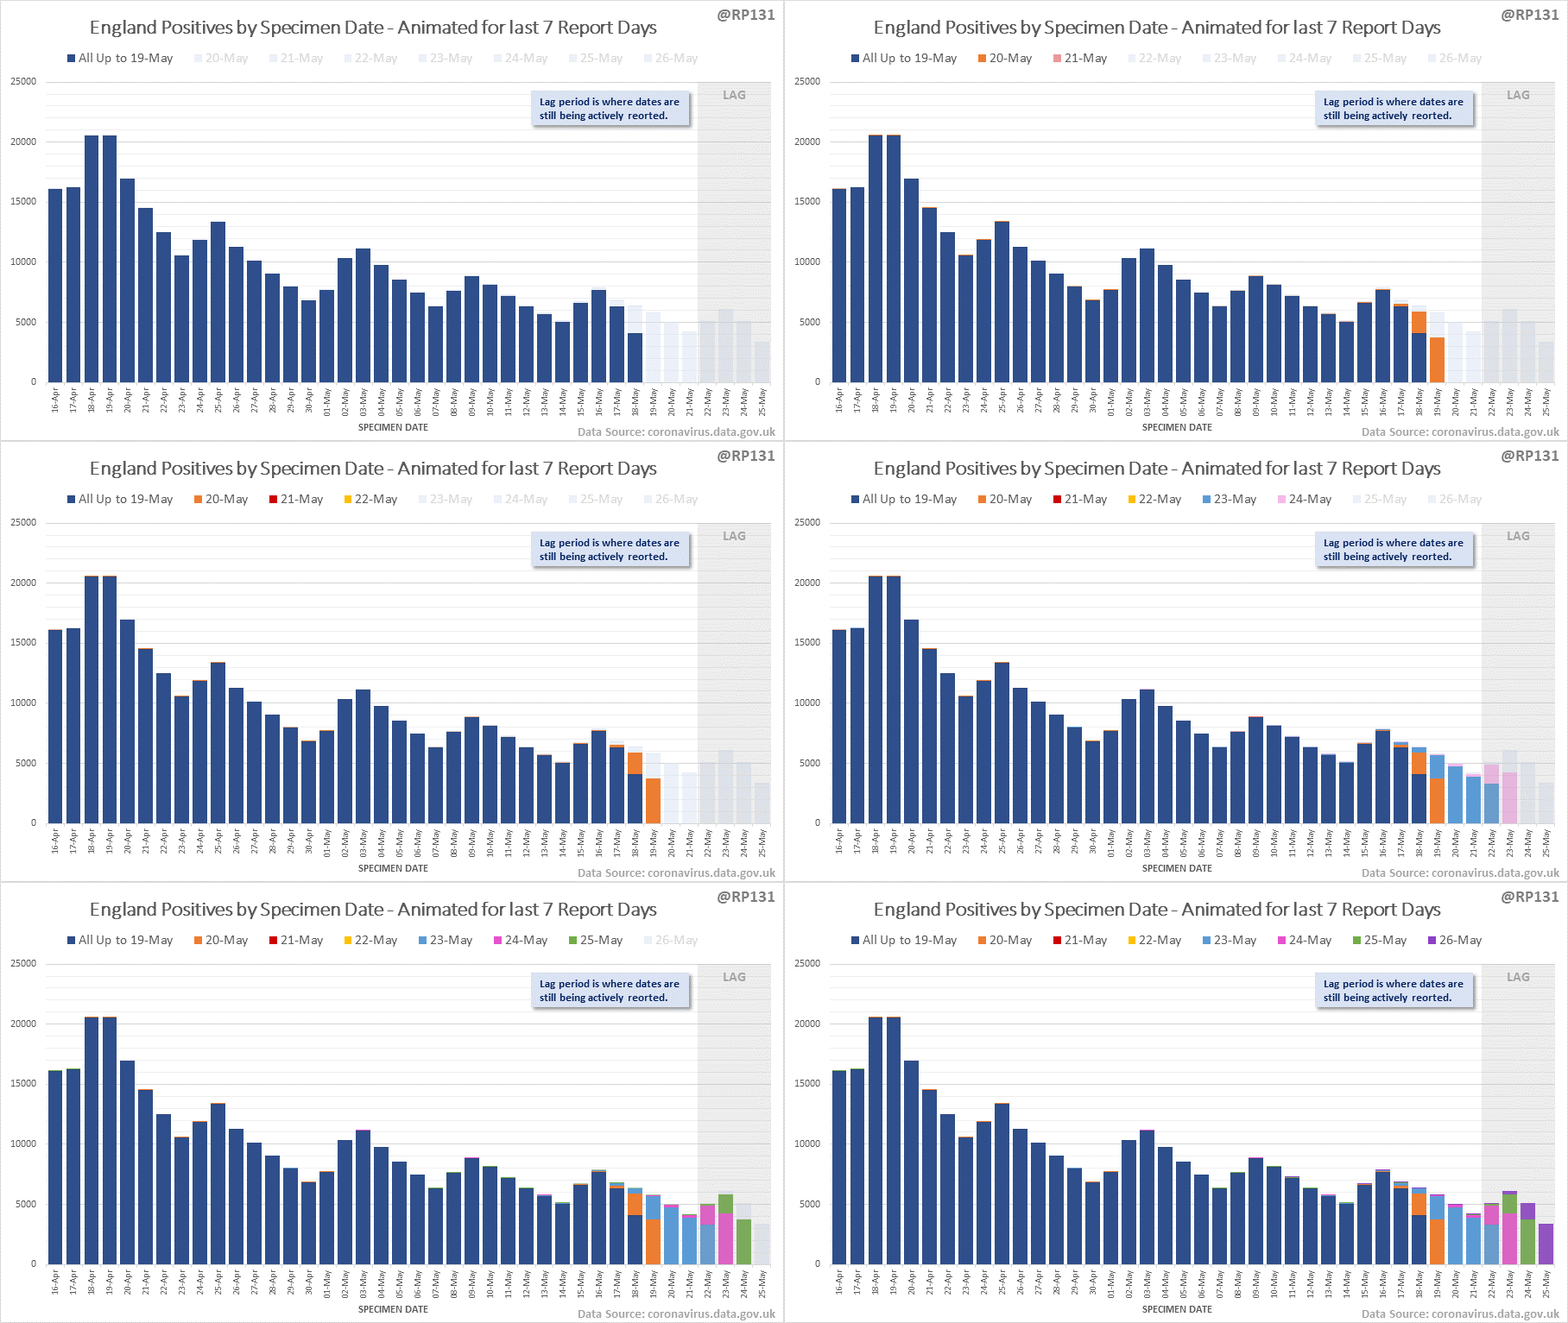
[11/14] Animated chart to show how the #covid19uk positive tests by specimen date have been contributed to by reports over the last 7 days. Note this just includes England numbers as other nations don't always publish their specimen date numbers every day.
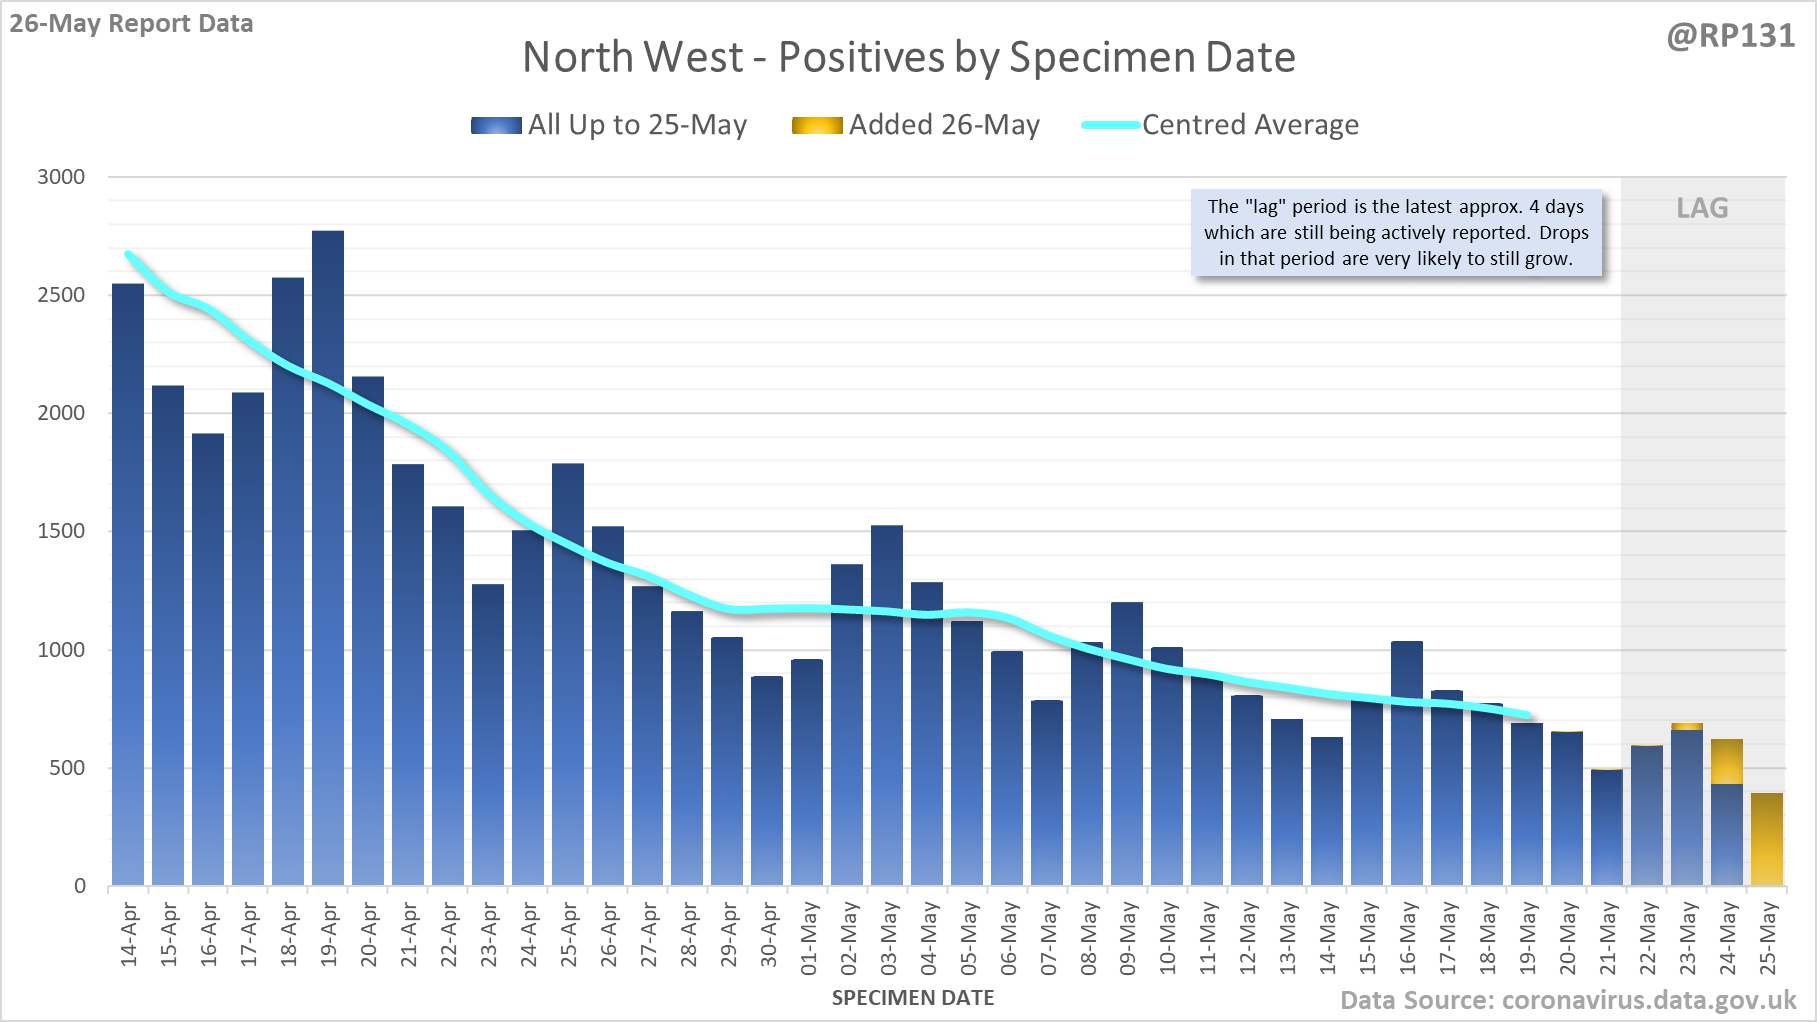
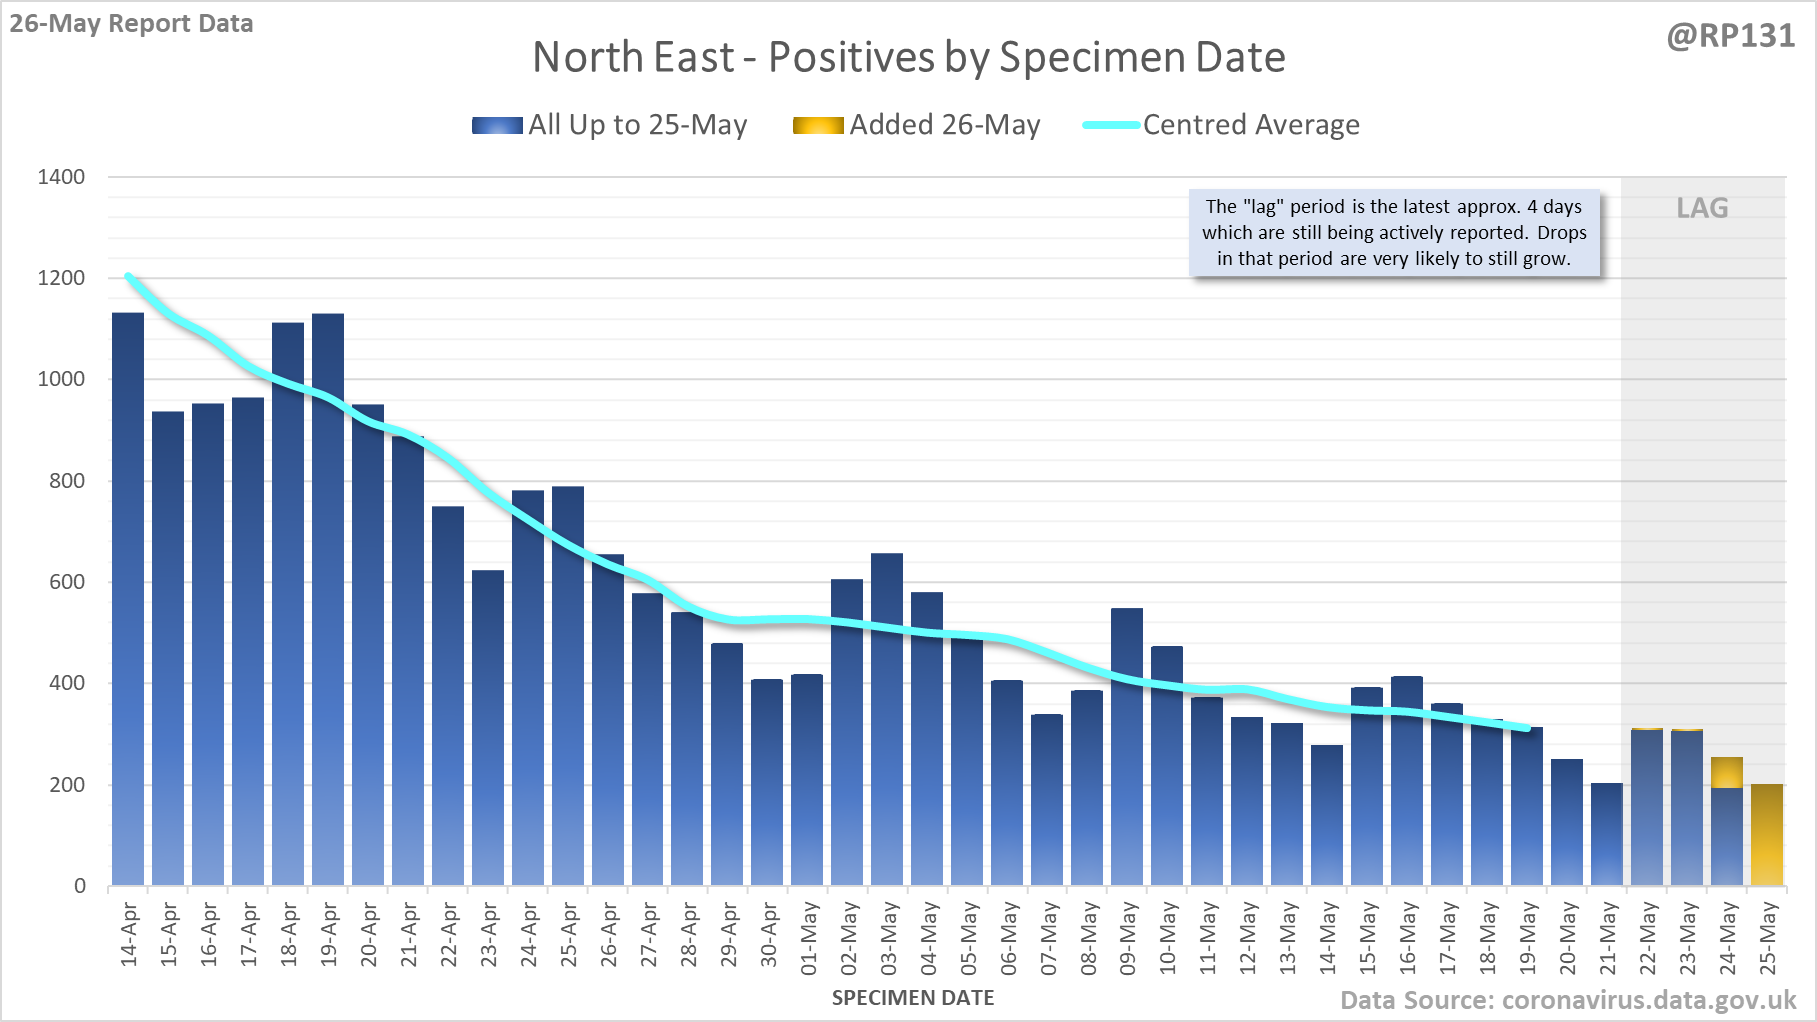
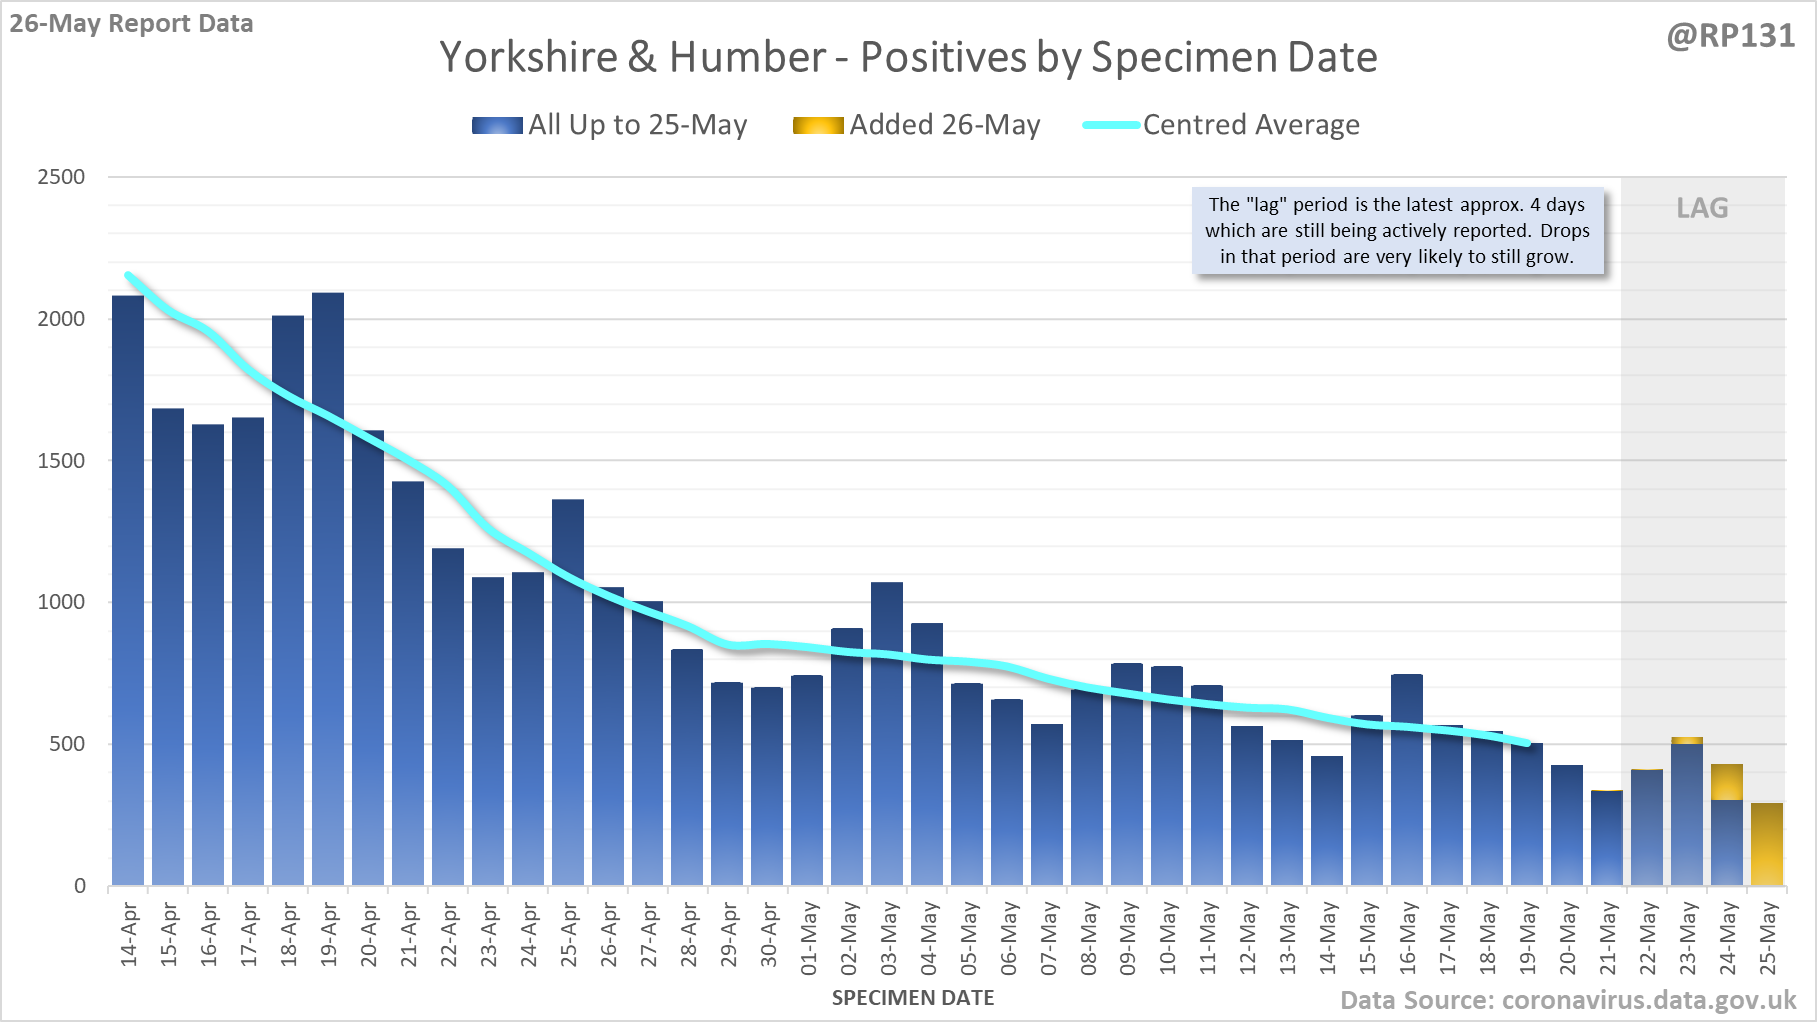
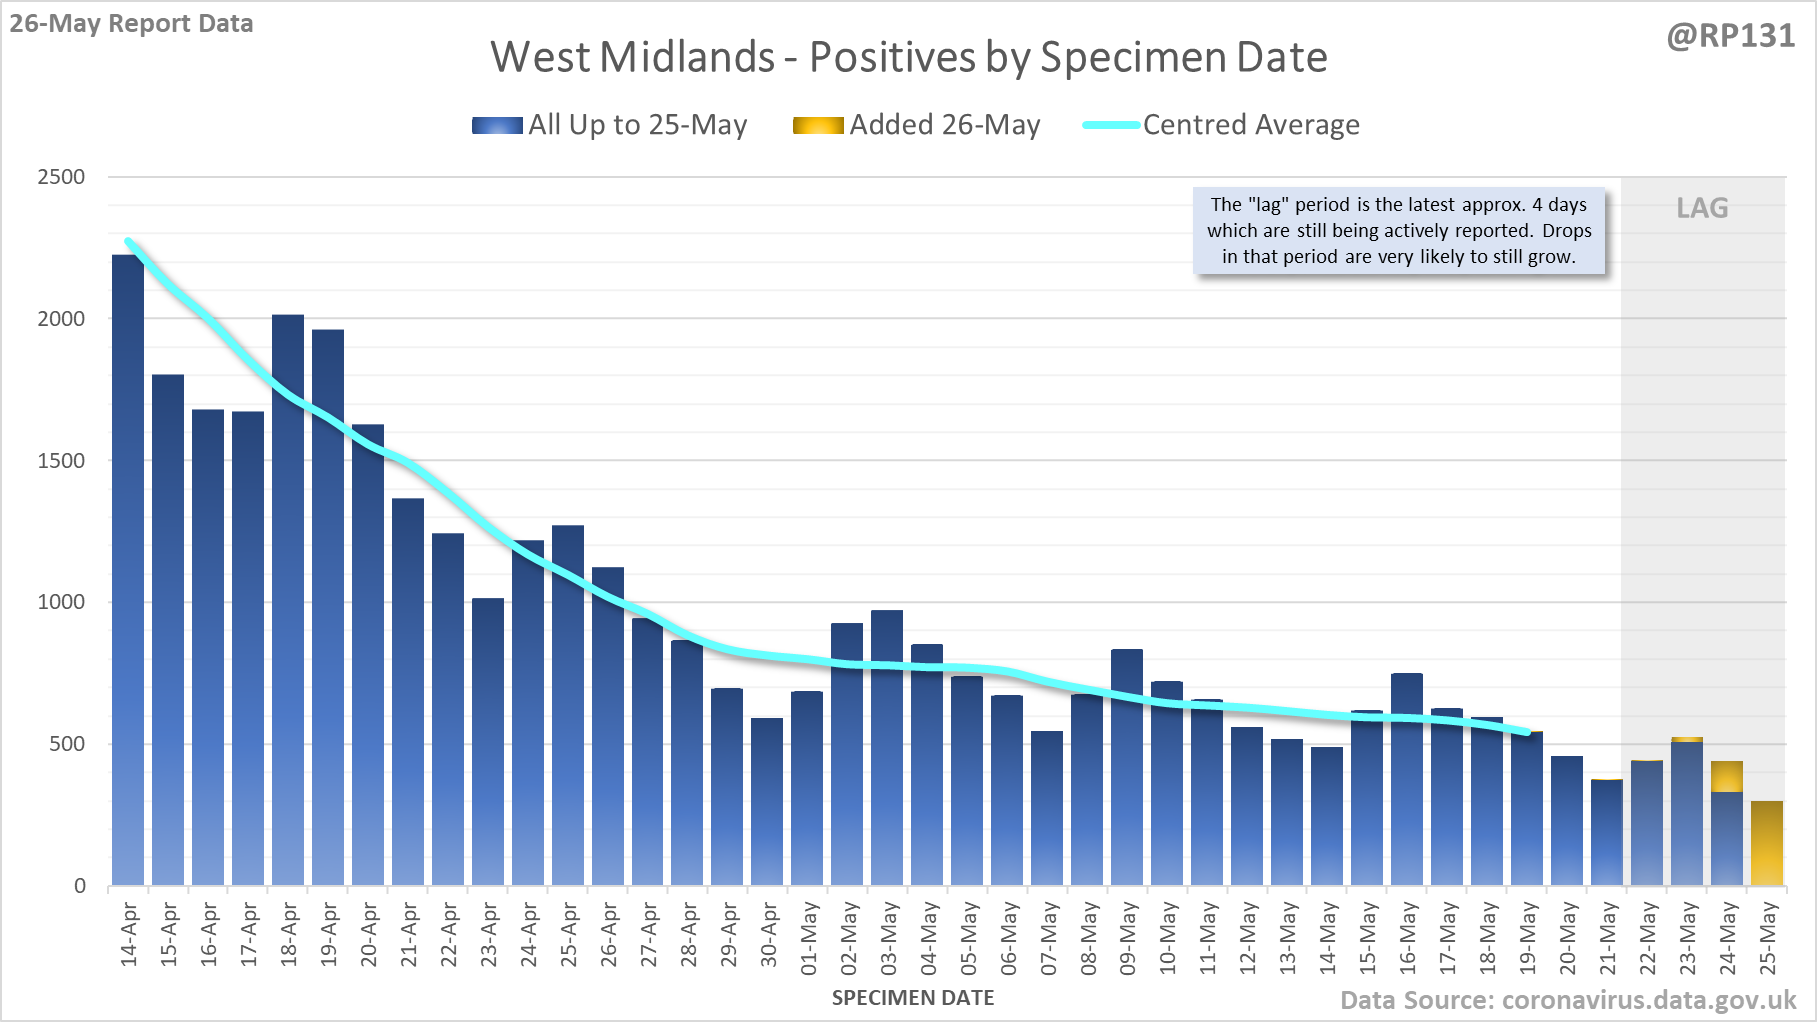
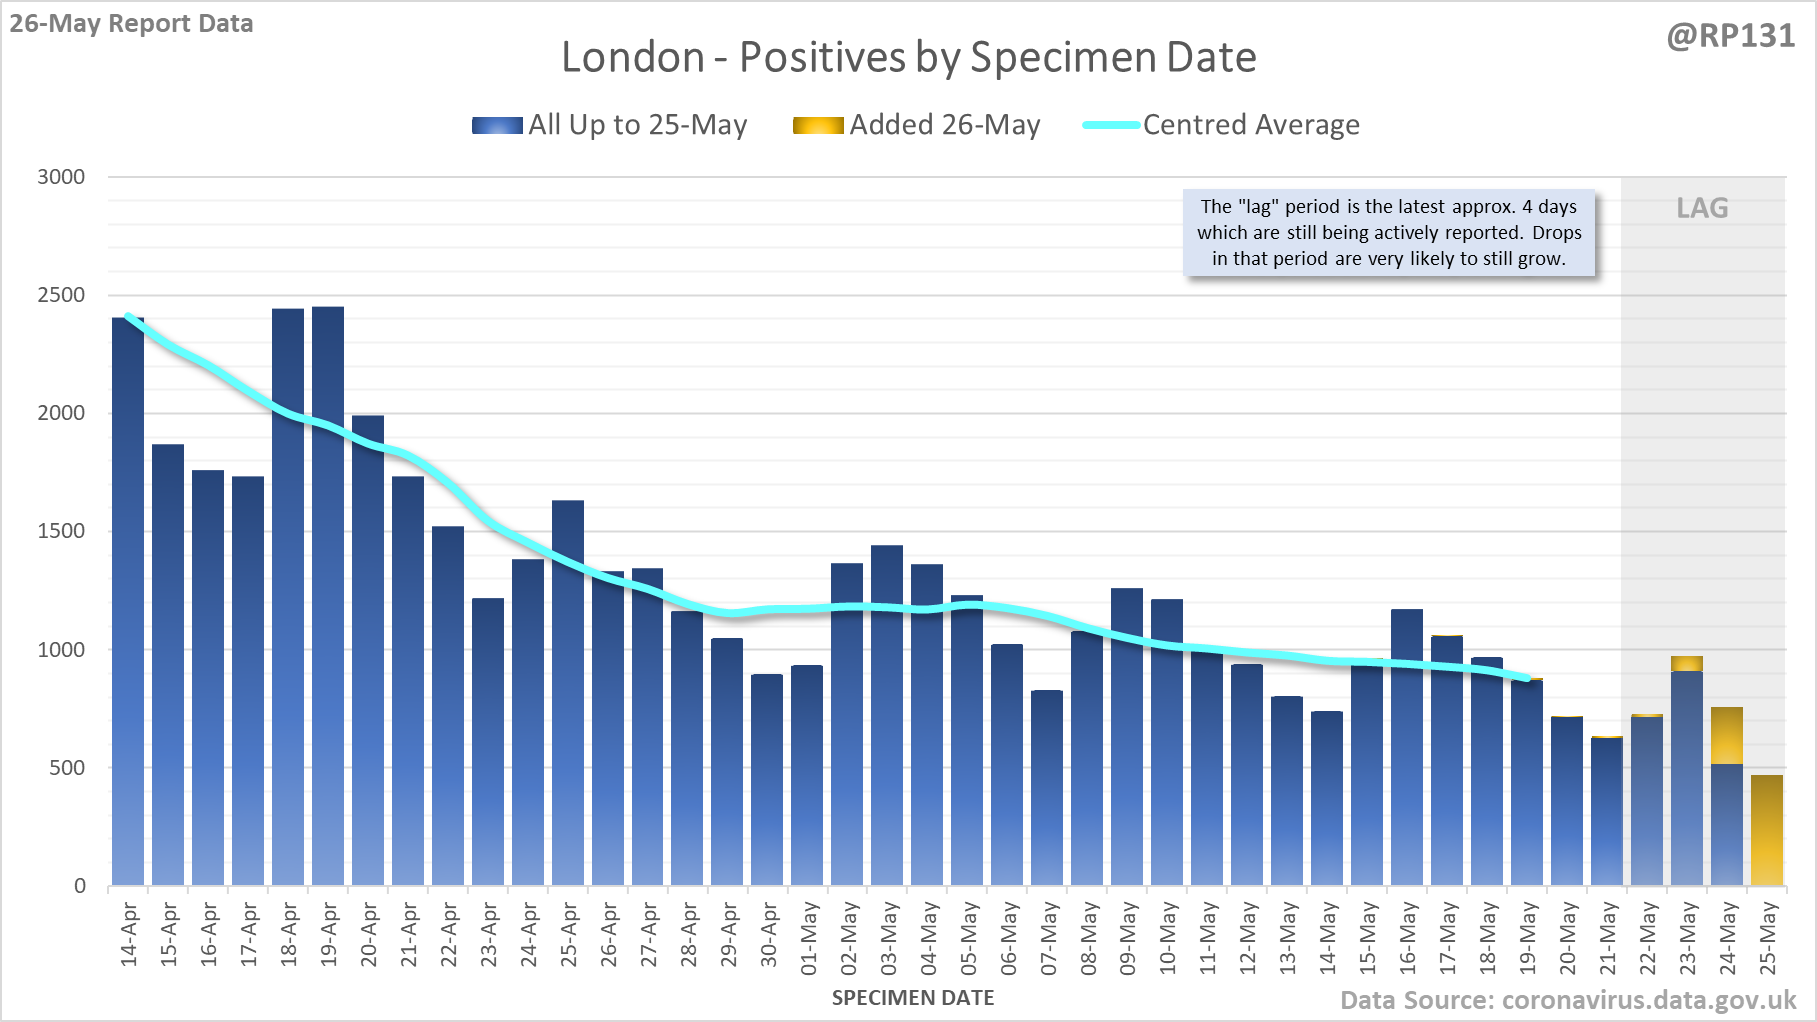
[12/14] And England regions, starting with North West, North East, Yorkshire & Humber and West Midlands. Again, note the different scales.
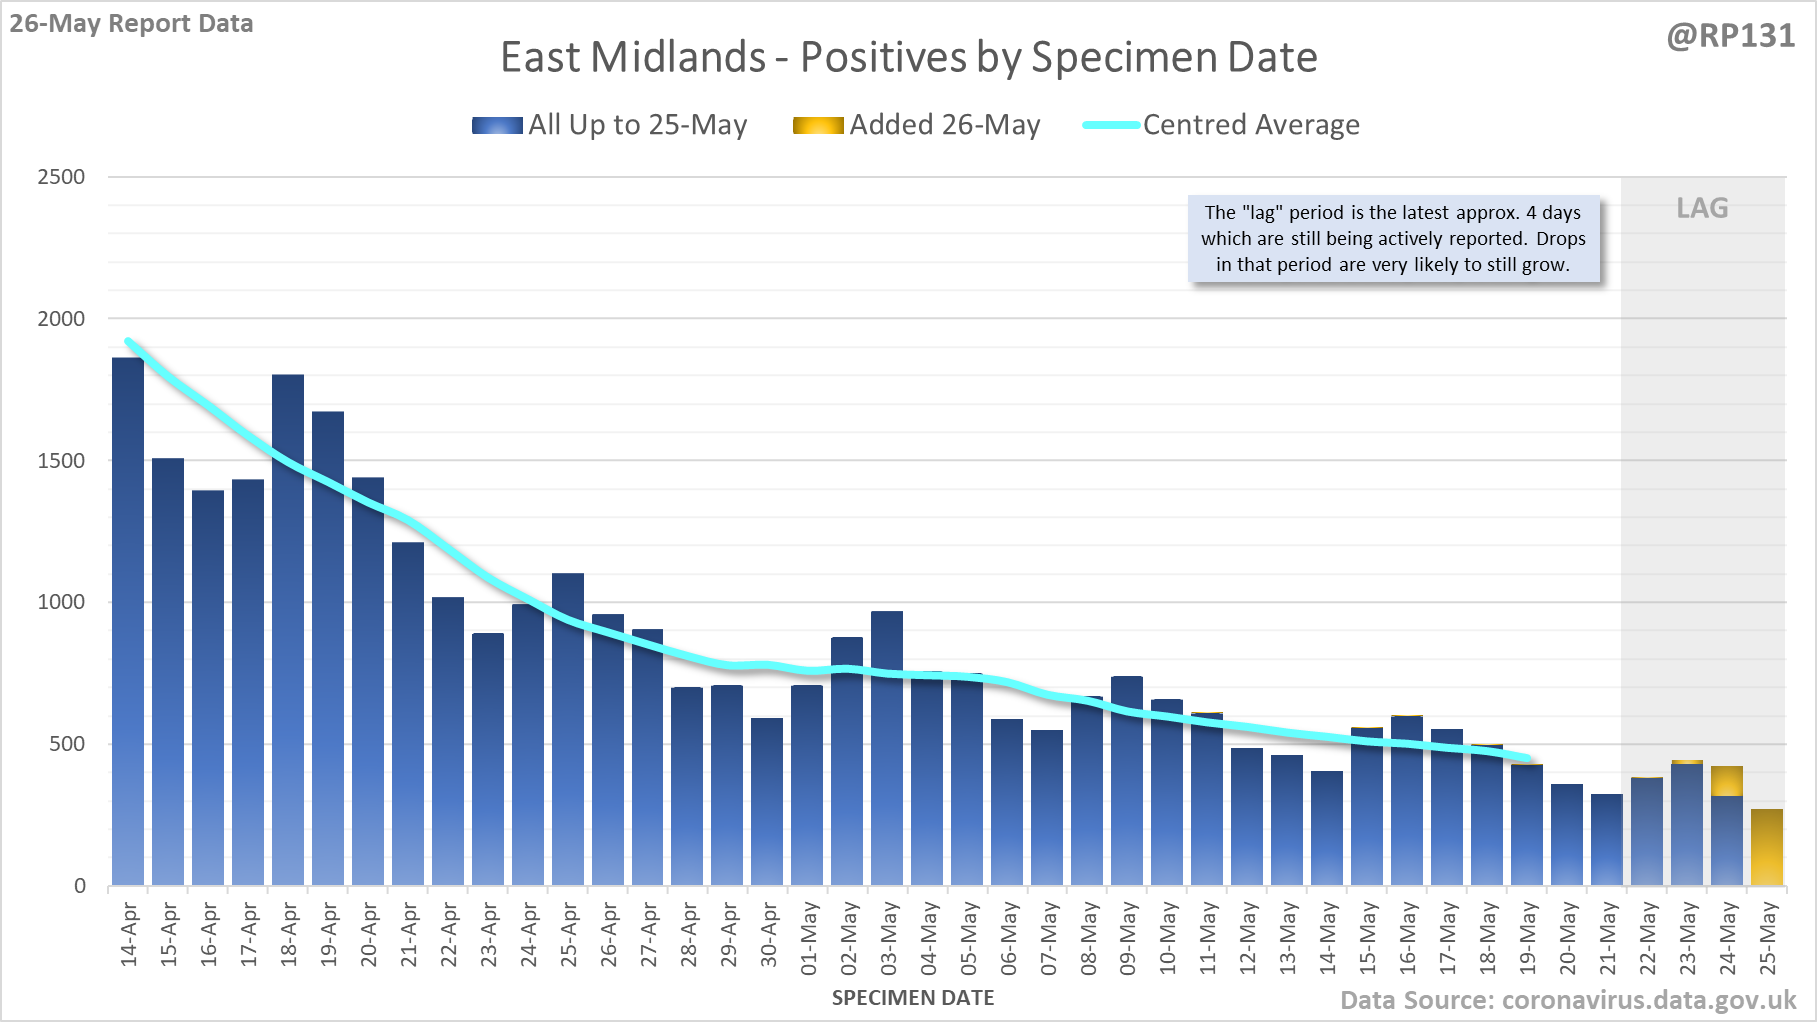
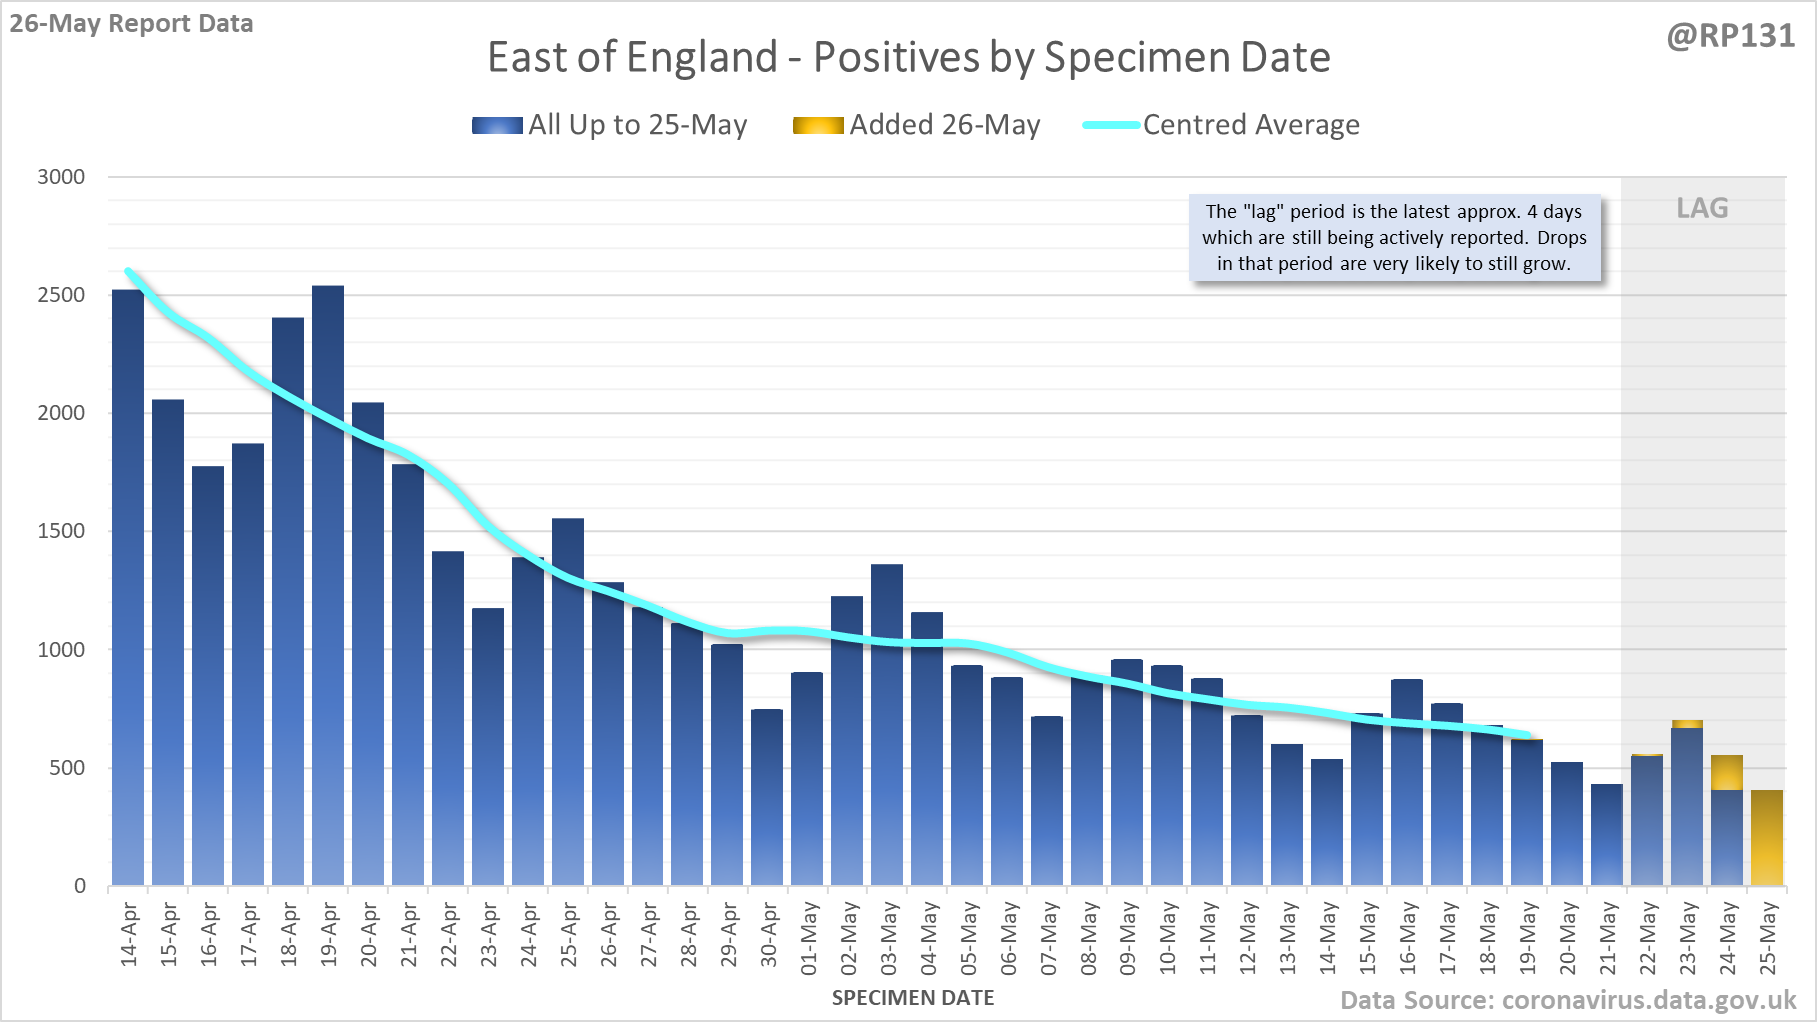
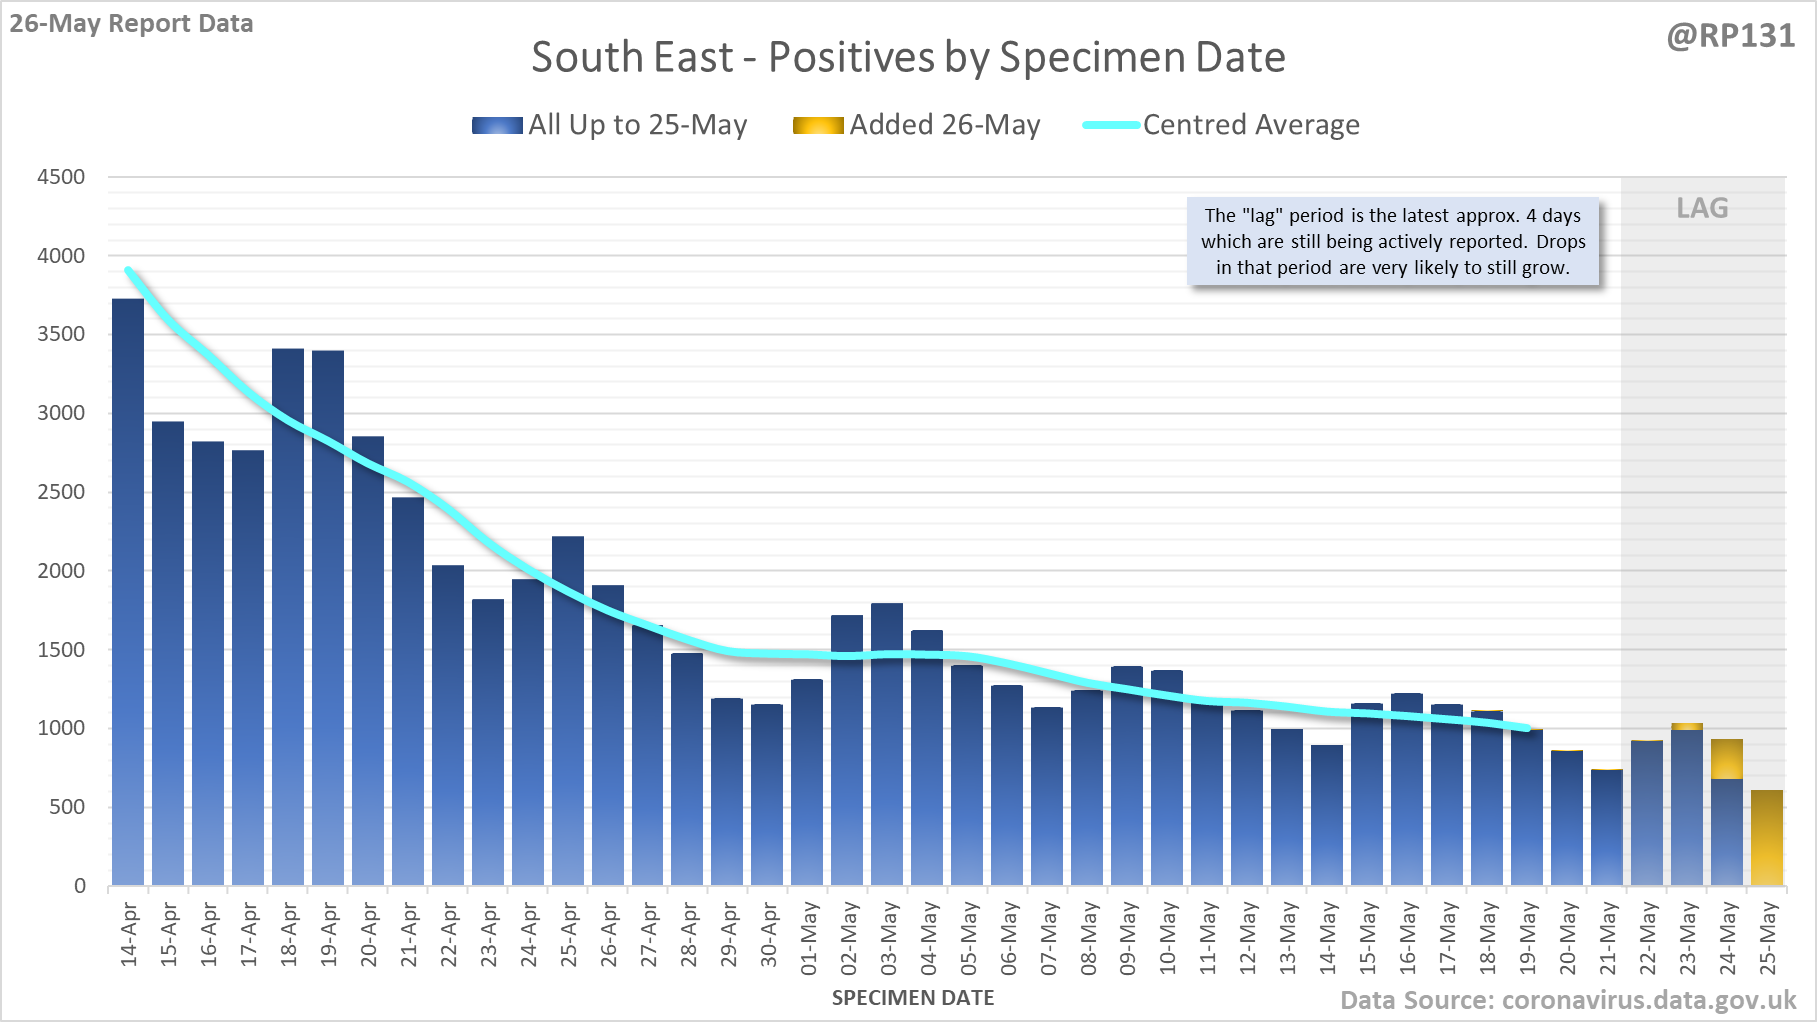
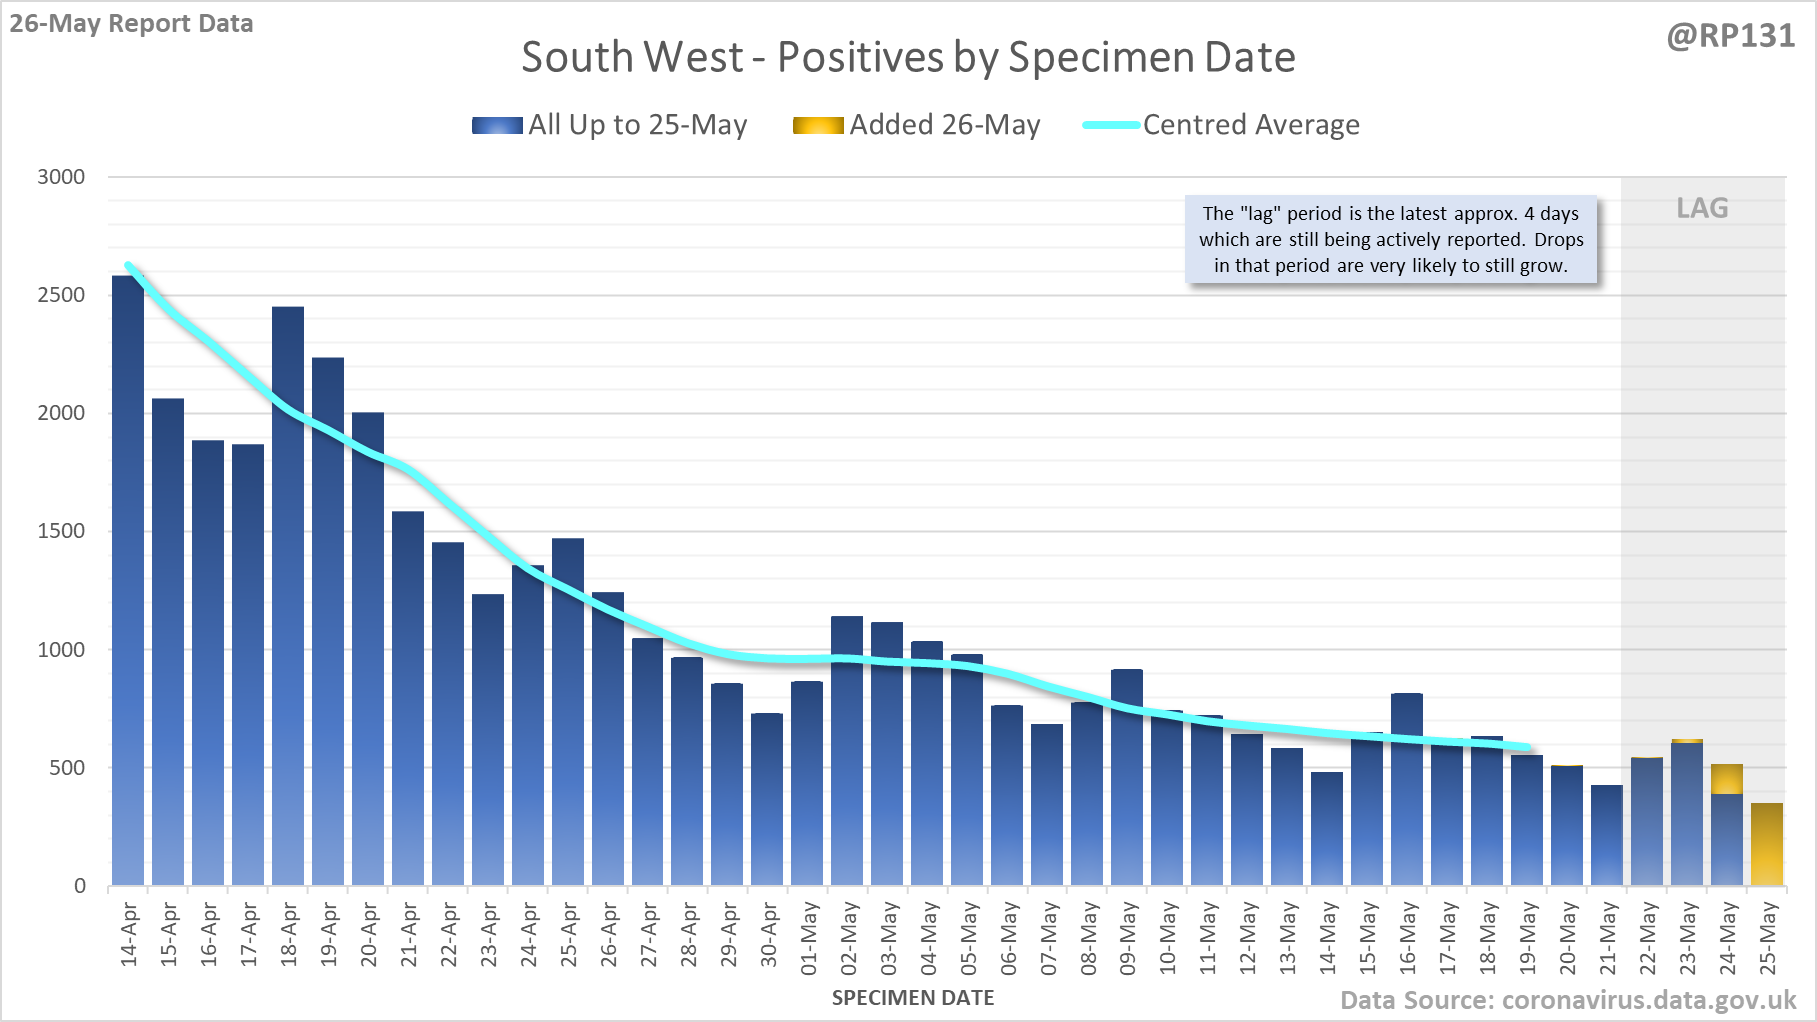
[13/14] Plus East Midlands, East of England, South East and South West. Again, note the different scales.
