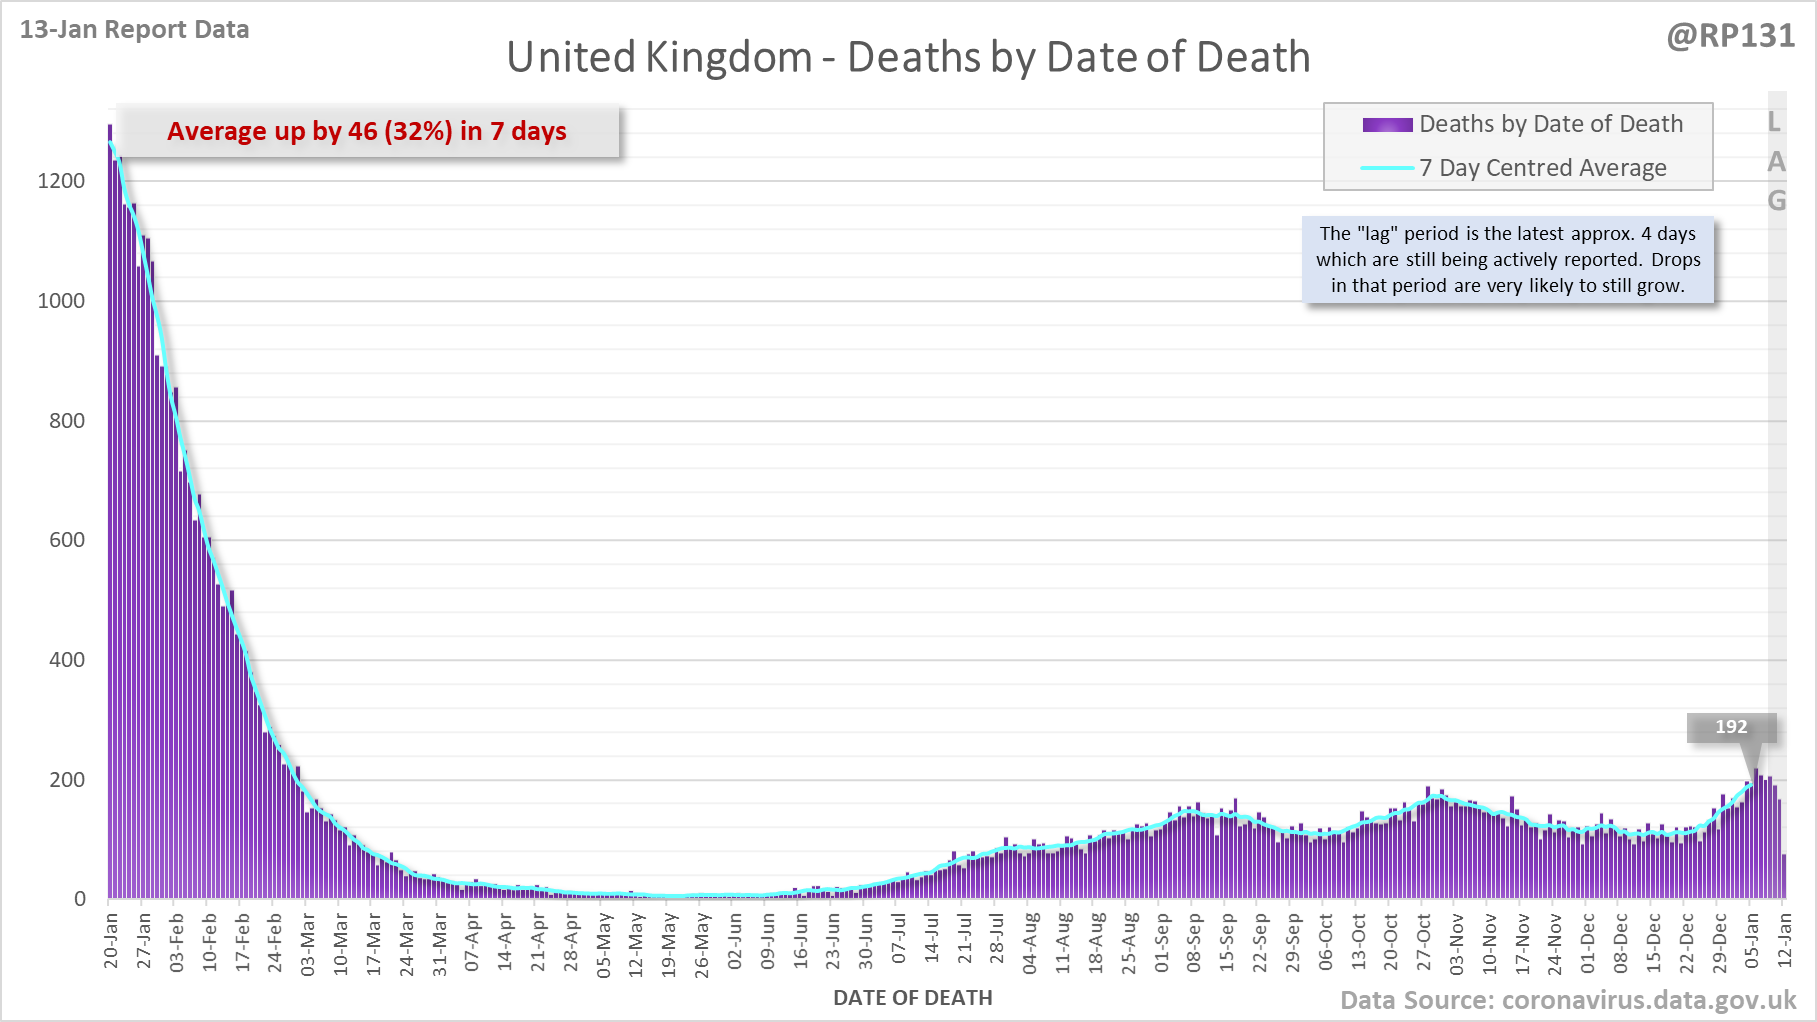
[1/8] 335 new #covid19uk deaths reported today (13-Jan). This brings the rolling average by date of death (allowing 4 days for lag) to 192, an increase of 46 (32%) in the last week.

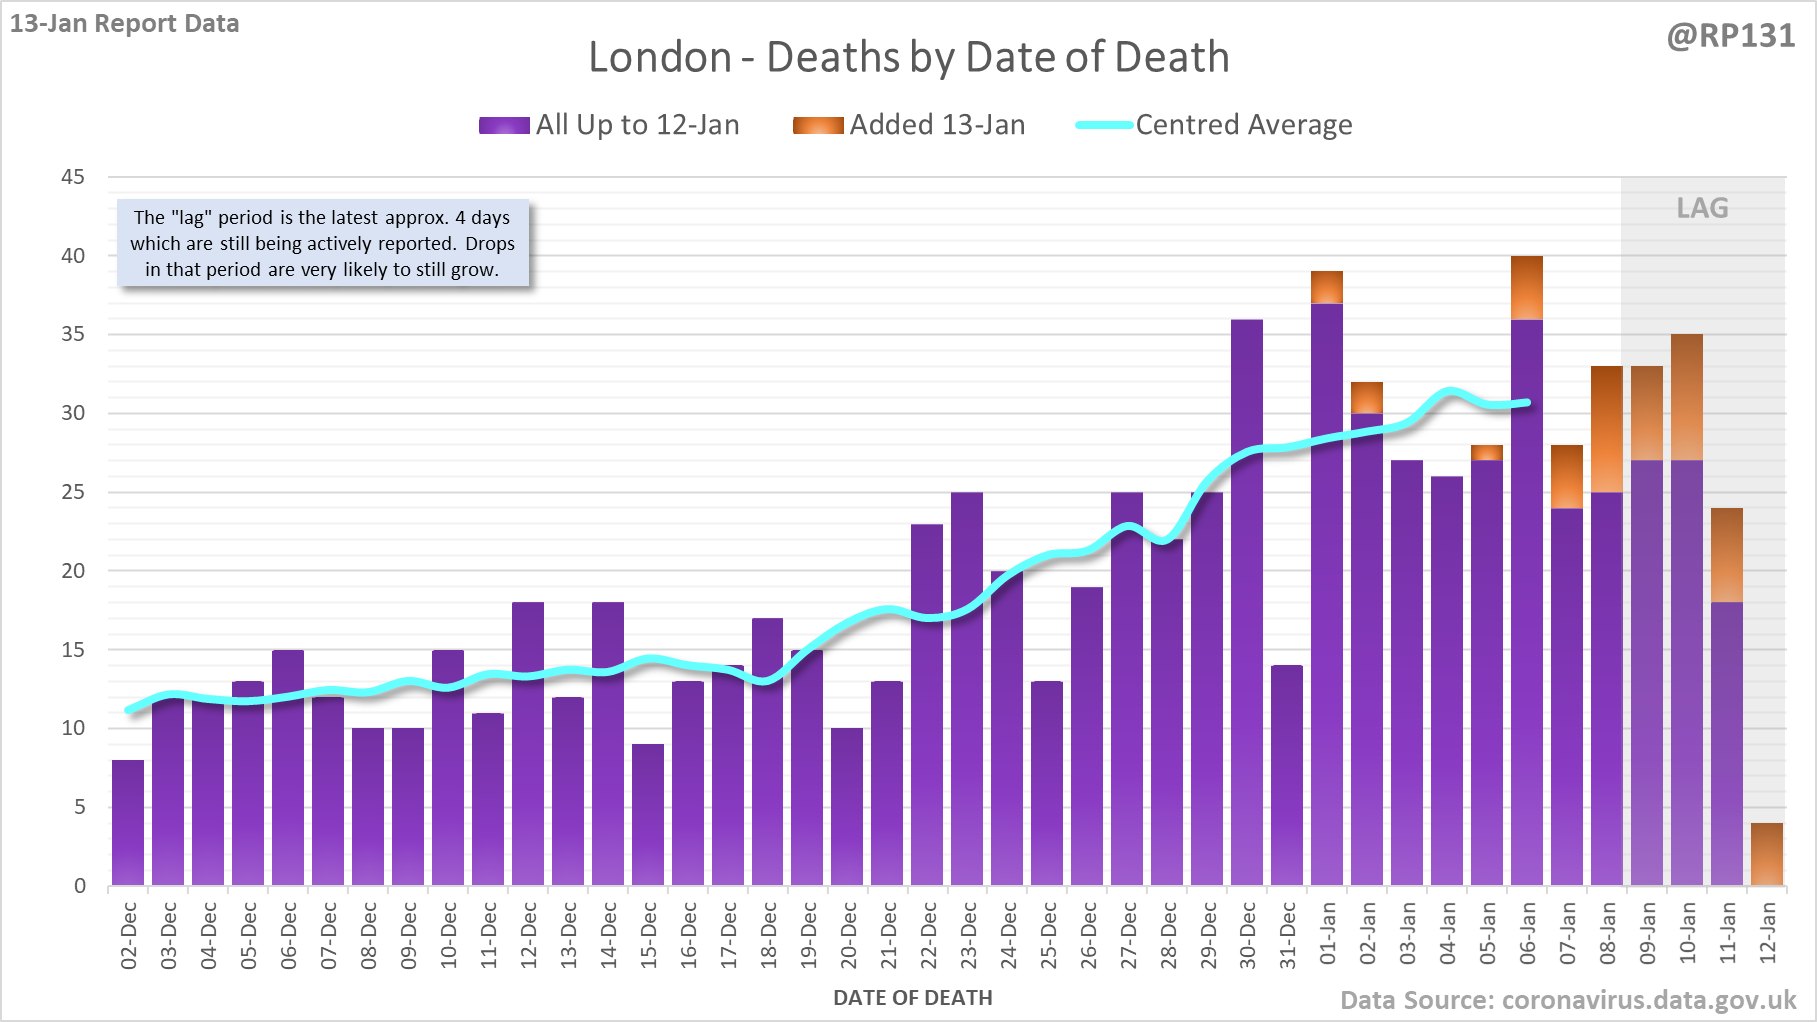
[2/8] Closer look at the latest 45 days, with today's added numbers highlighted in orange. Individual nations and animated England charts further down the thread.
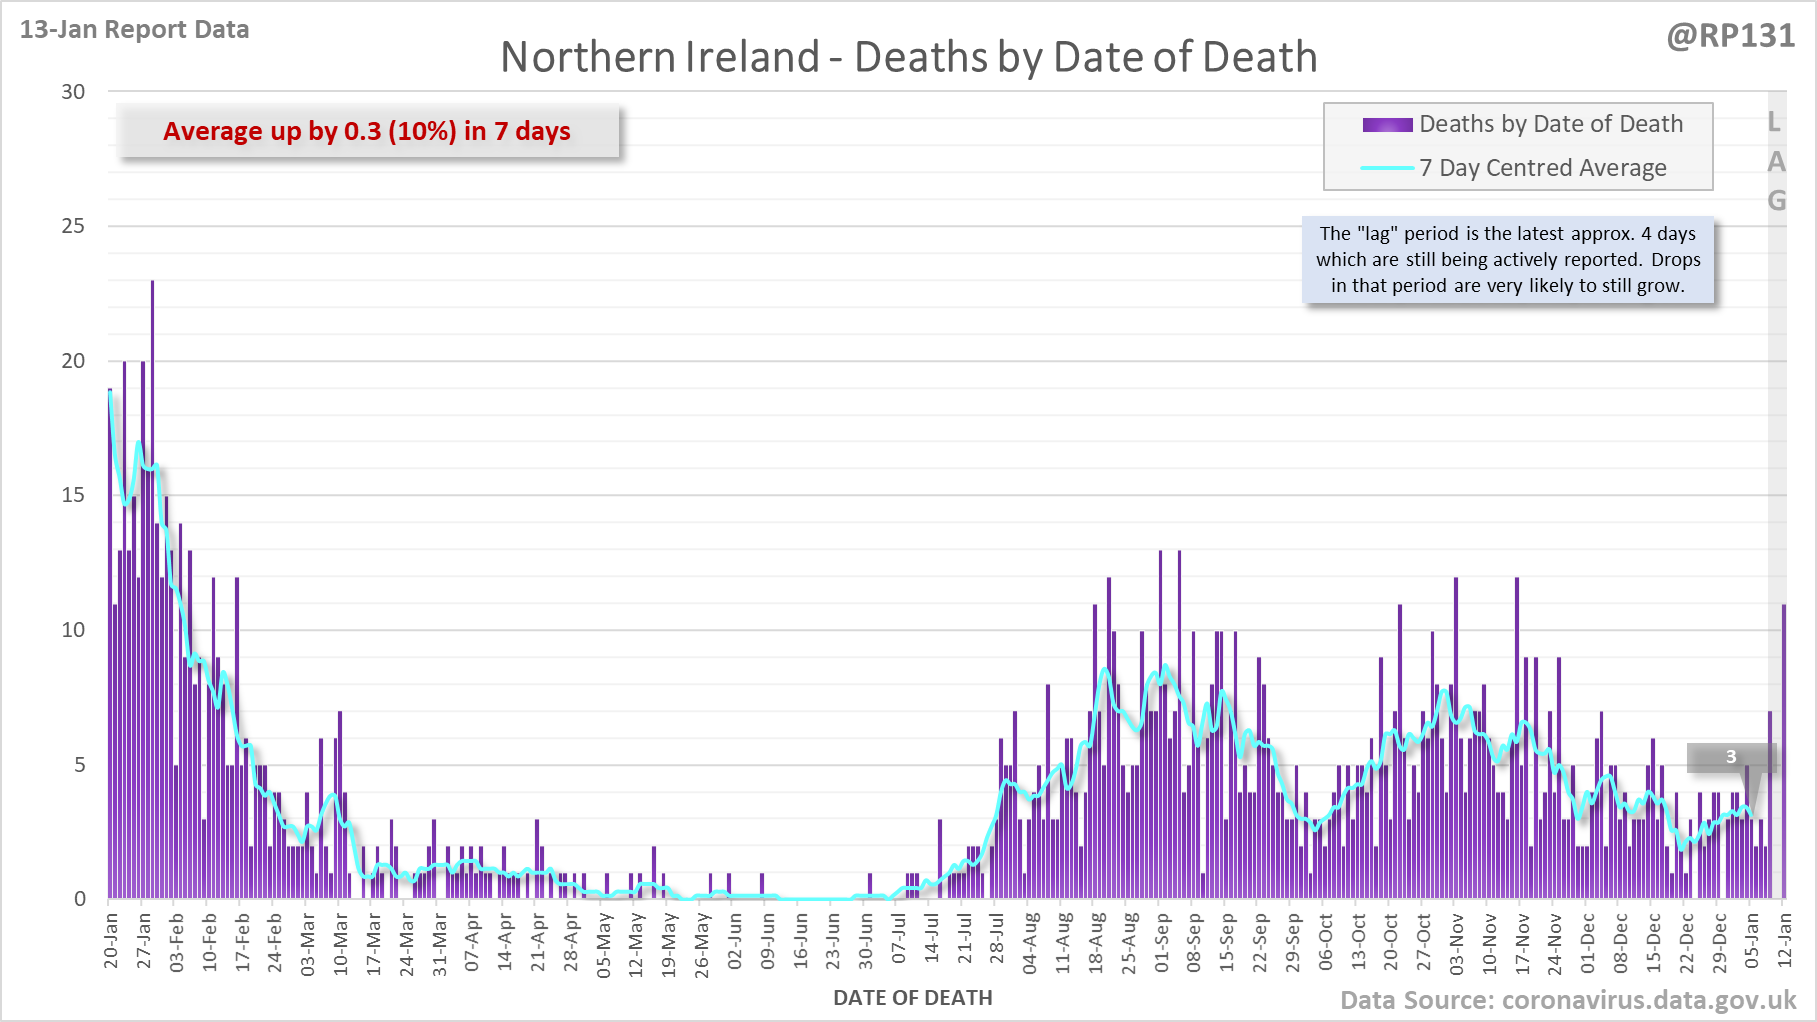
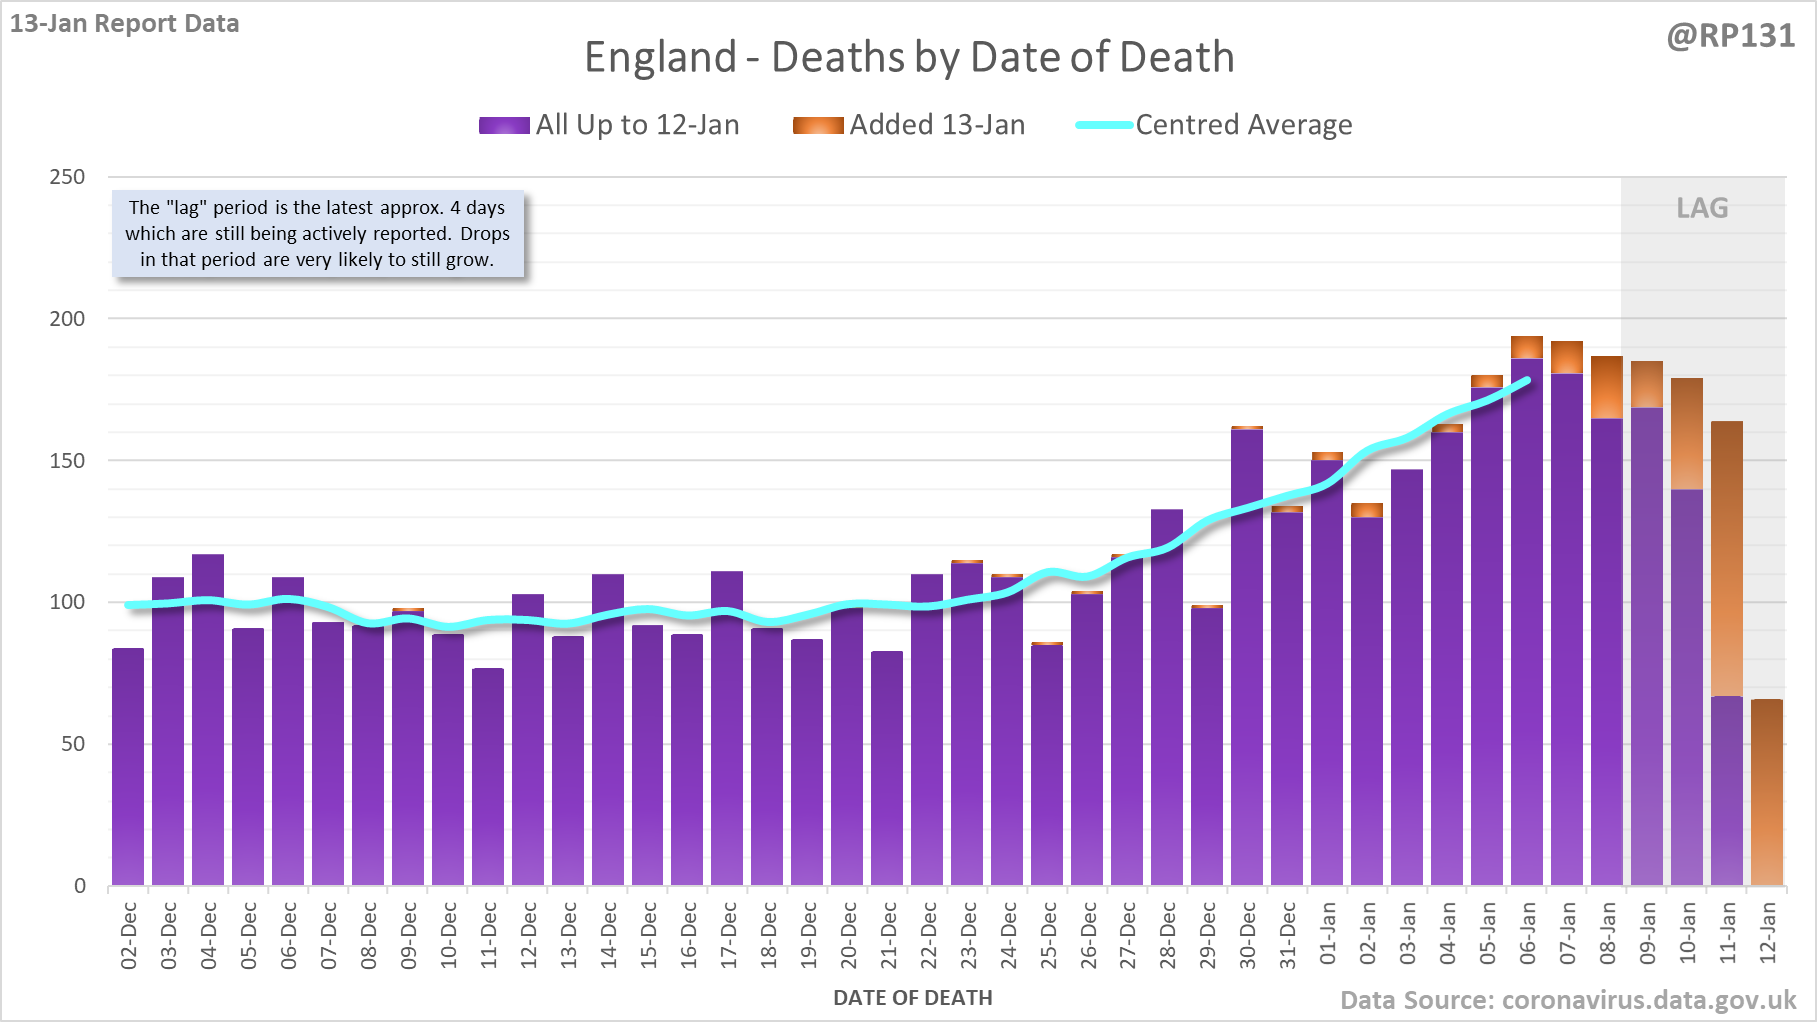
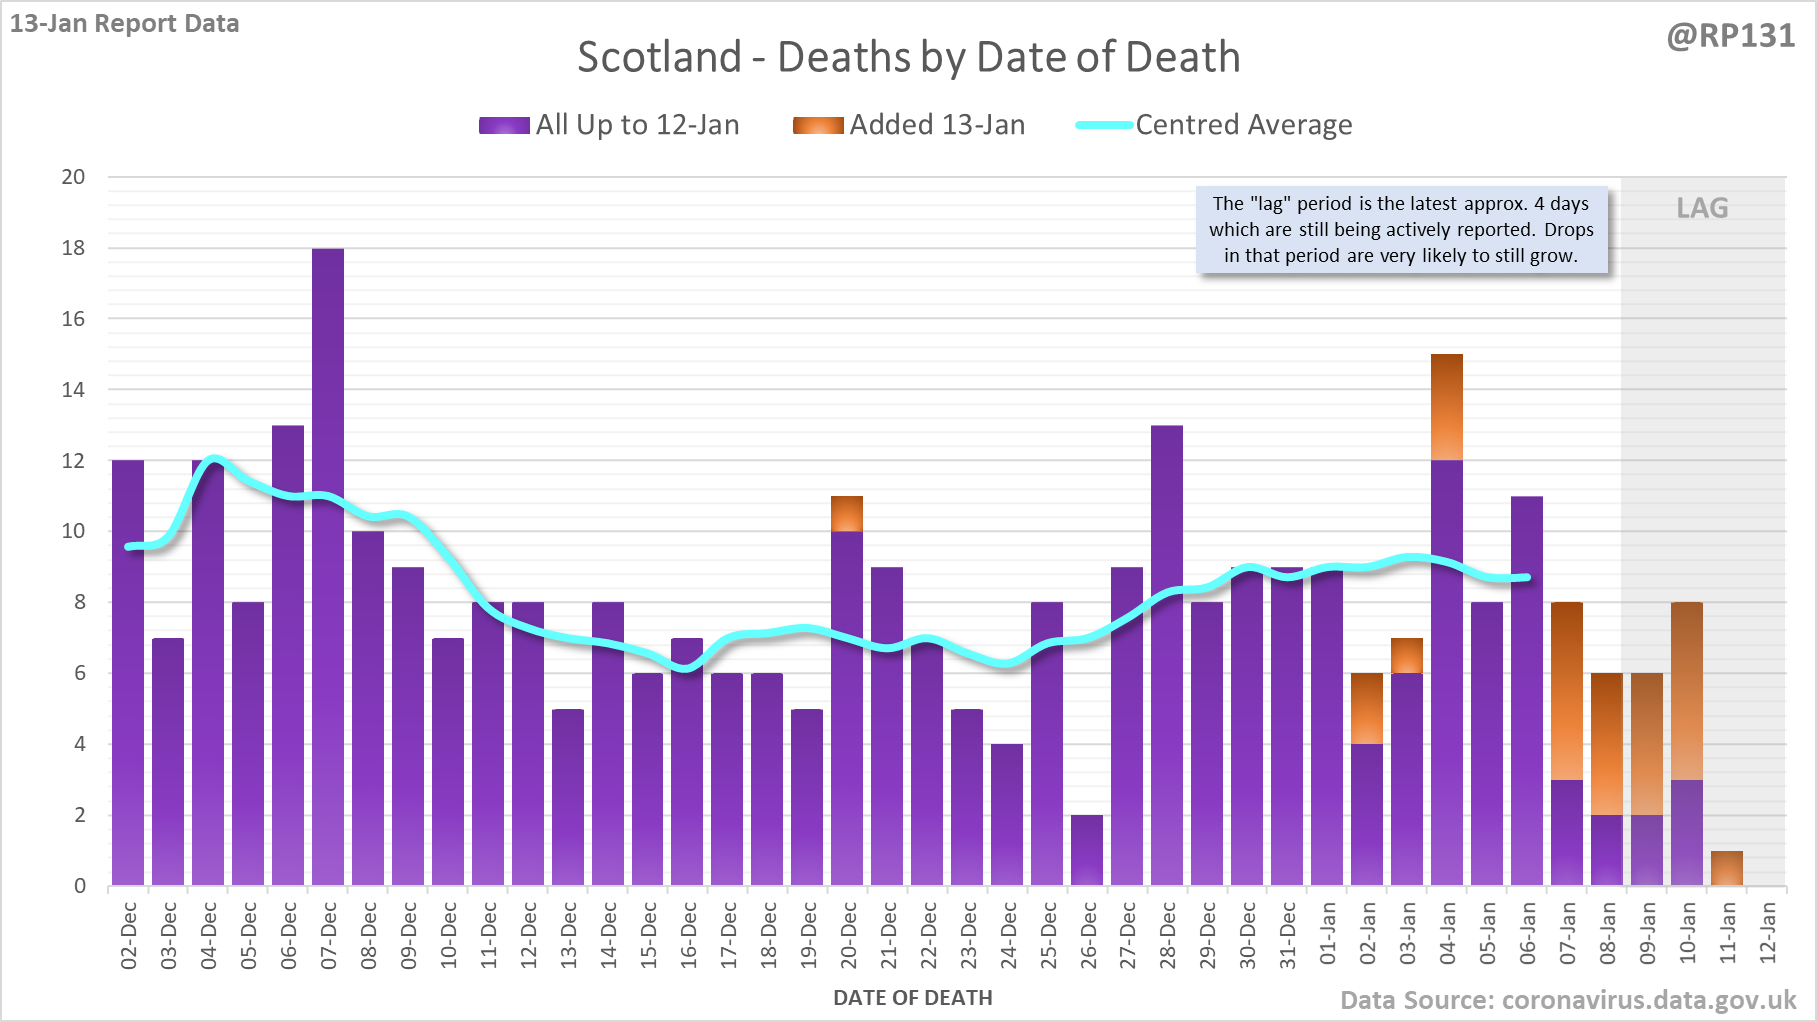
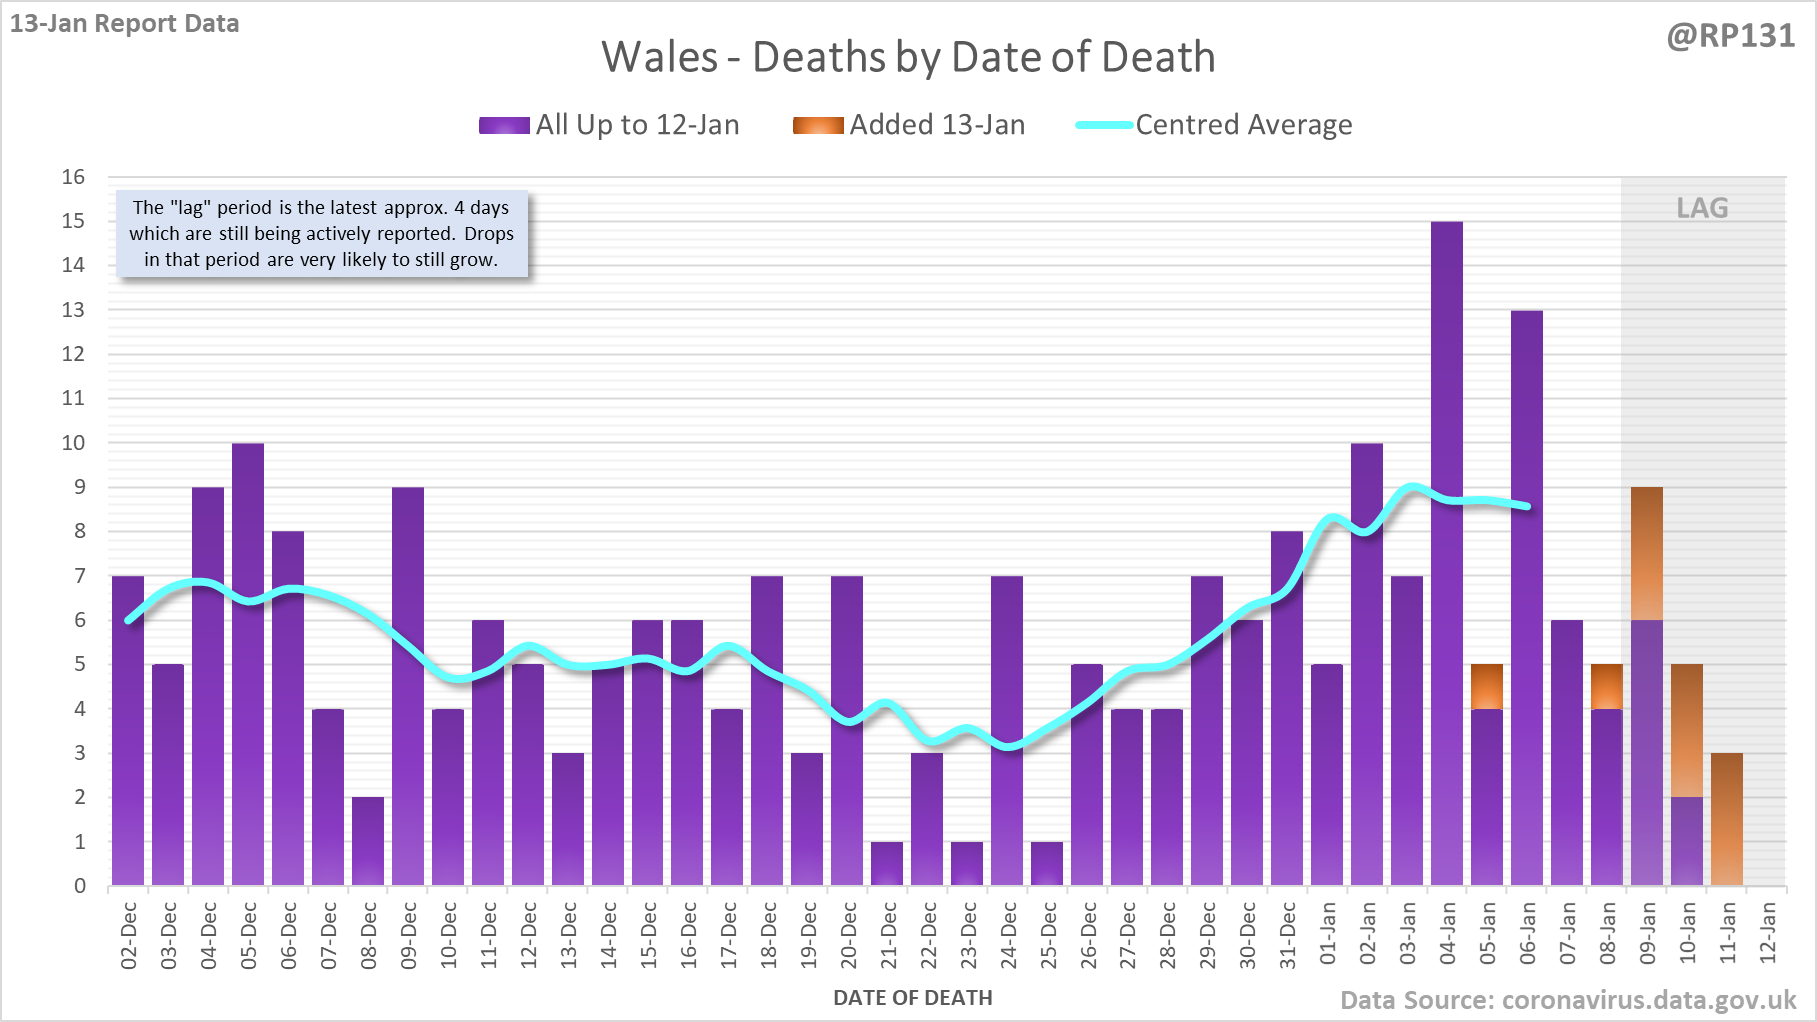
[4/8] Separate charts for England (284) Scotland (26) Wales (11) and Northern Ireland (14). Note the different scales. Also on certain days the date-of-death data for Scotland/Wales/NI doesn't get updated so the orange bars may be mising or include multiple day's numbers.
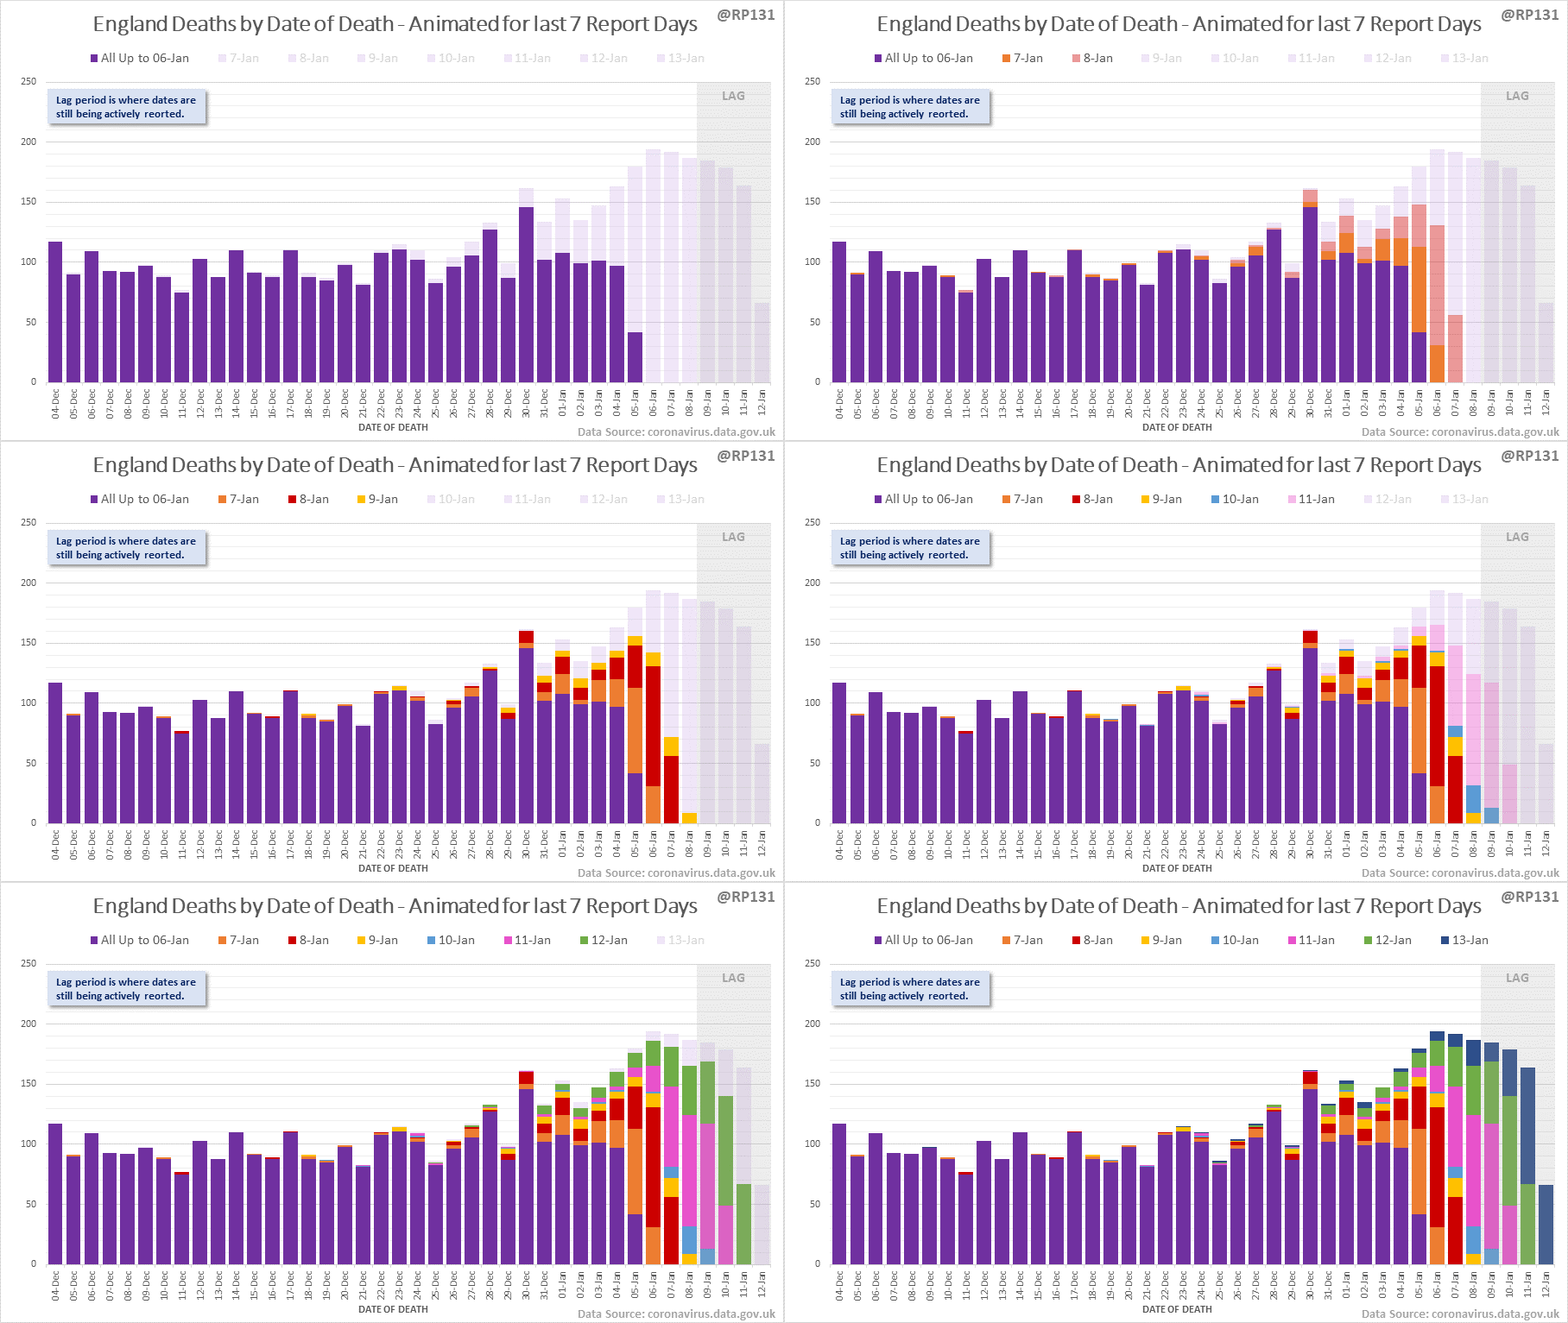
[5/8] Animated chart to show how the #covid19uk deaths by date of death have been contributed to by reports over the last 7 days. Note this just includes England numbers as other nations don't always publish their date-of-death data every day.
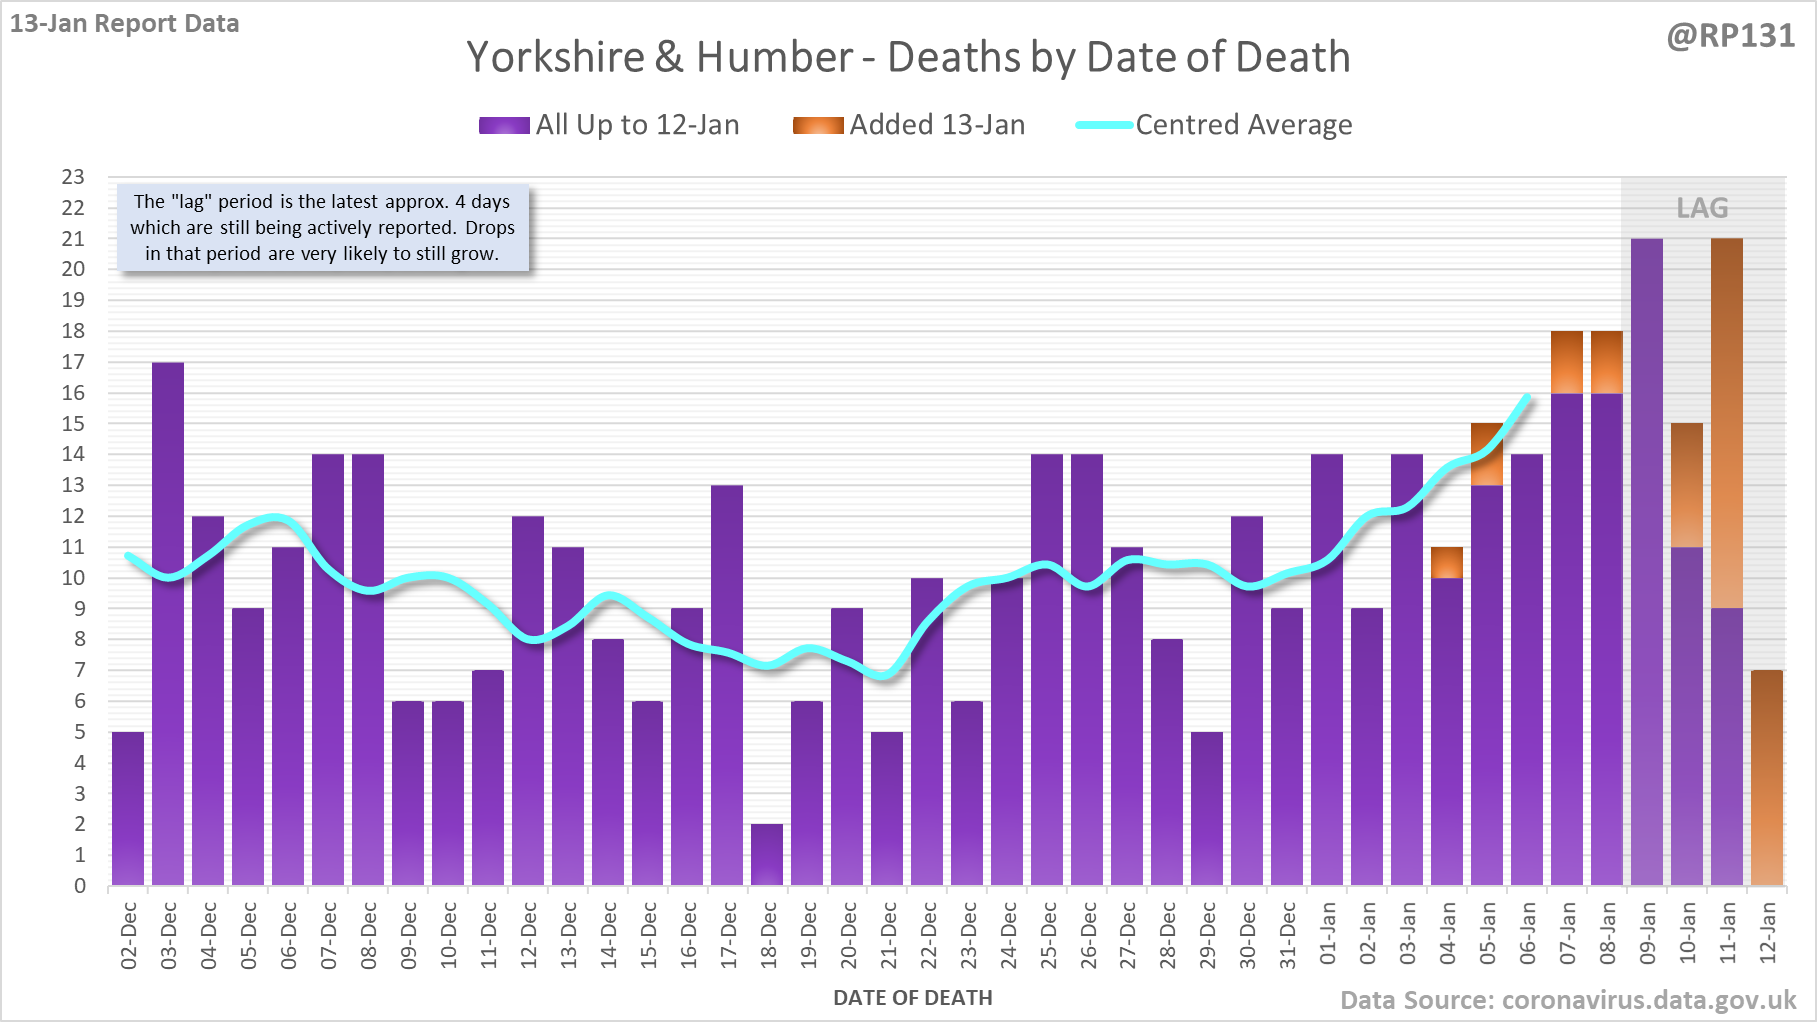
[6/8] And England regions, starting with North West, North East, Yorkshire & Humber and West Midlands. Again, note the different scales.
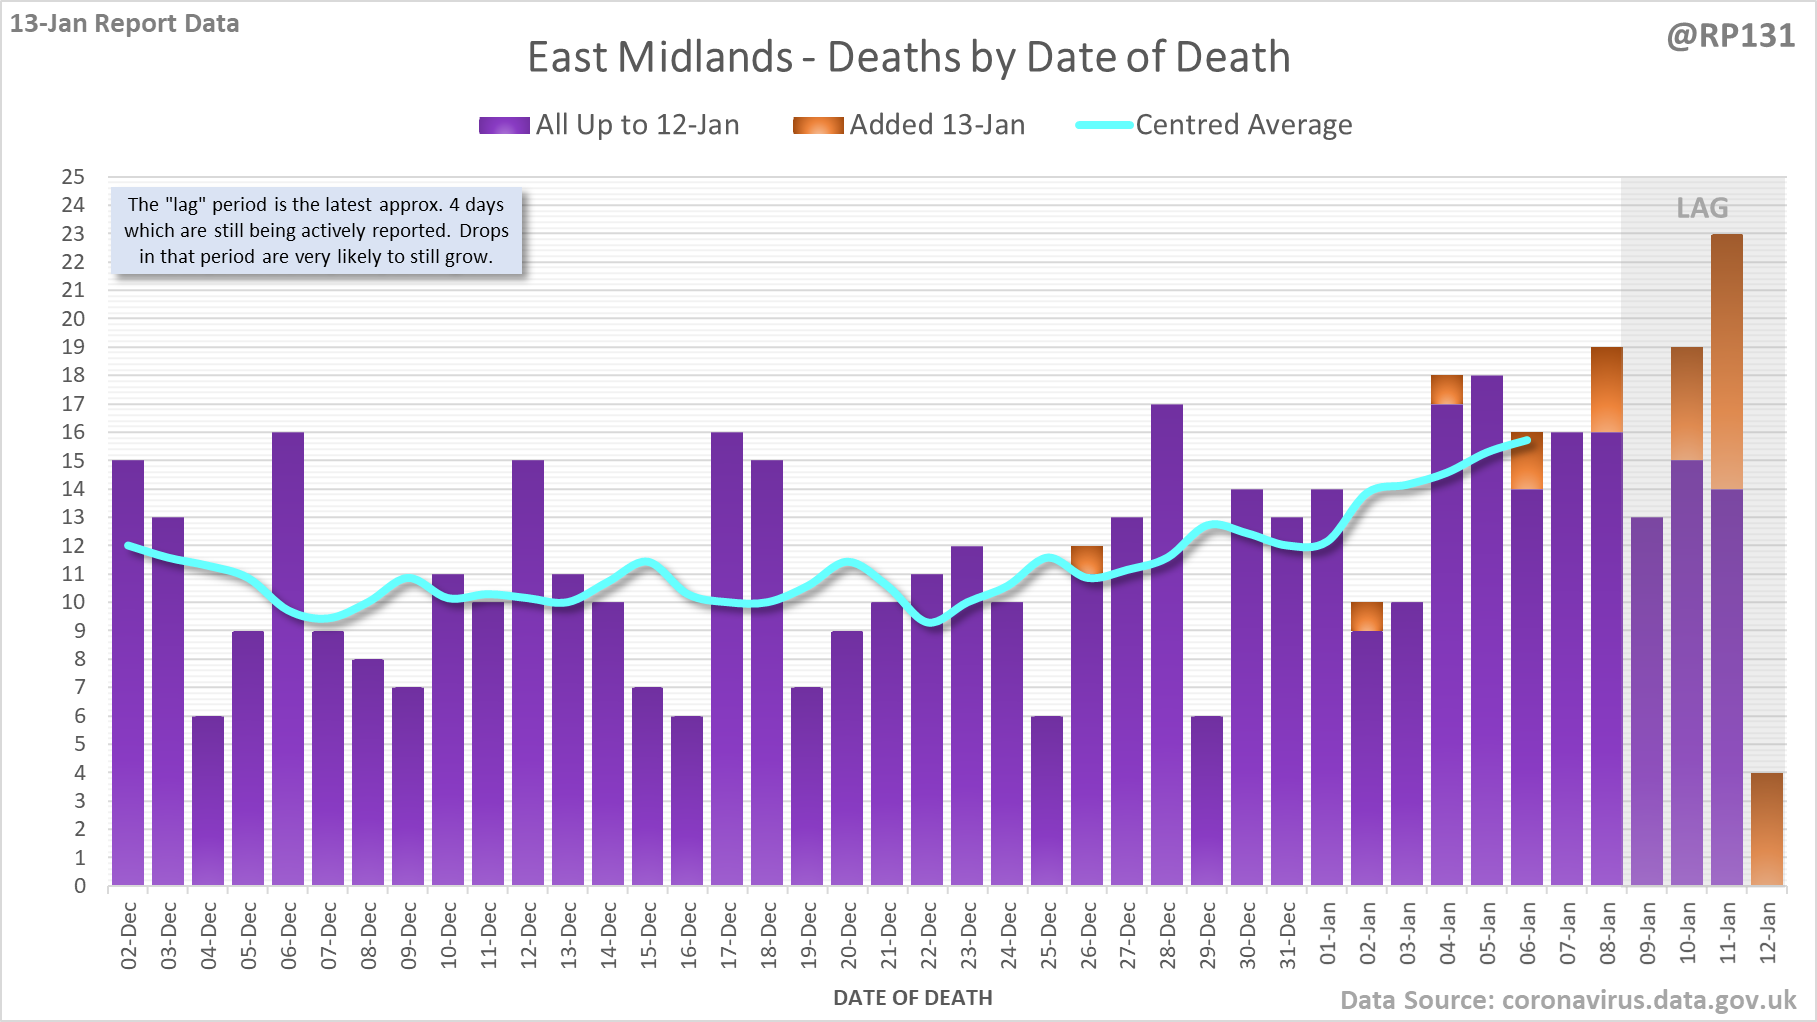
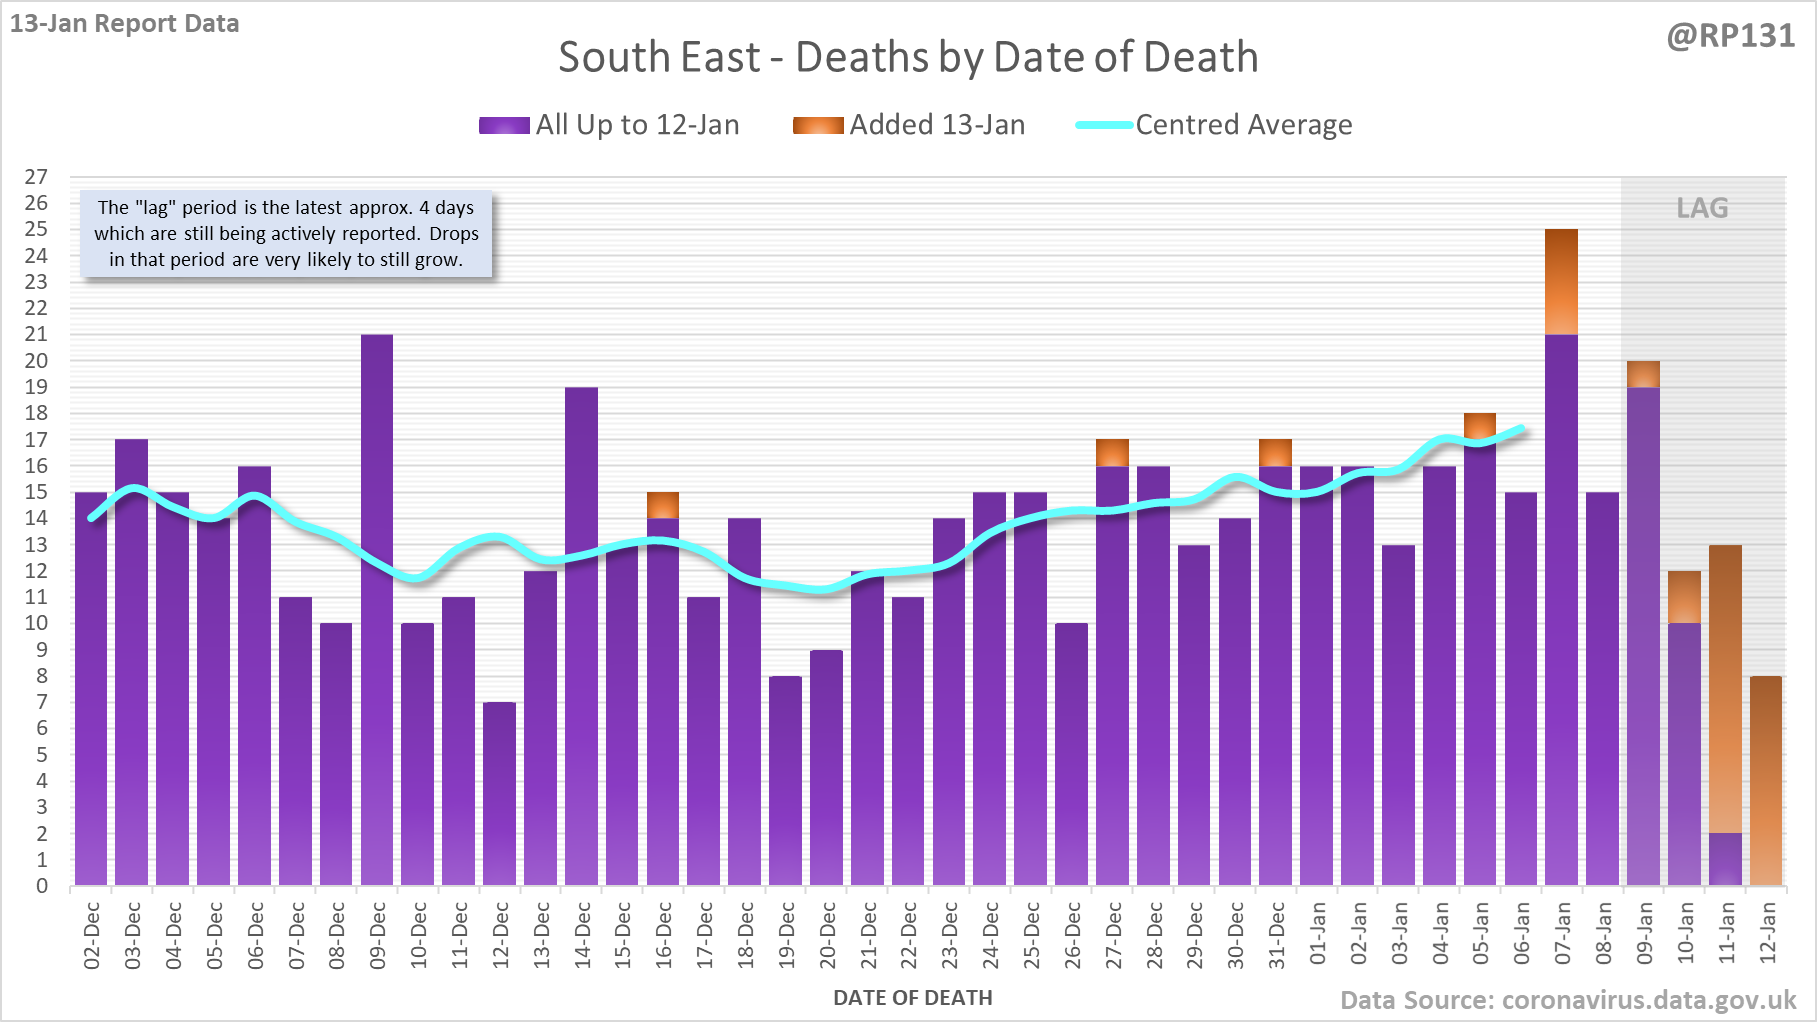
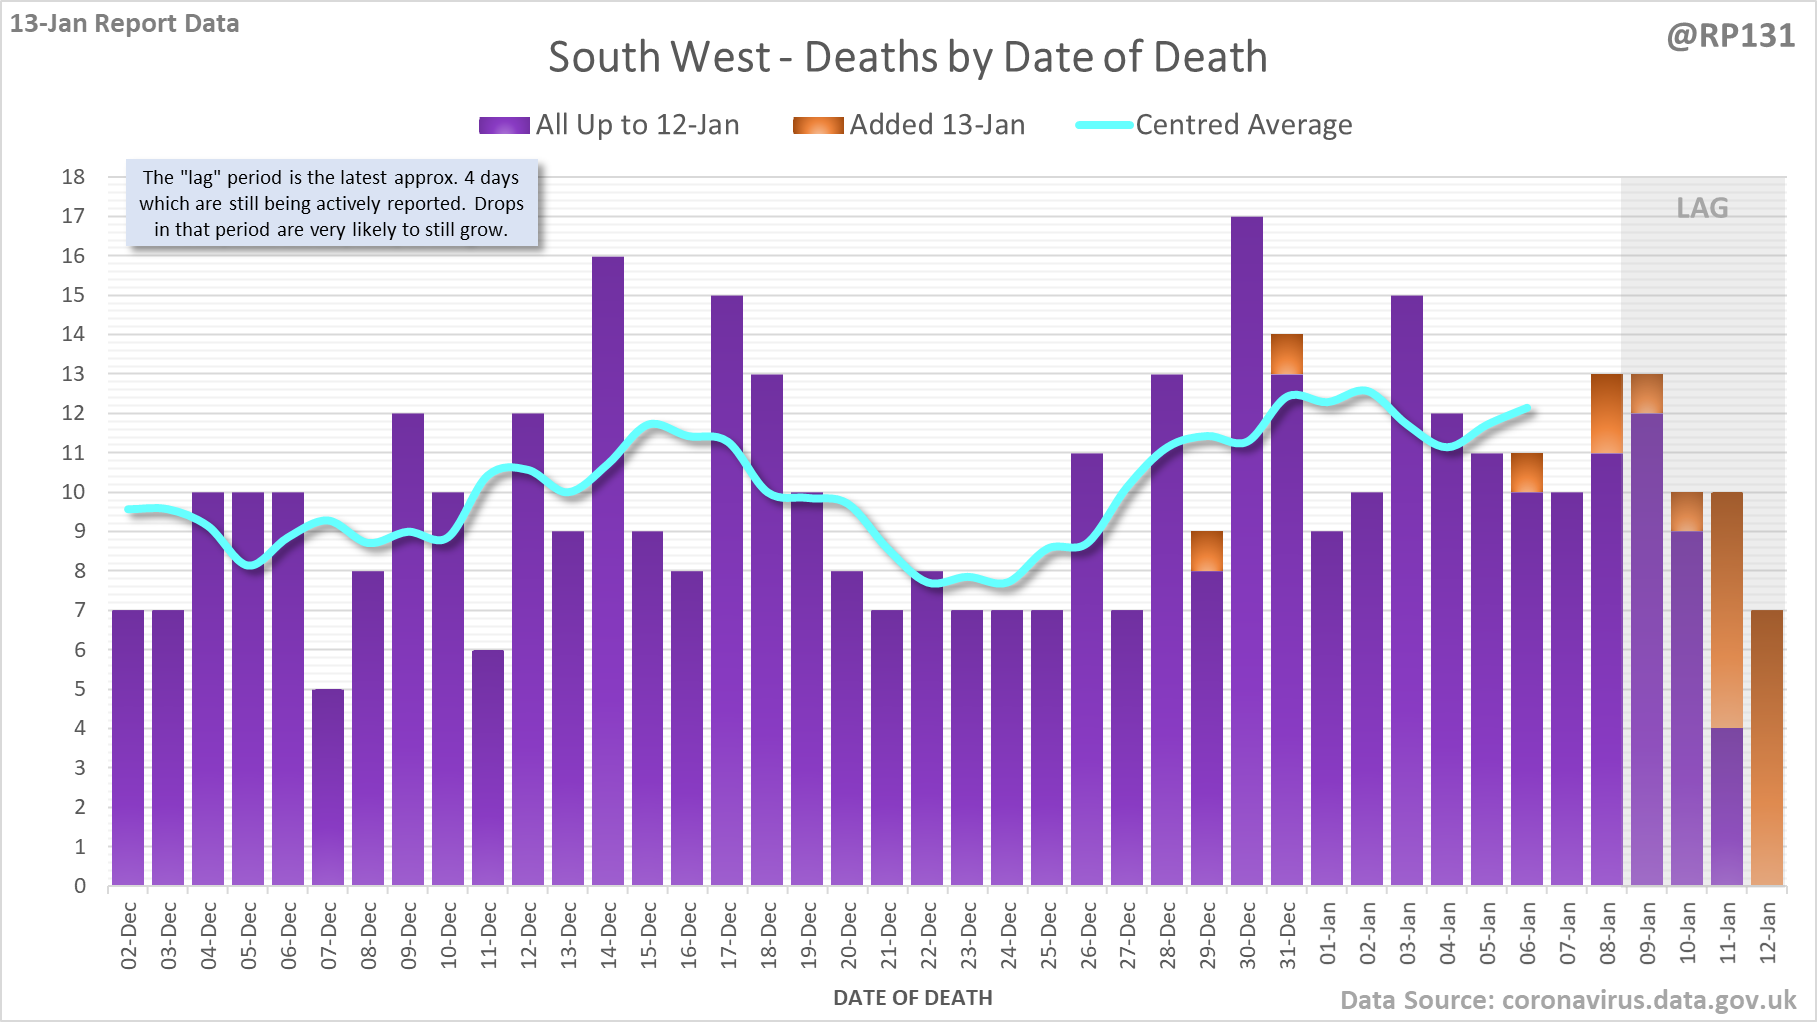
[7/8] Plus East Midlands, East of England, South East and South West. Again, note the different scales.


