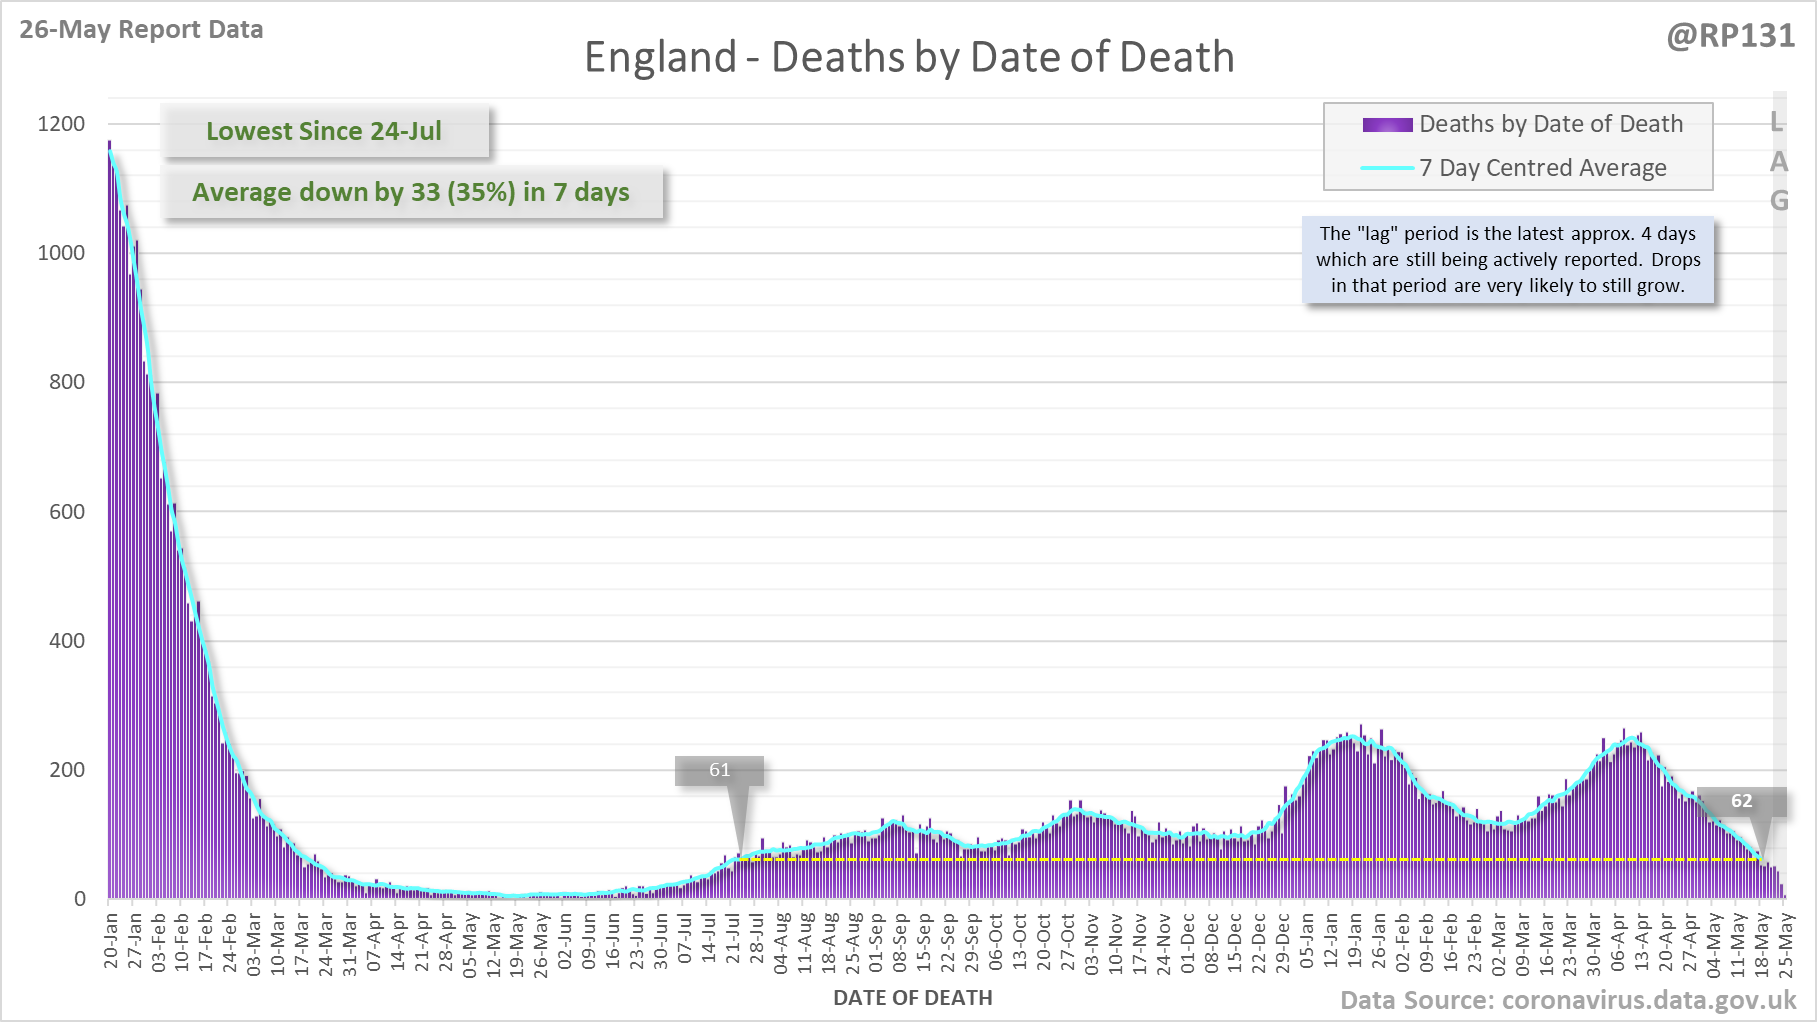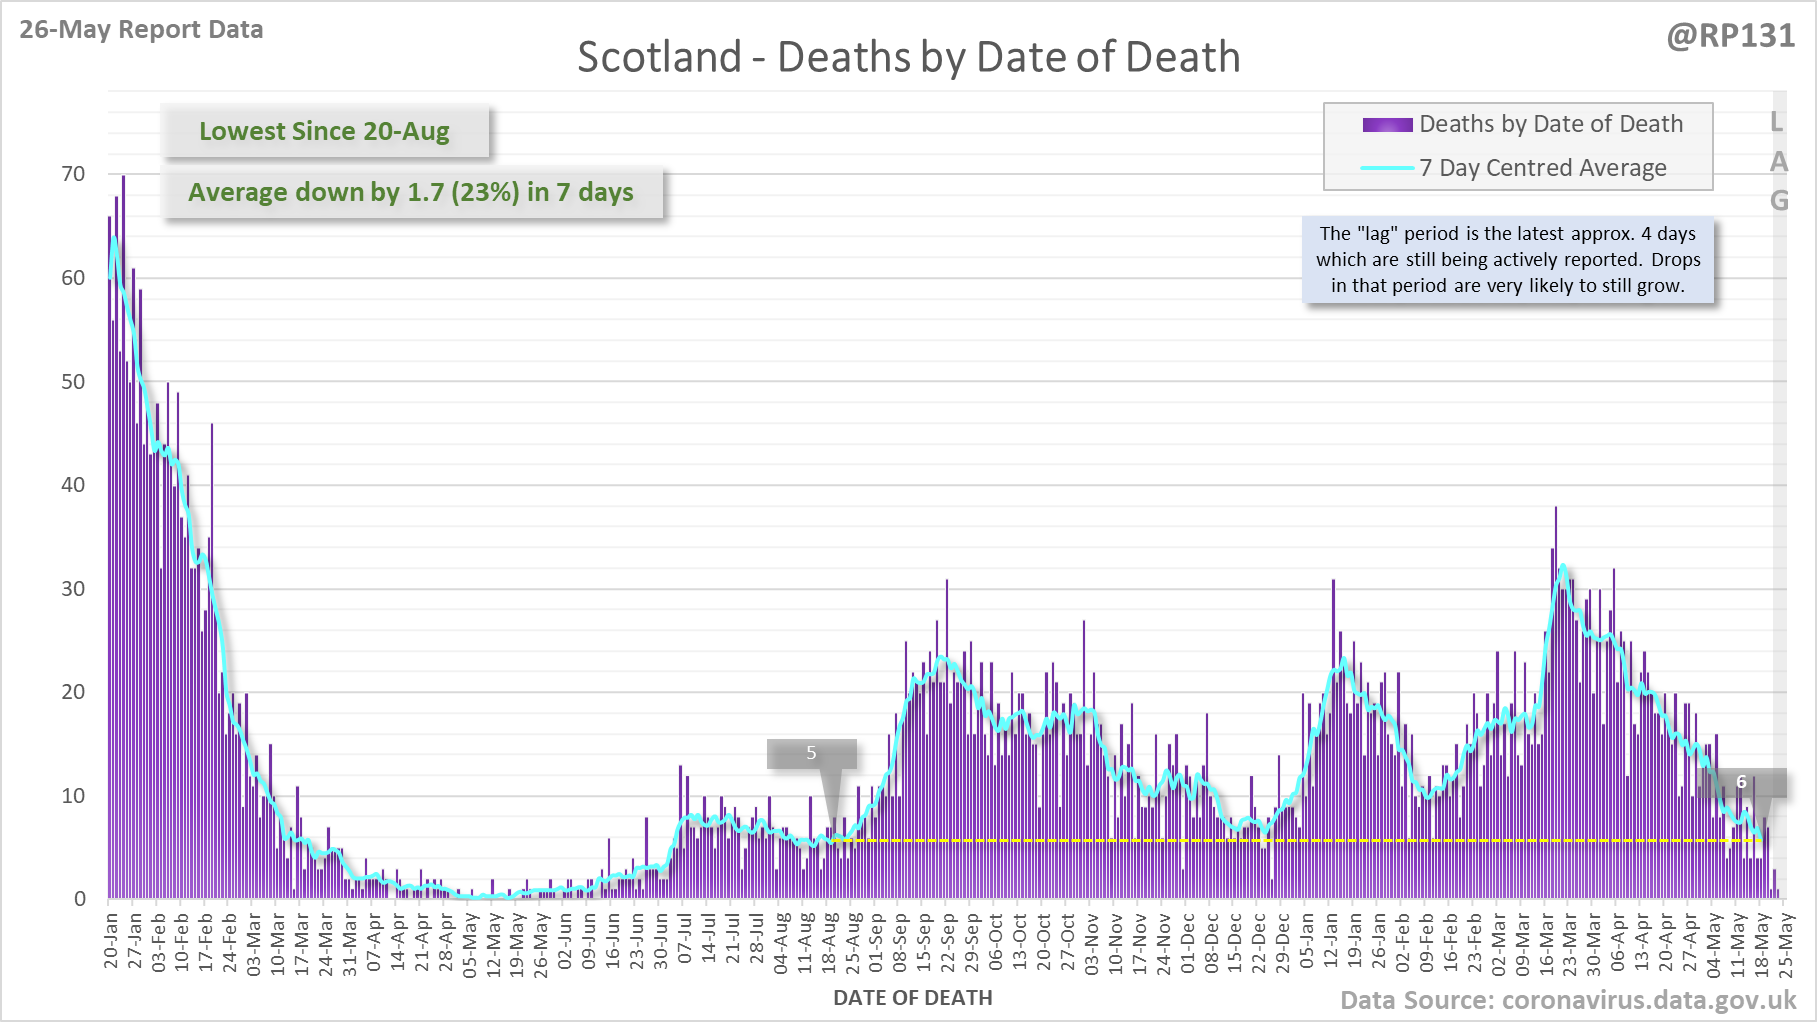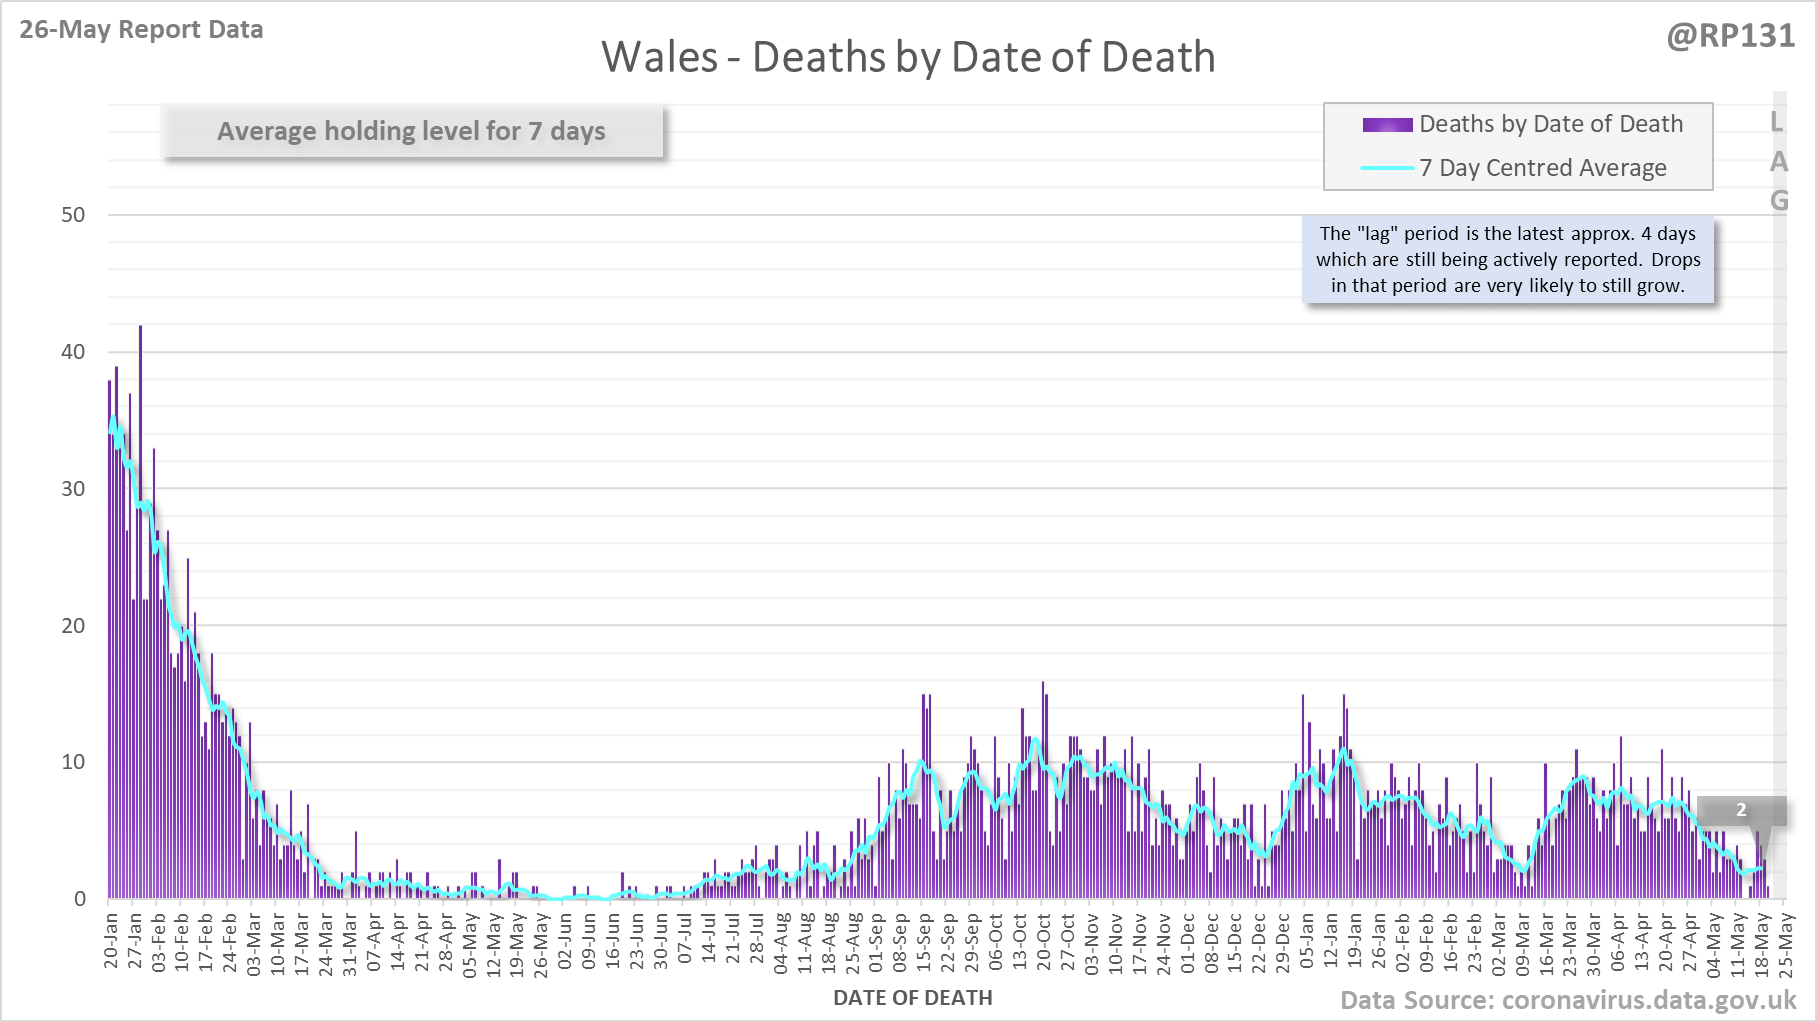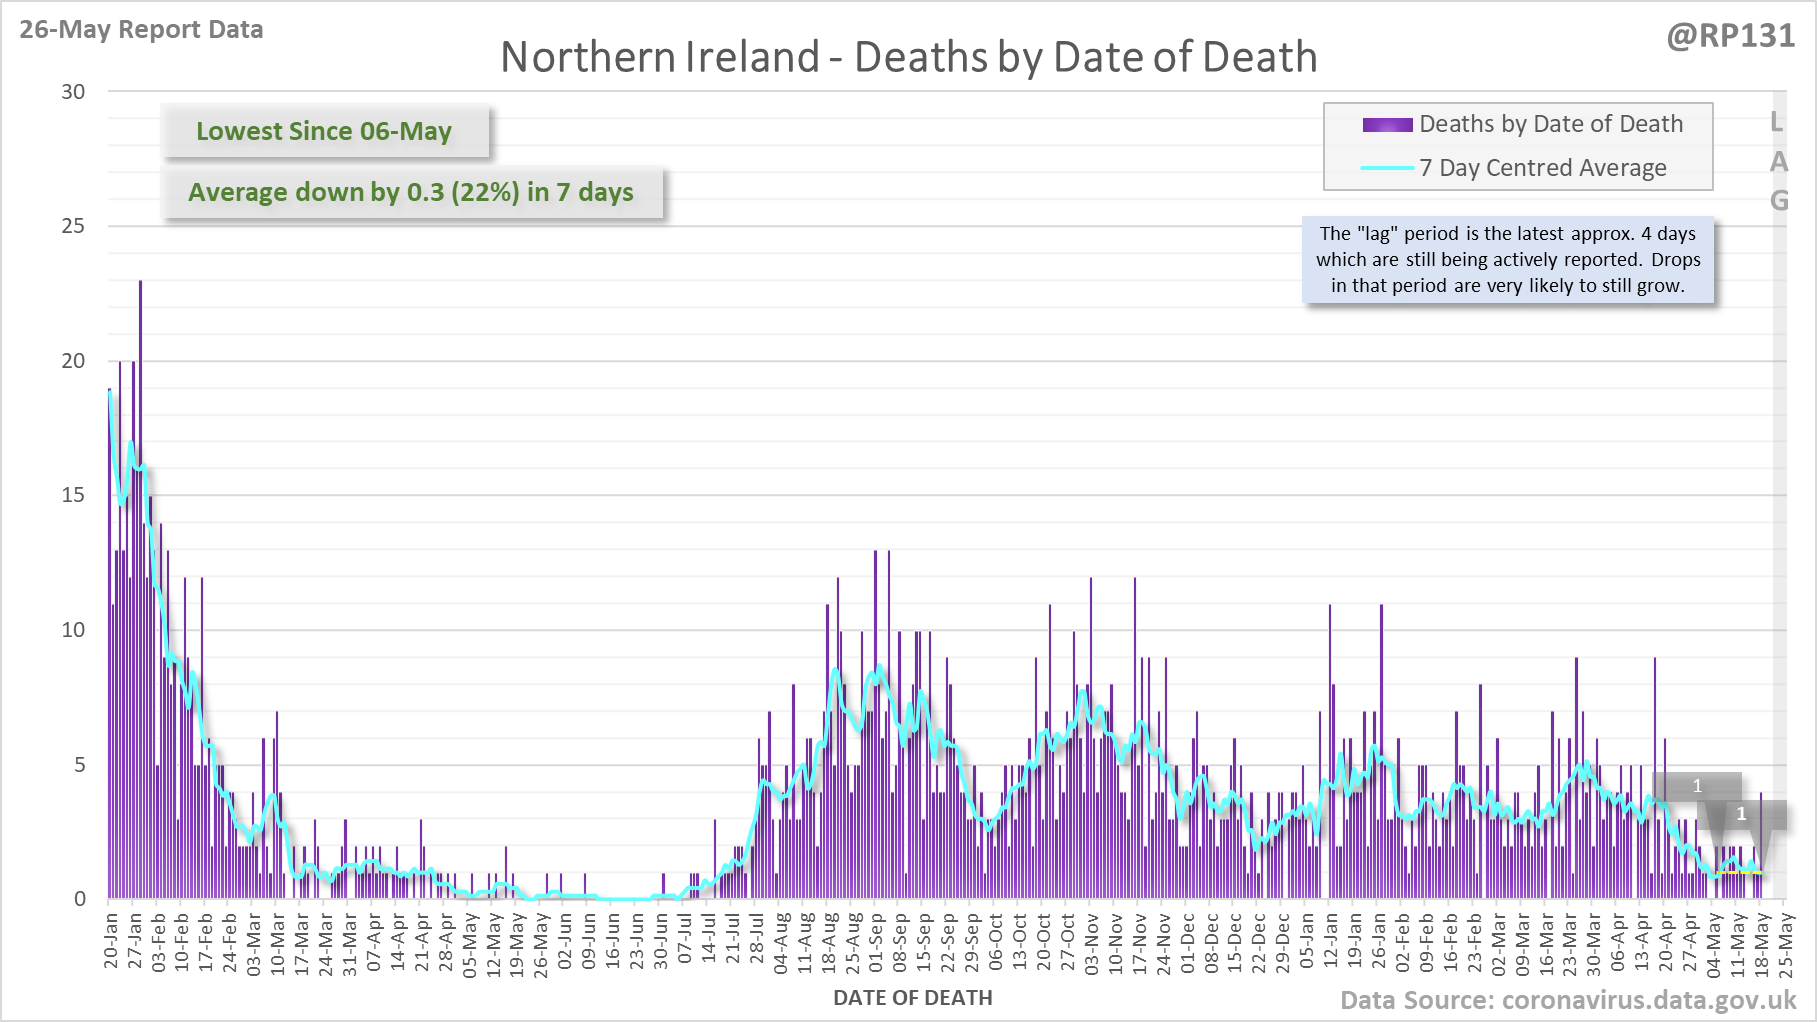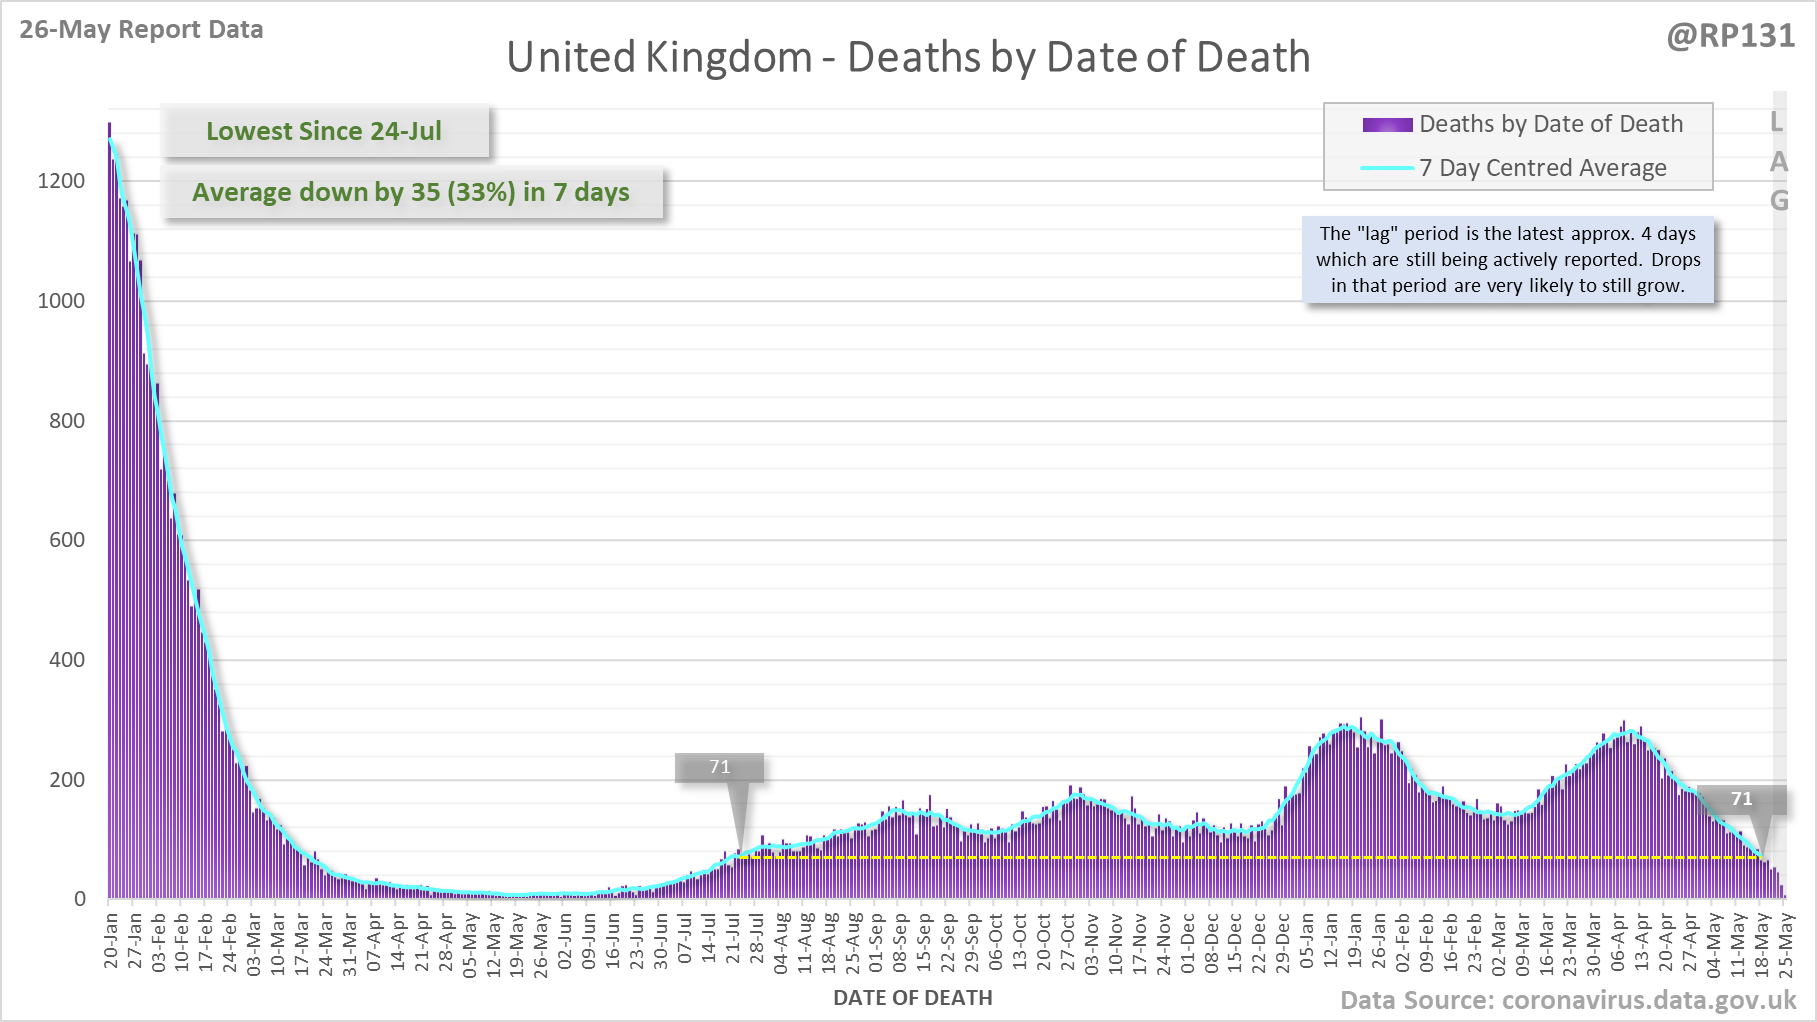
[1/8] 91 new #covid19uk deaths reported today (26-May). This brings the rolling average by date of death (allowing 4 days for lag) to 71, equivalent to around 24-Jul (i.e. 299 days ago), a reduction of 35 (33%) in the last week.
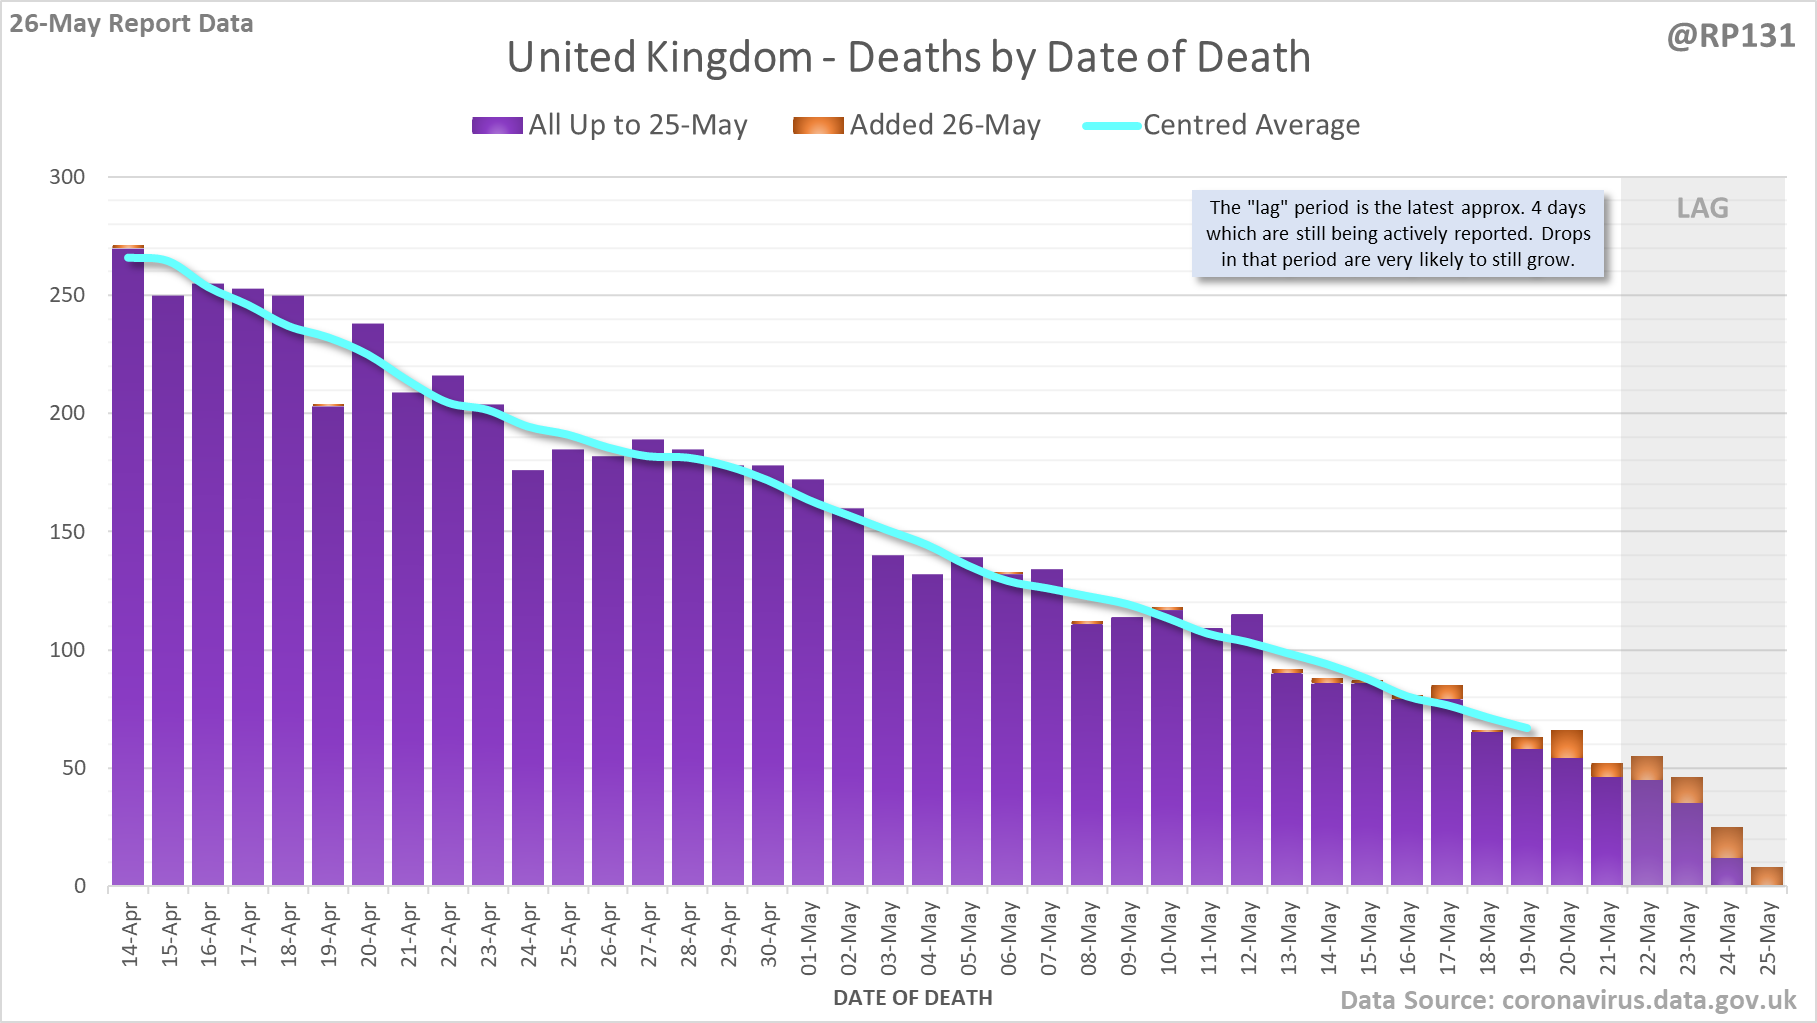
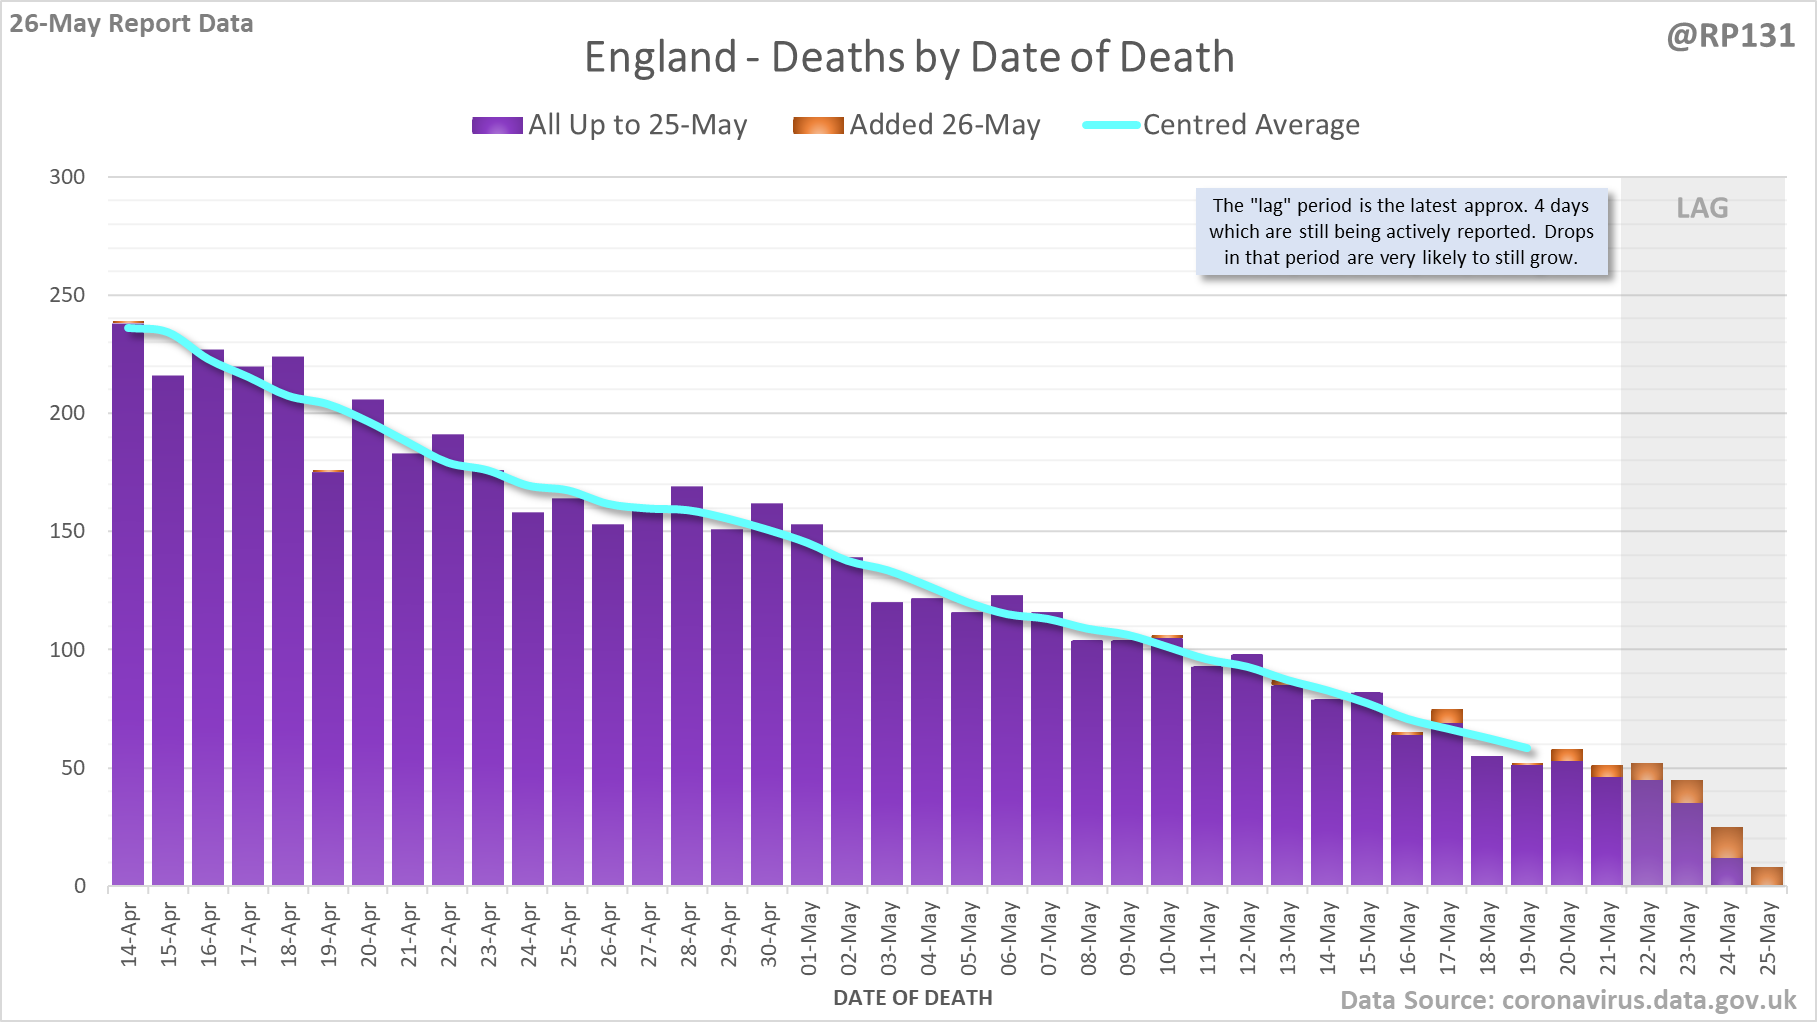
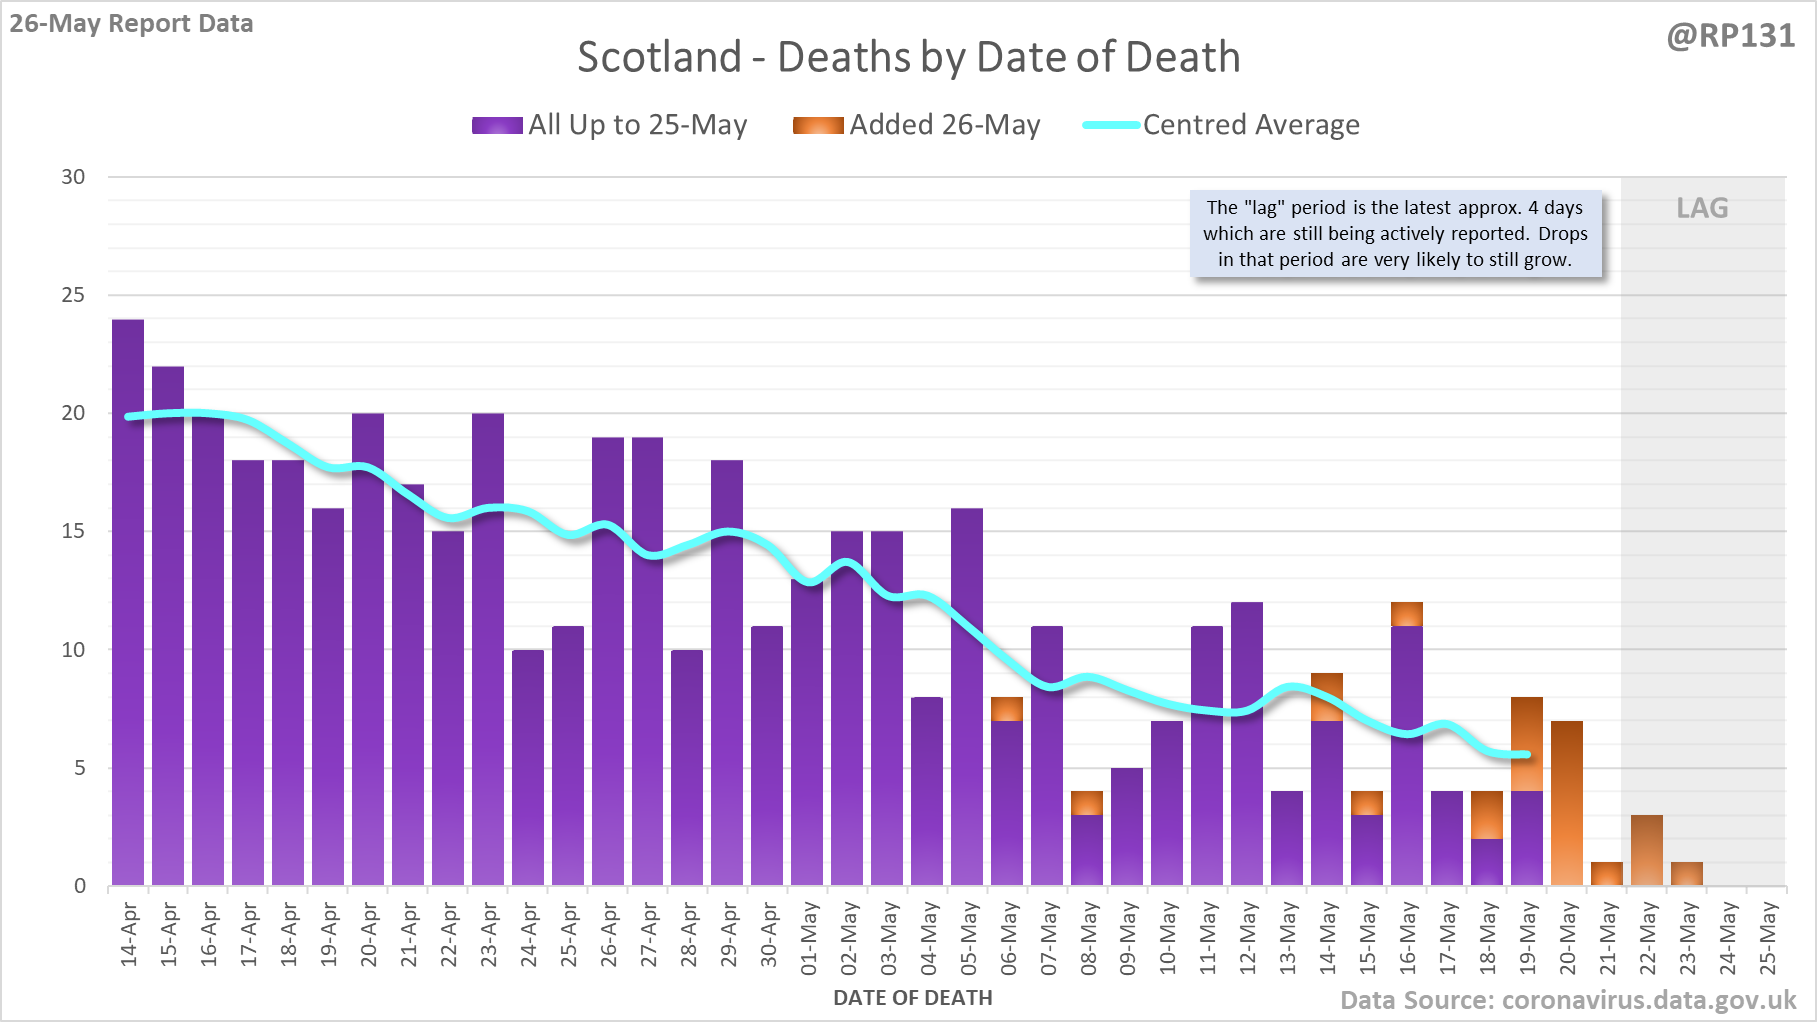
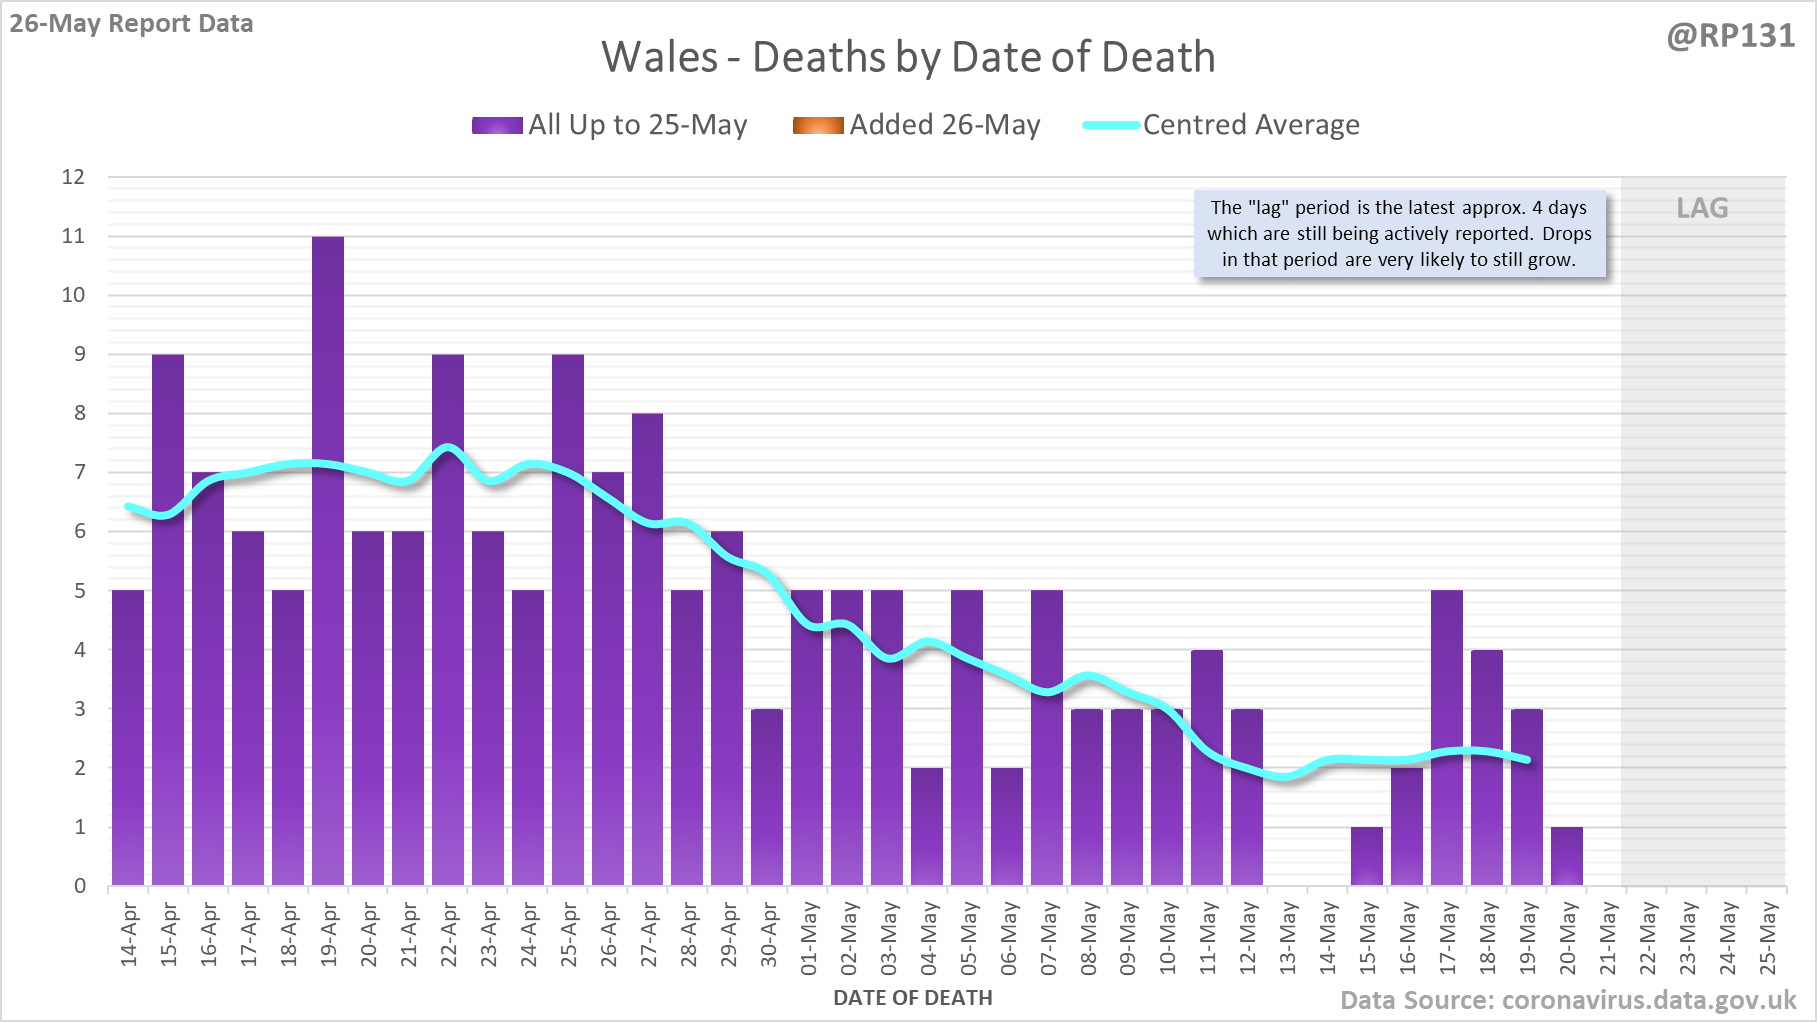
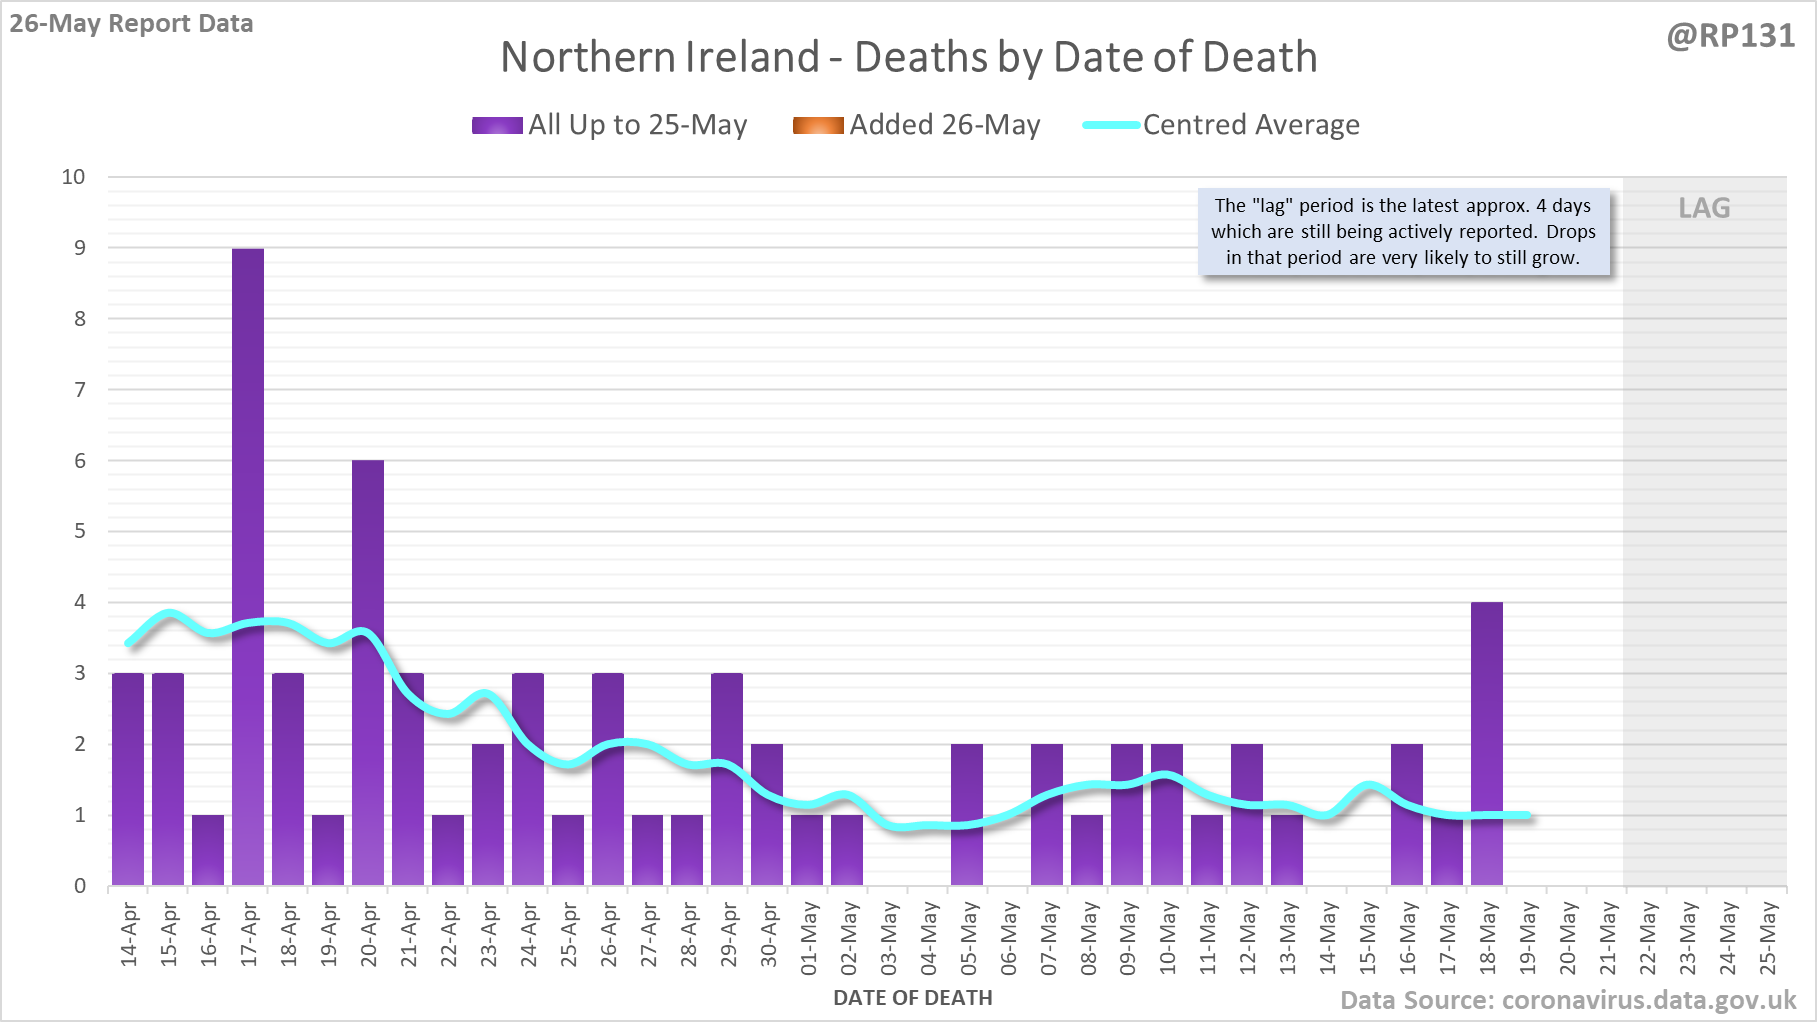
[2/8] Closer look at the latest 45 days, with today's added numbers highlighted in orange. Individual nations and animated England charts further down the thread.
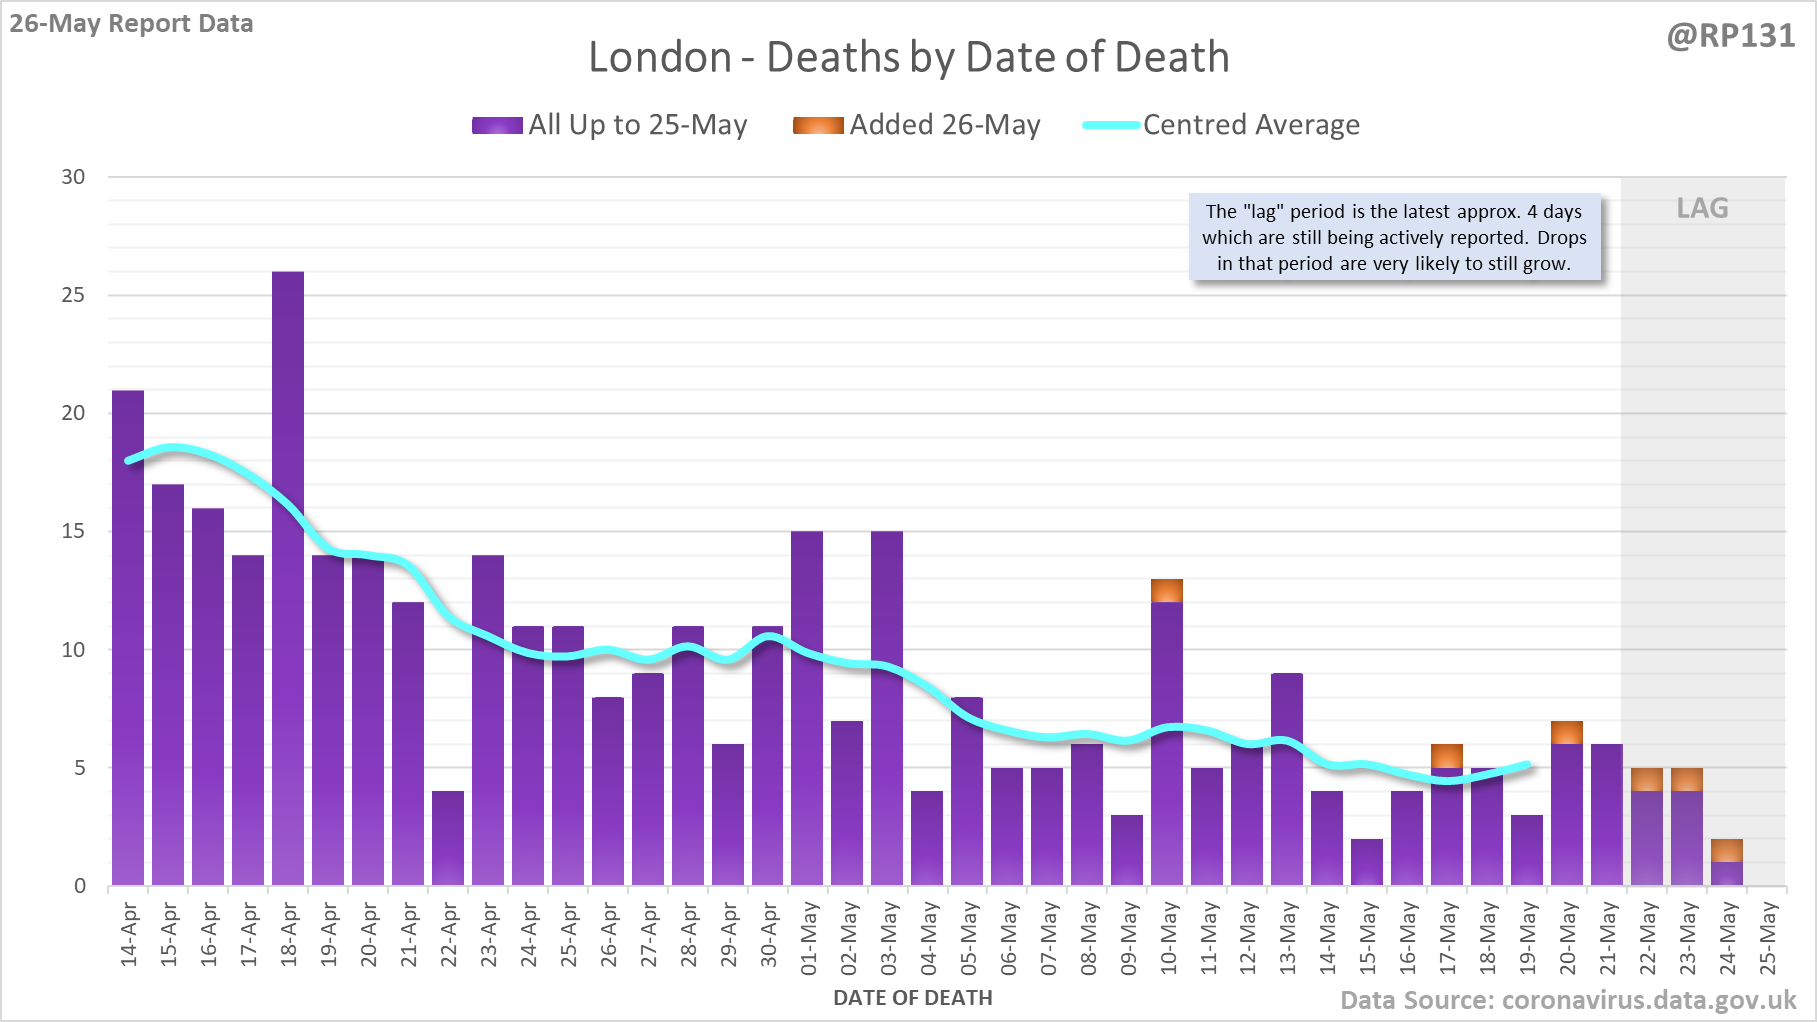
[4/8] Separate charts for England (60) Scotland (25) Wales (6) and Northern Ireland (0). Note the different scales. Also on certain days the date-of-death data for Scotland/Wales/NI doesn't get updated so the orange bars may be mising or include multiple day's numbers.
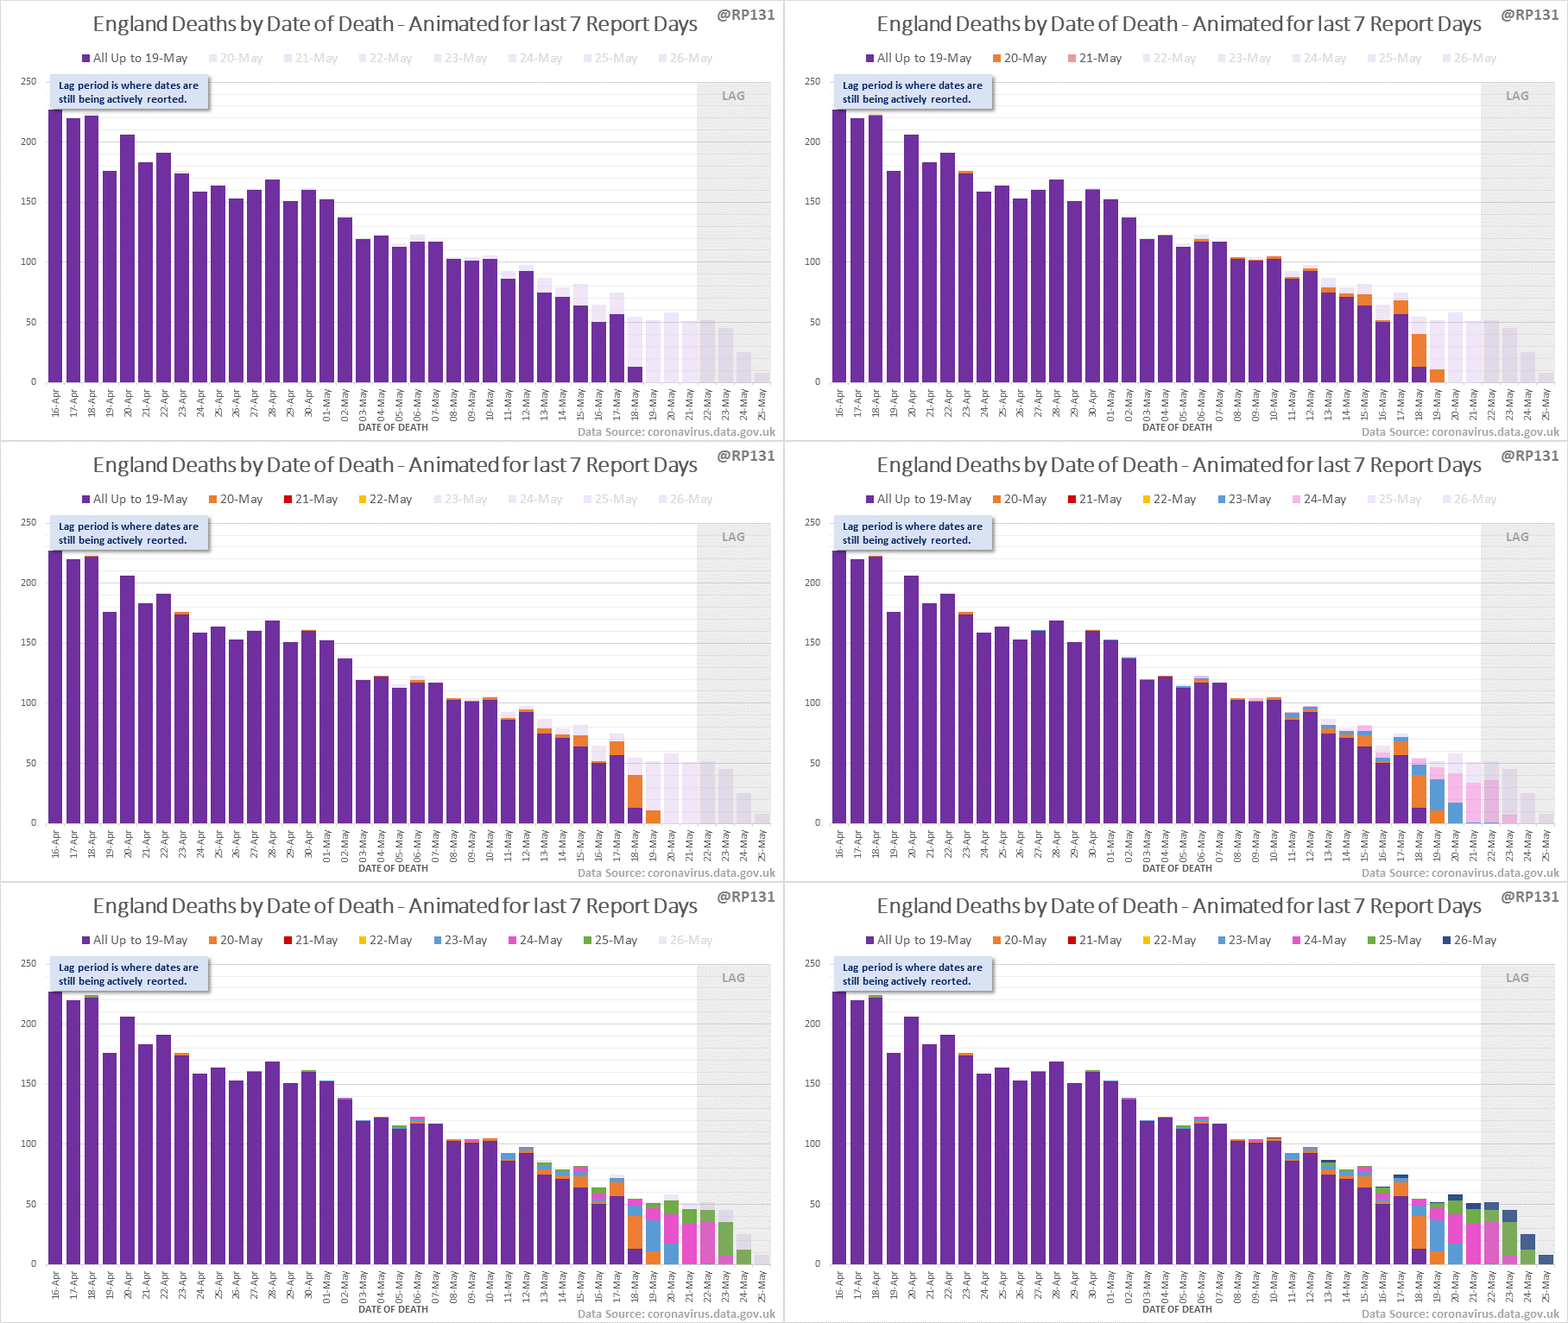
[5/8] Animated chart to show how the #covid19uk deaths by date of death have been contributed to by reports over the last 7 days. Note this just includes England numbers as other nations don't always publish their date-of-death data every day.
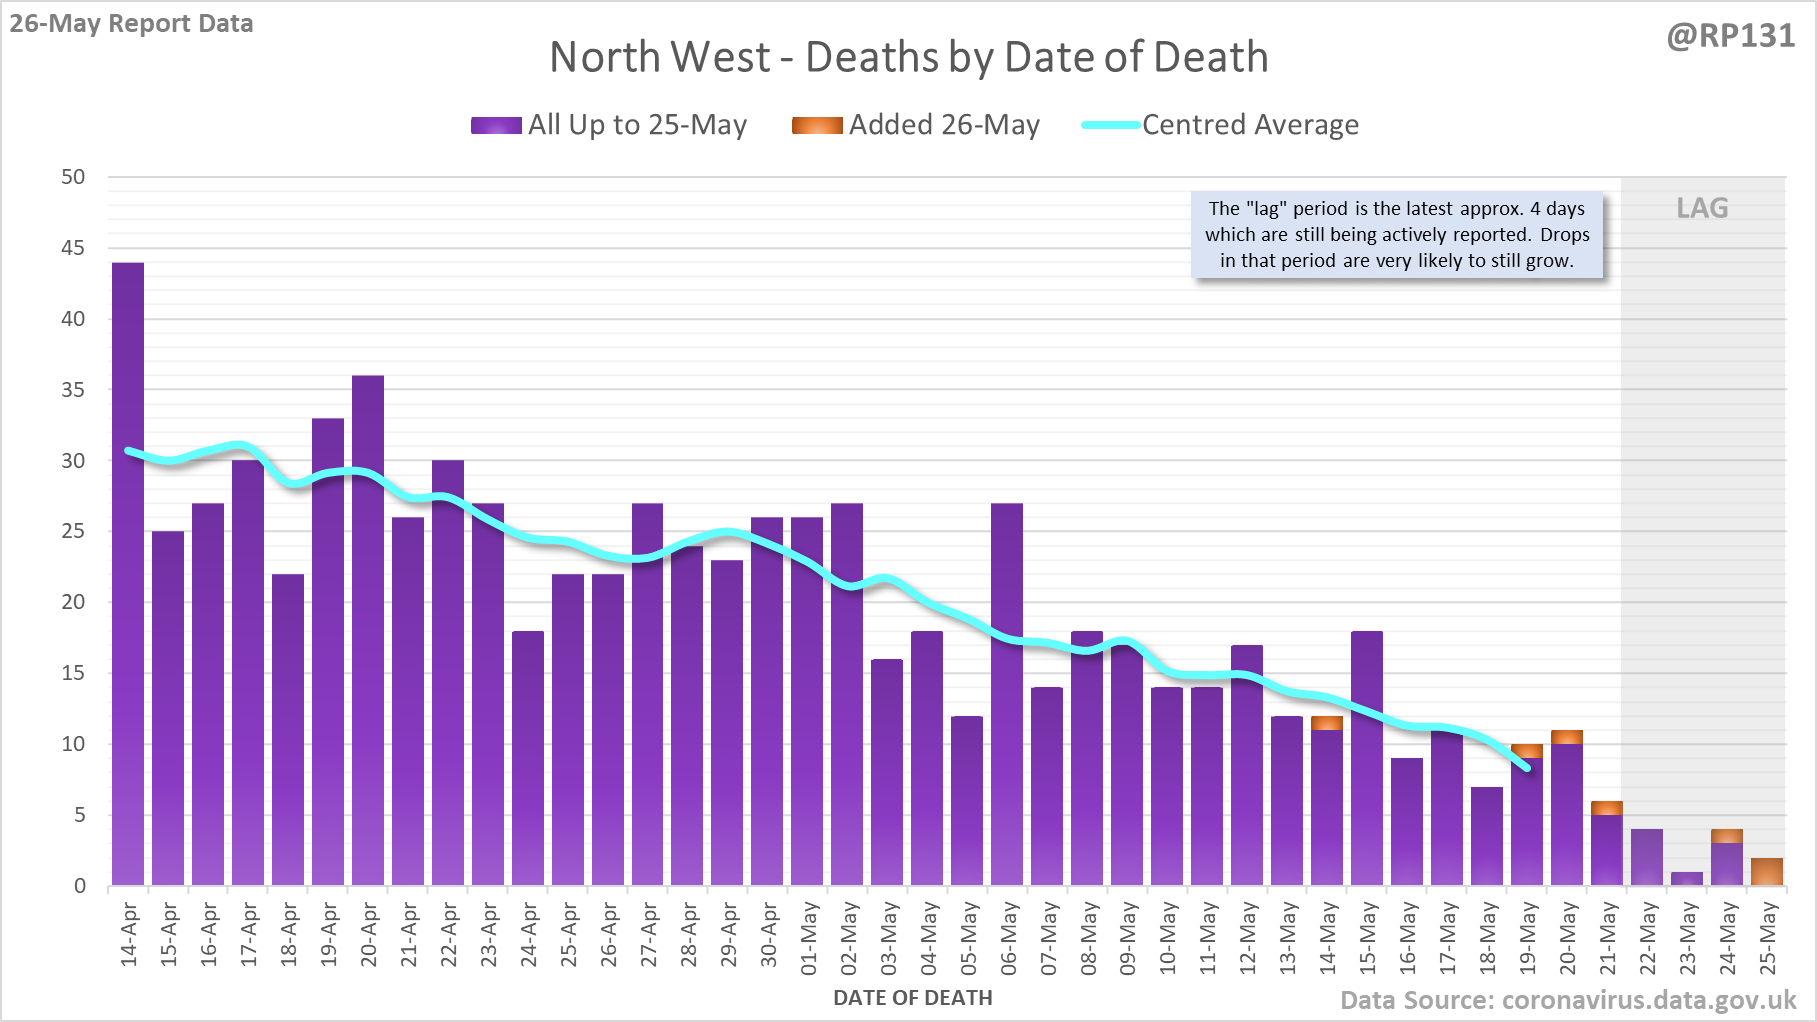
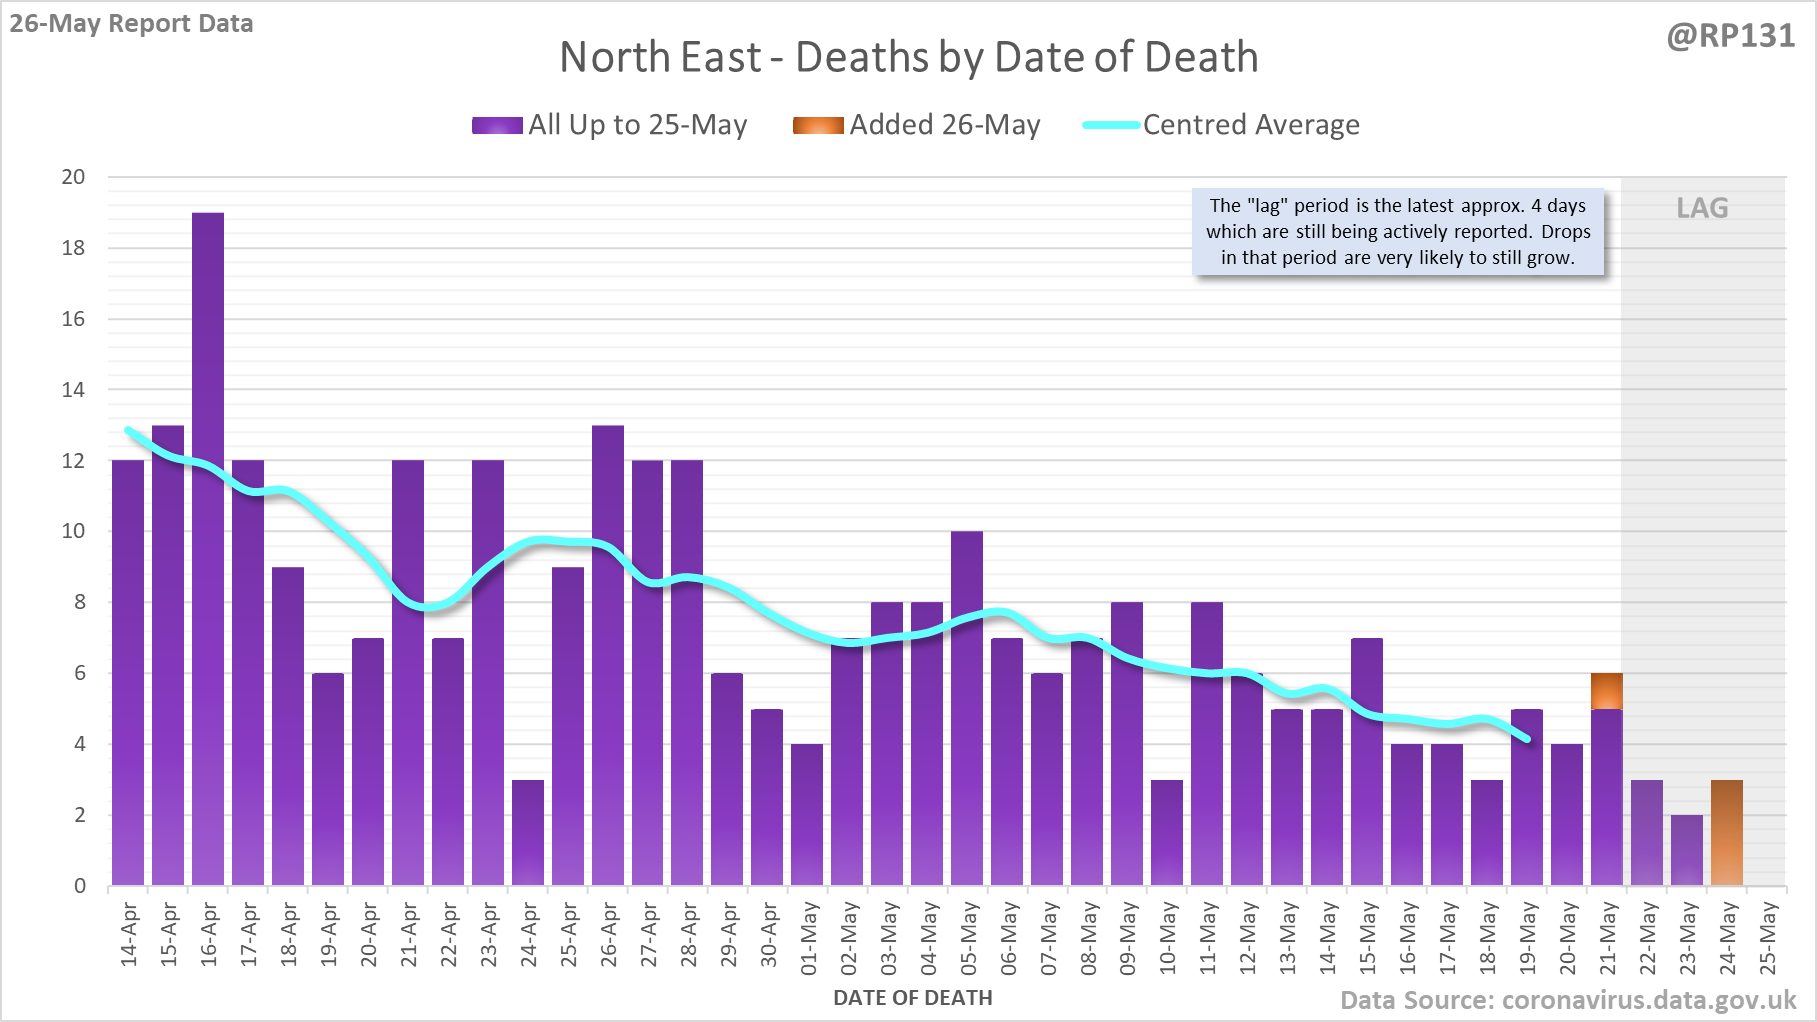
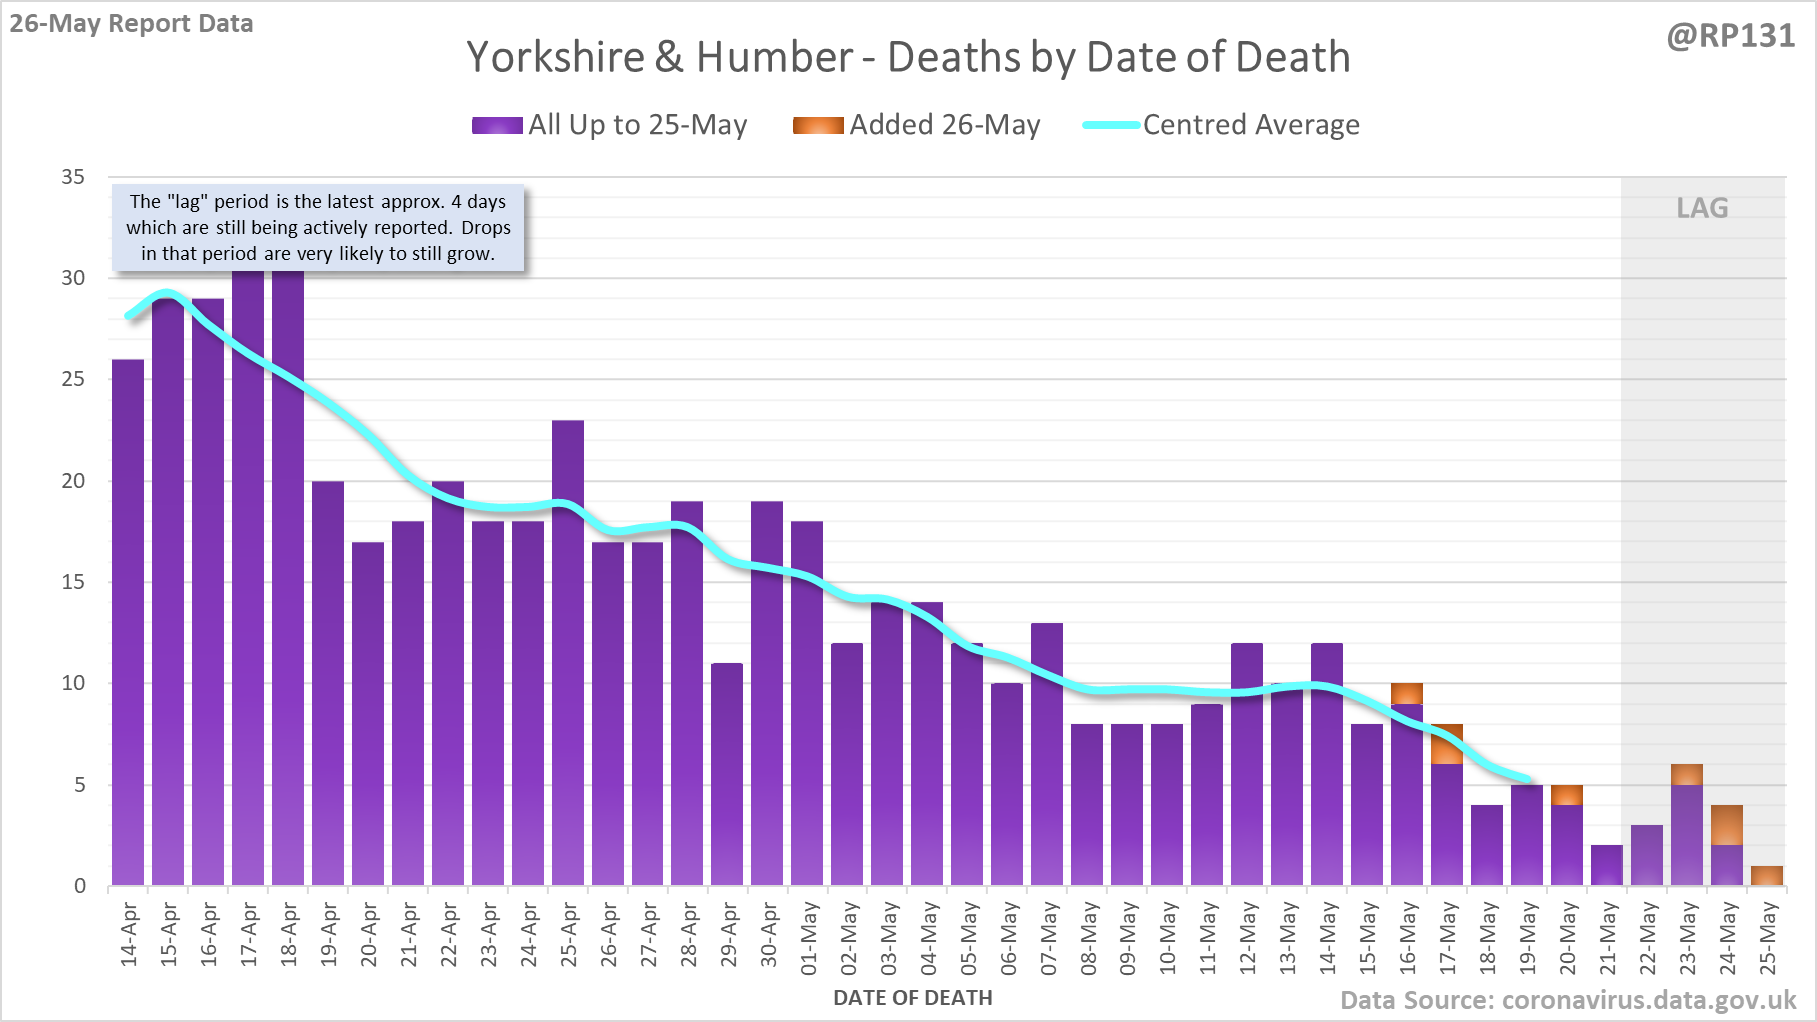
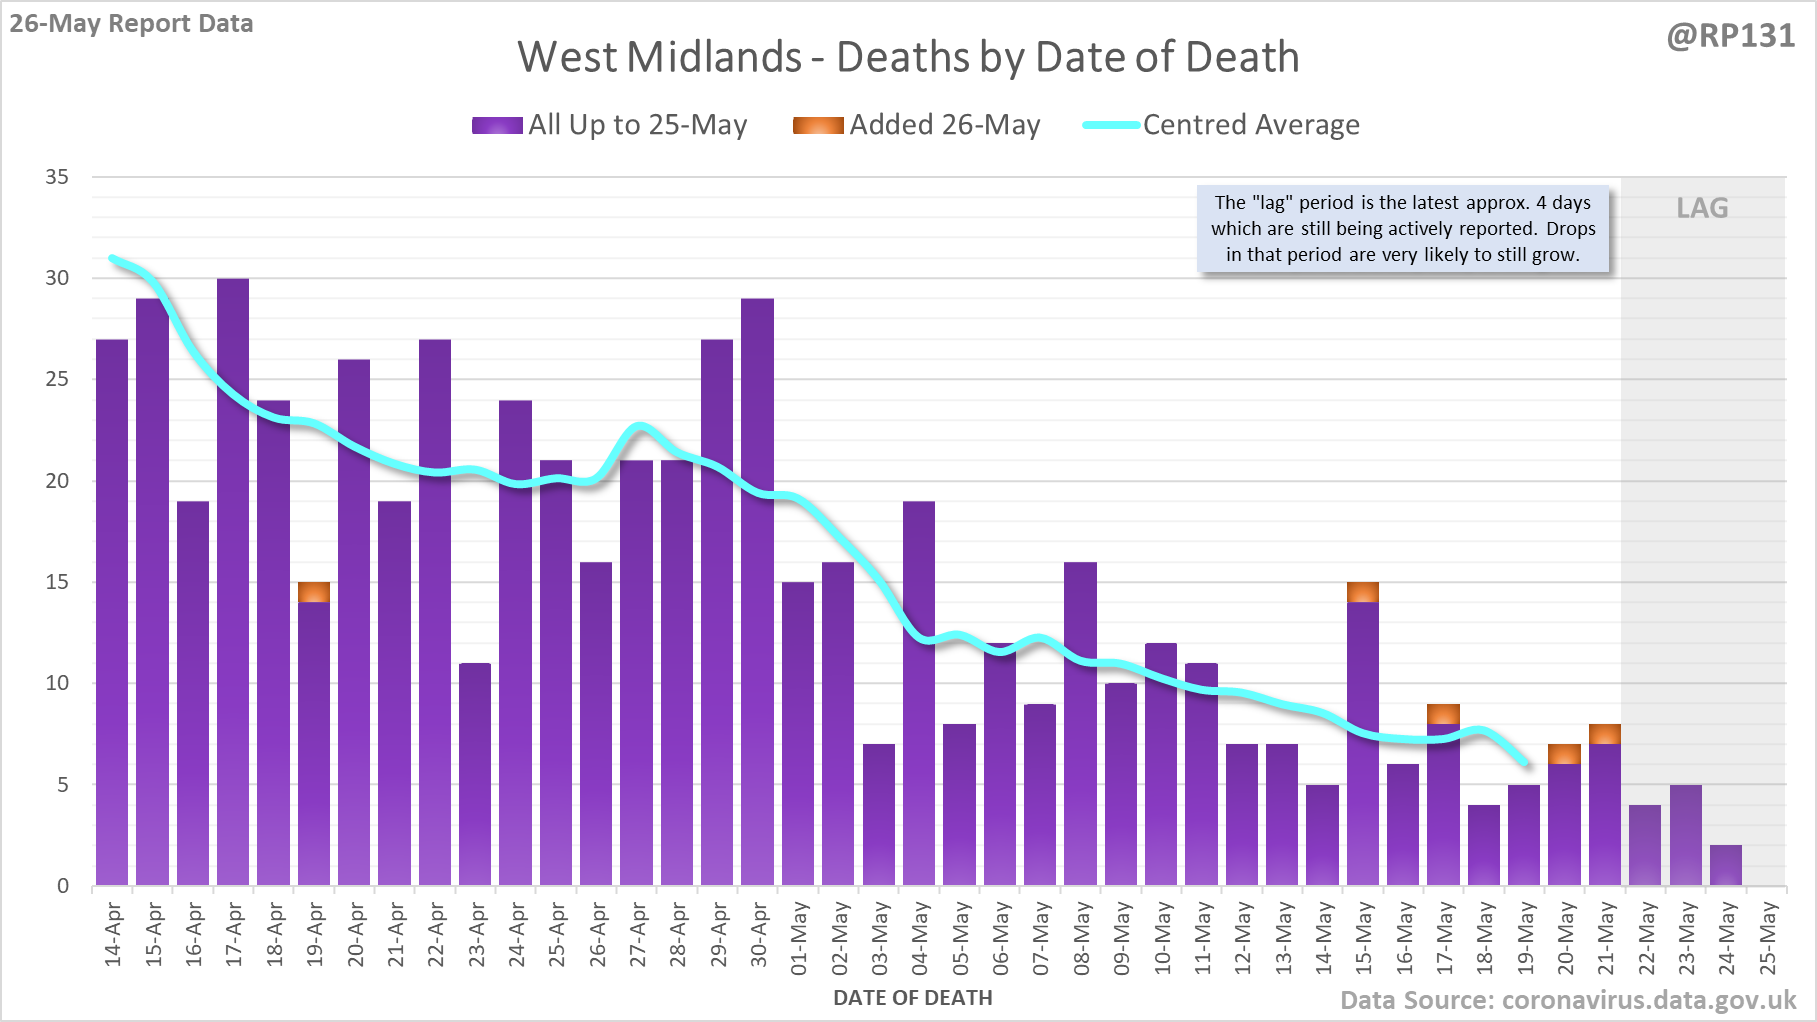
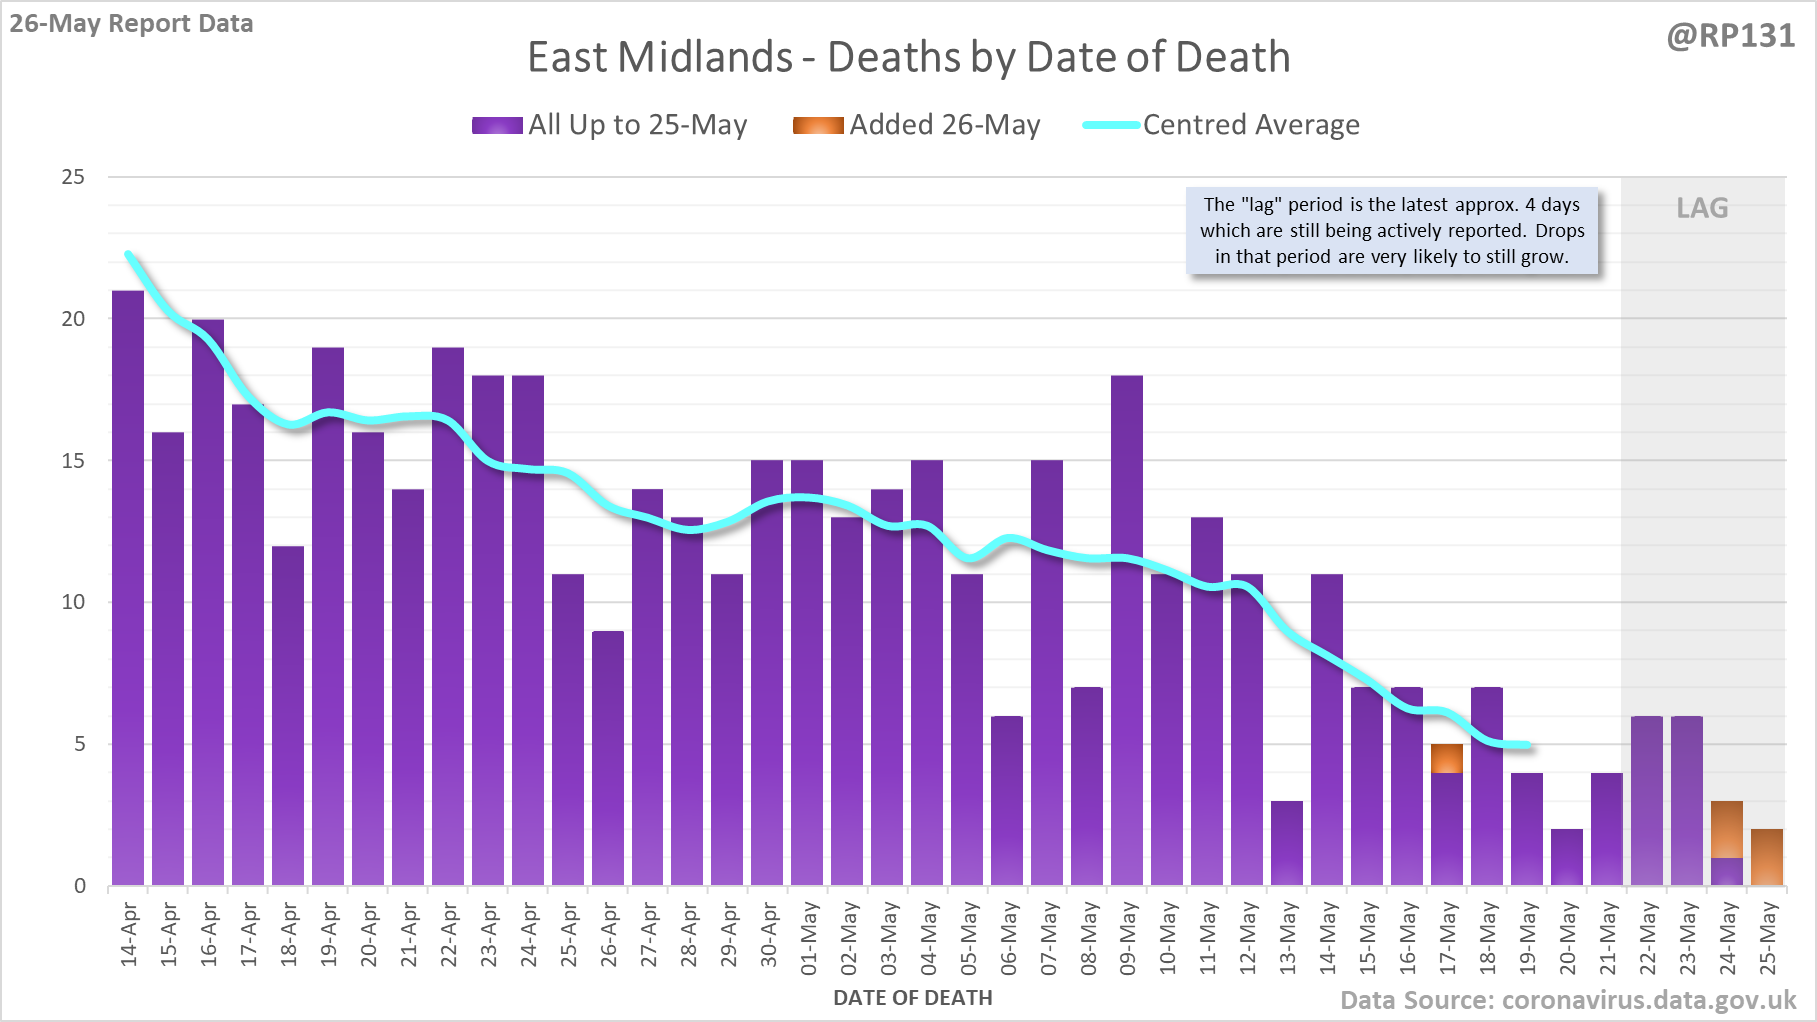
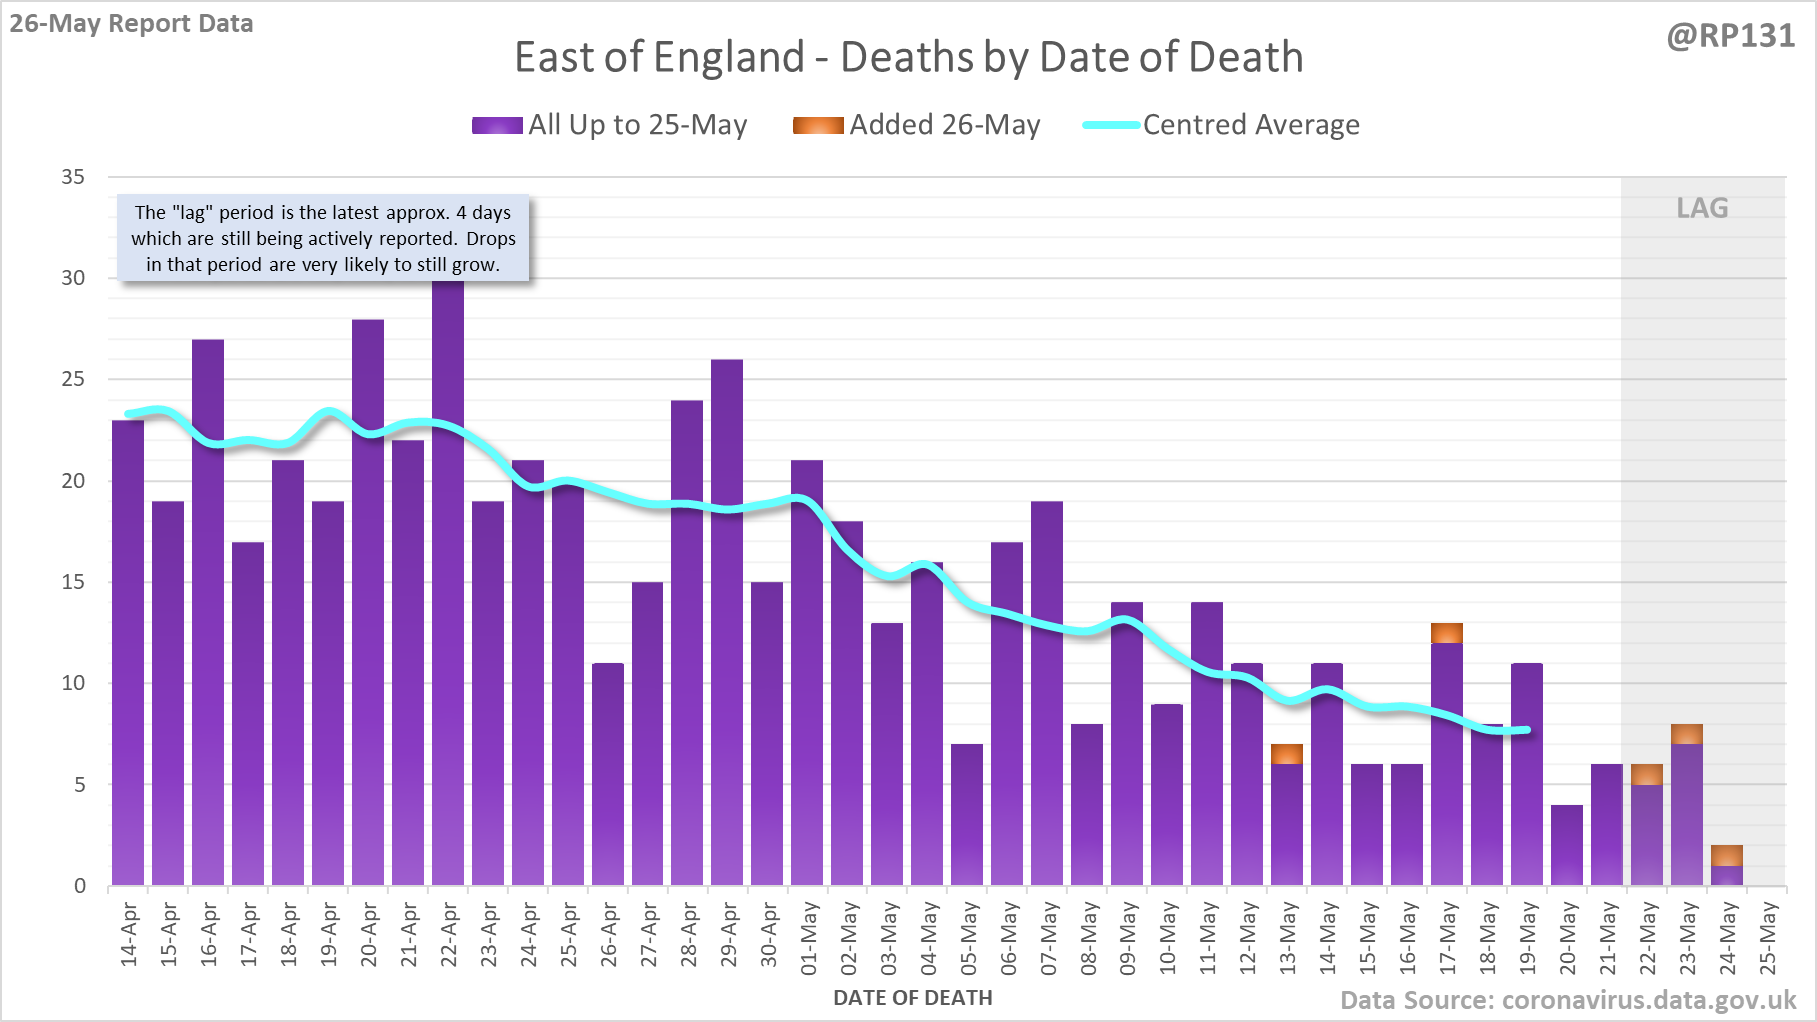
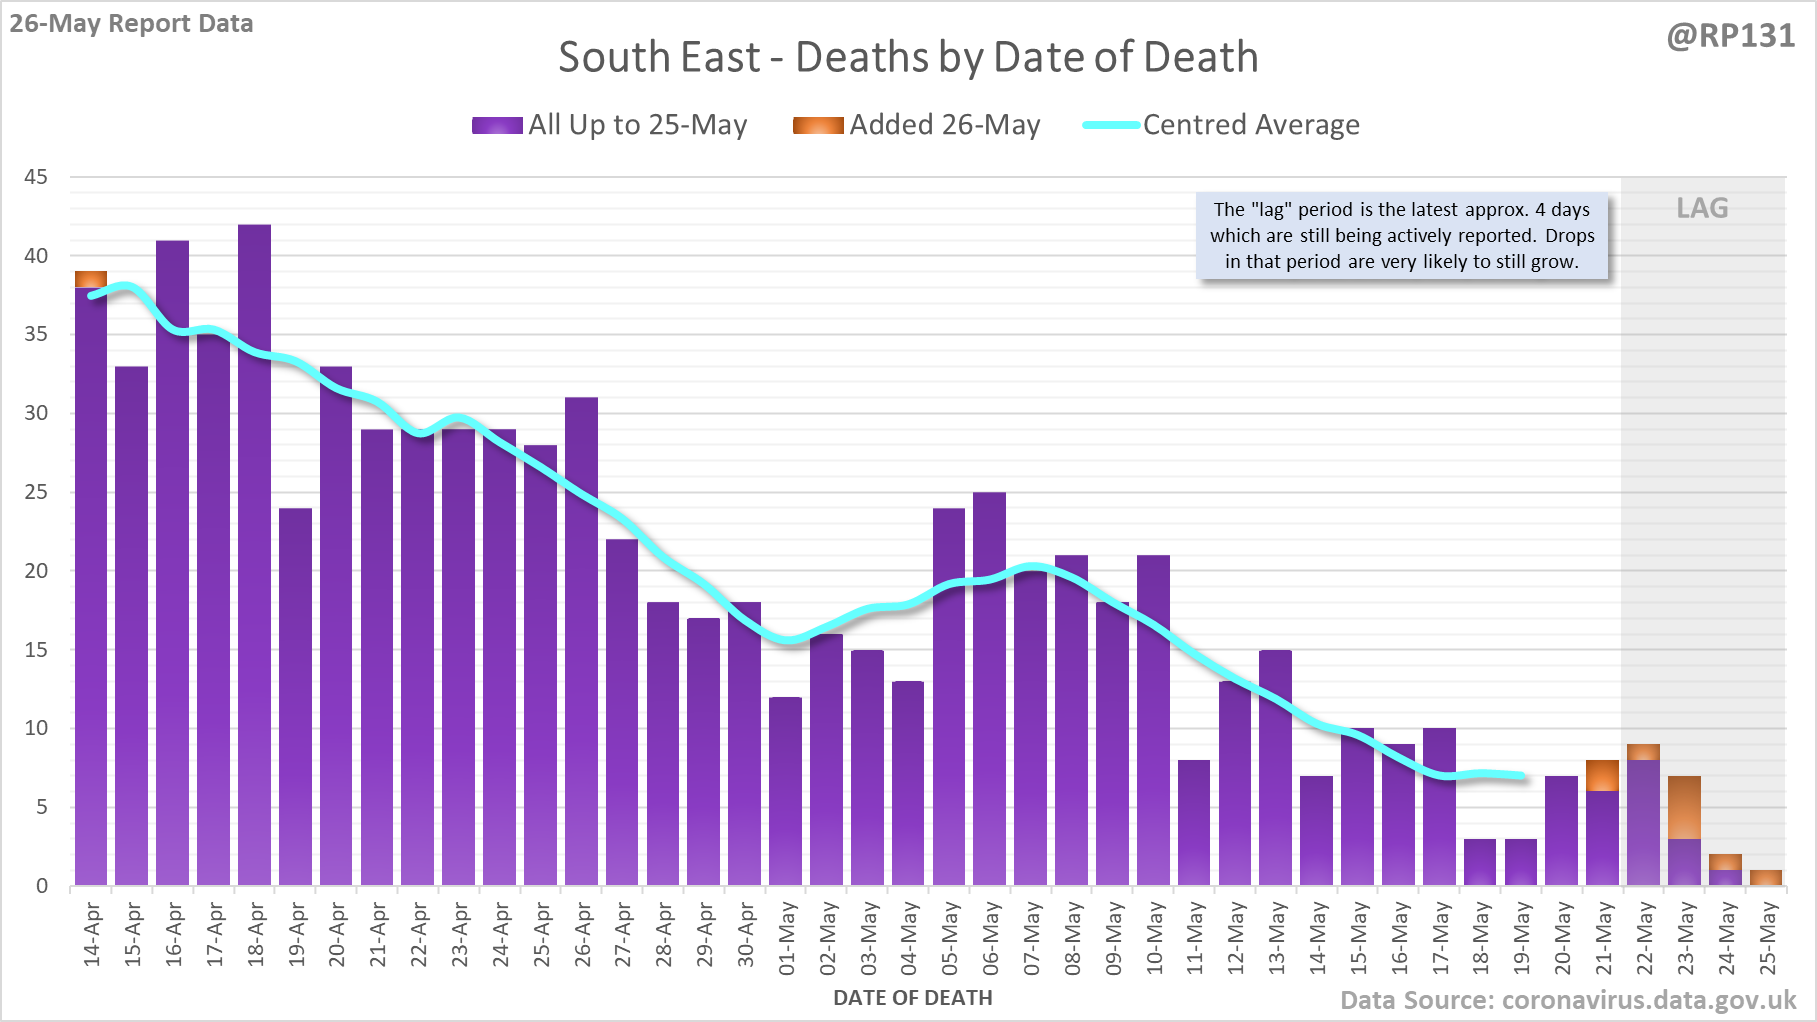
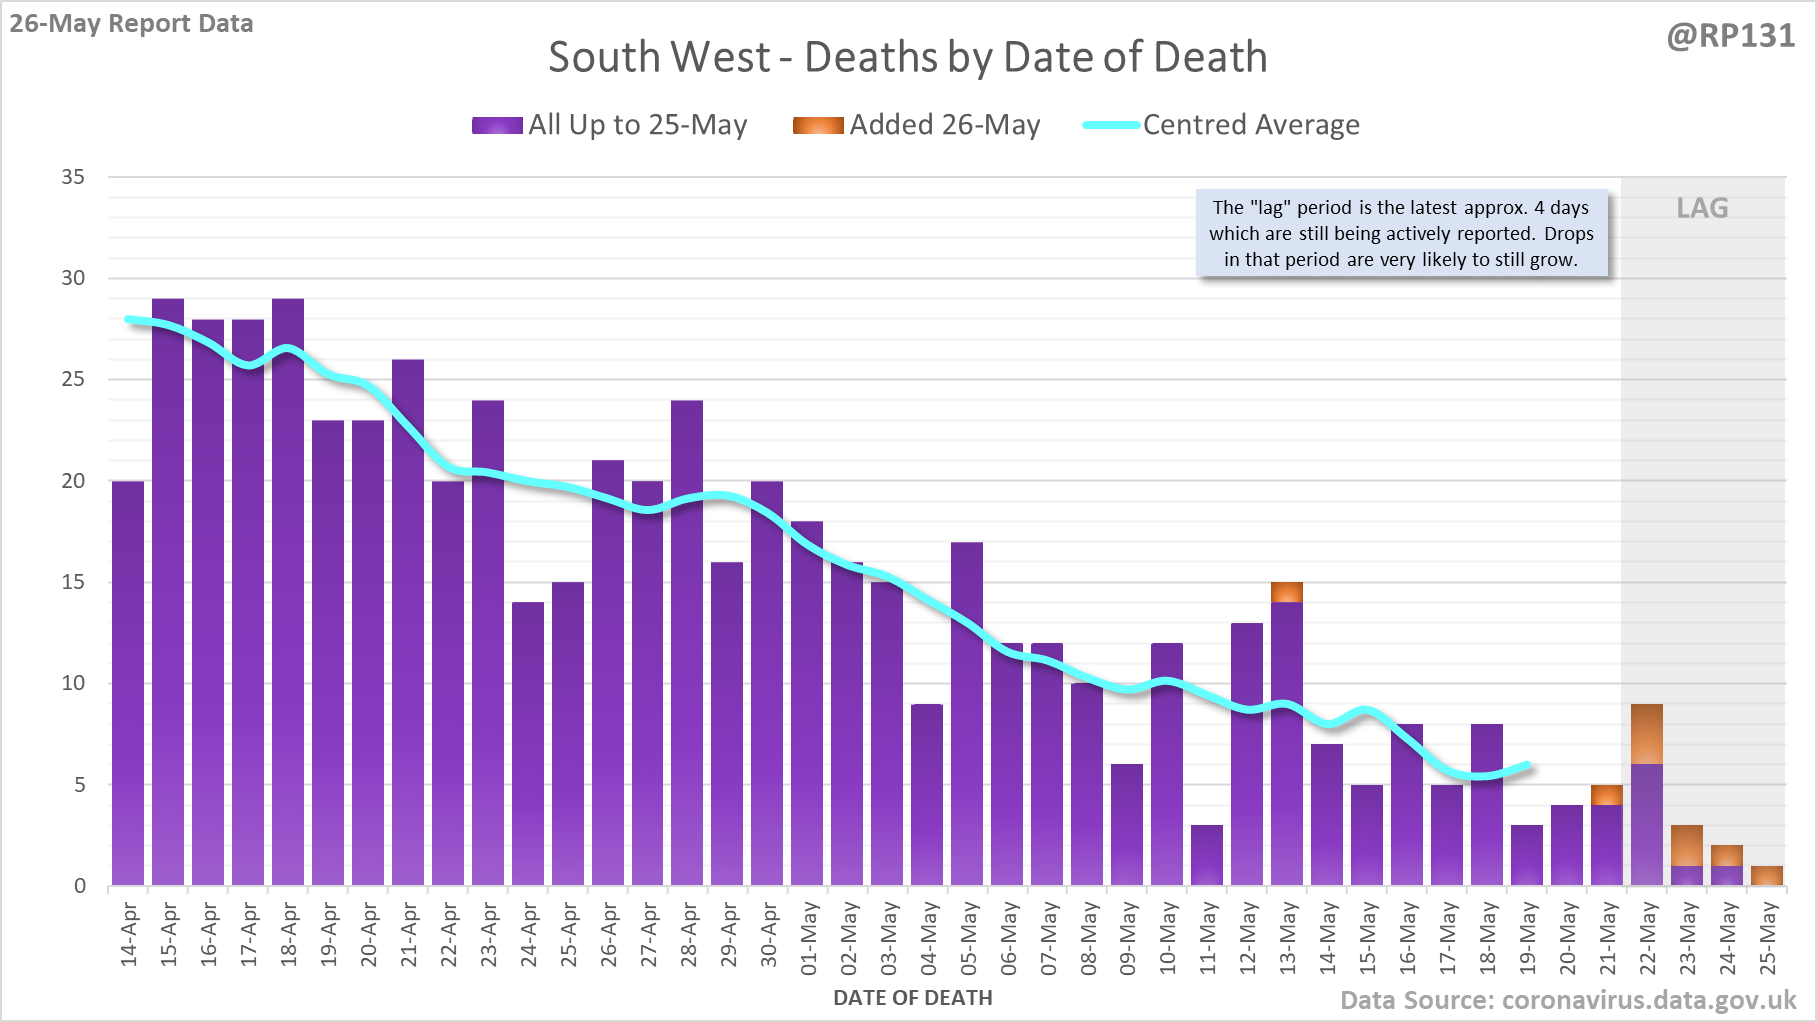
[6/8] And England regions, starting with North West, North East, Yorkshire & Humber and West Midlands. Again, note the different scales.
[7/8] Plus East Midlands, East of England, South East and South West. Again, note the different scales.
