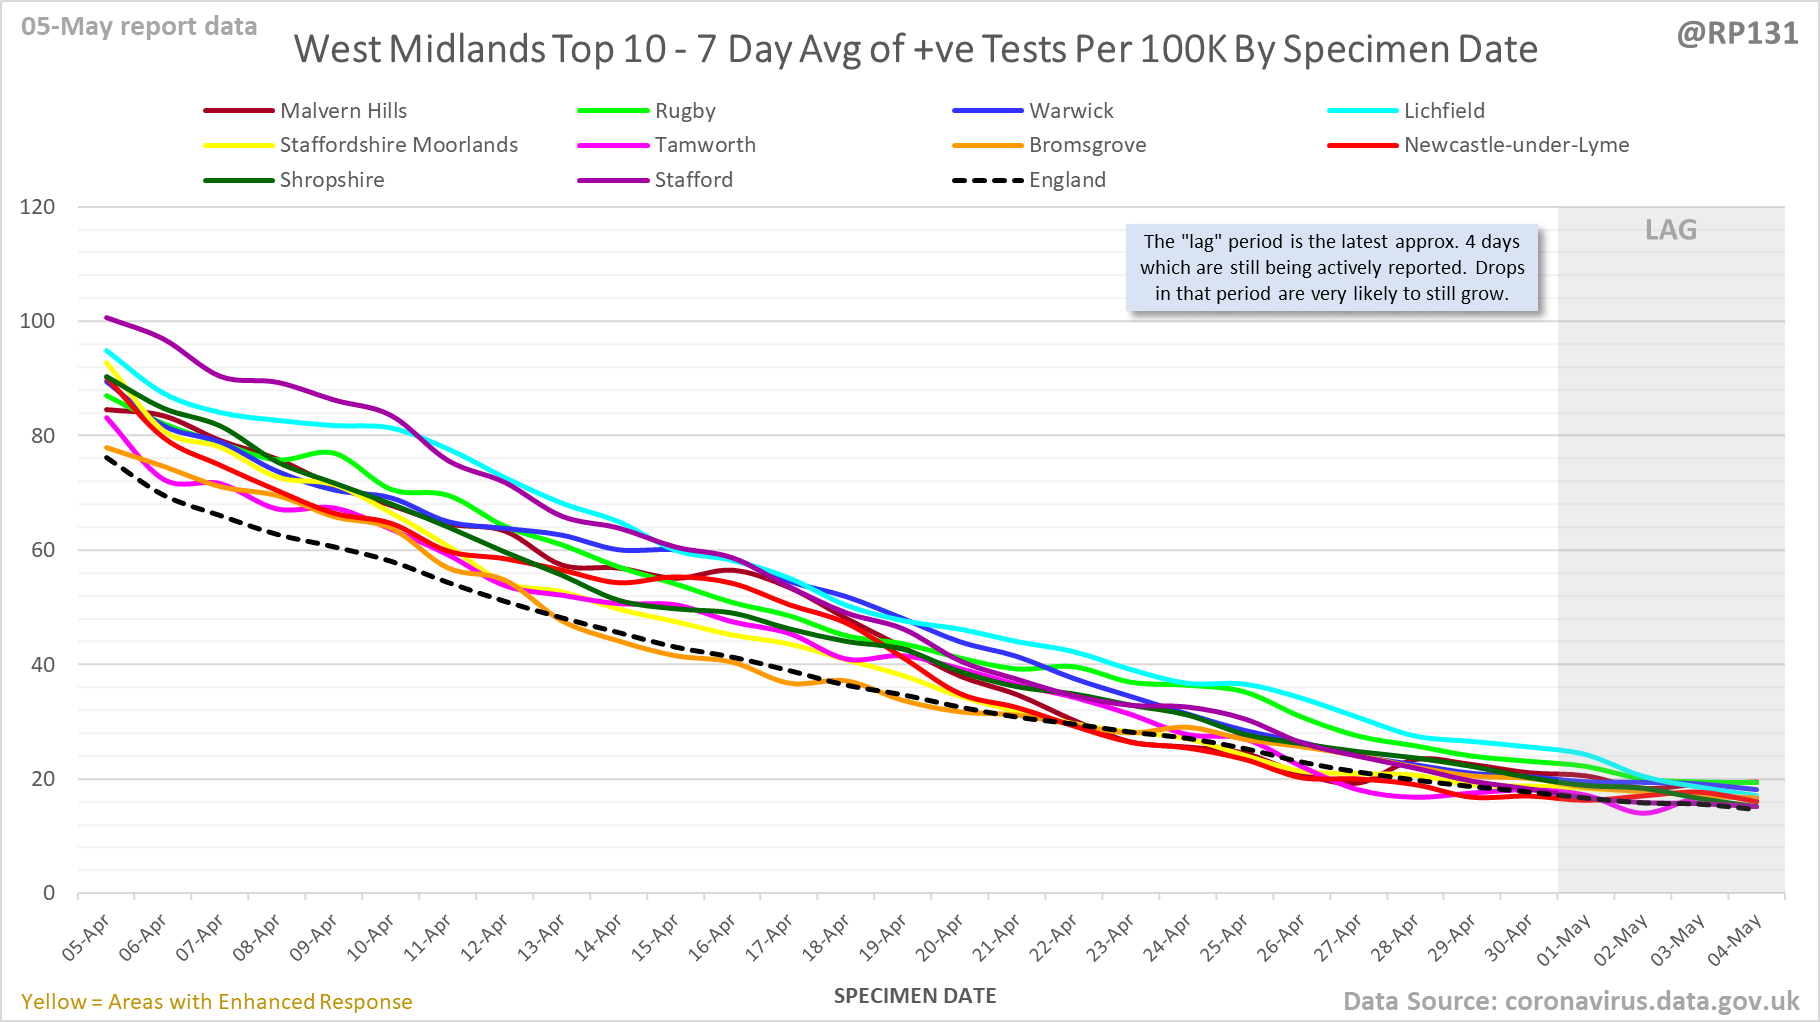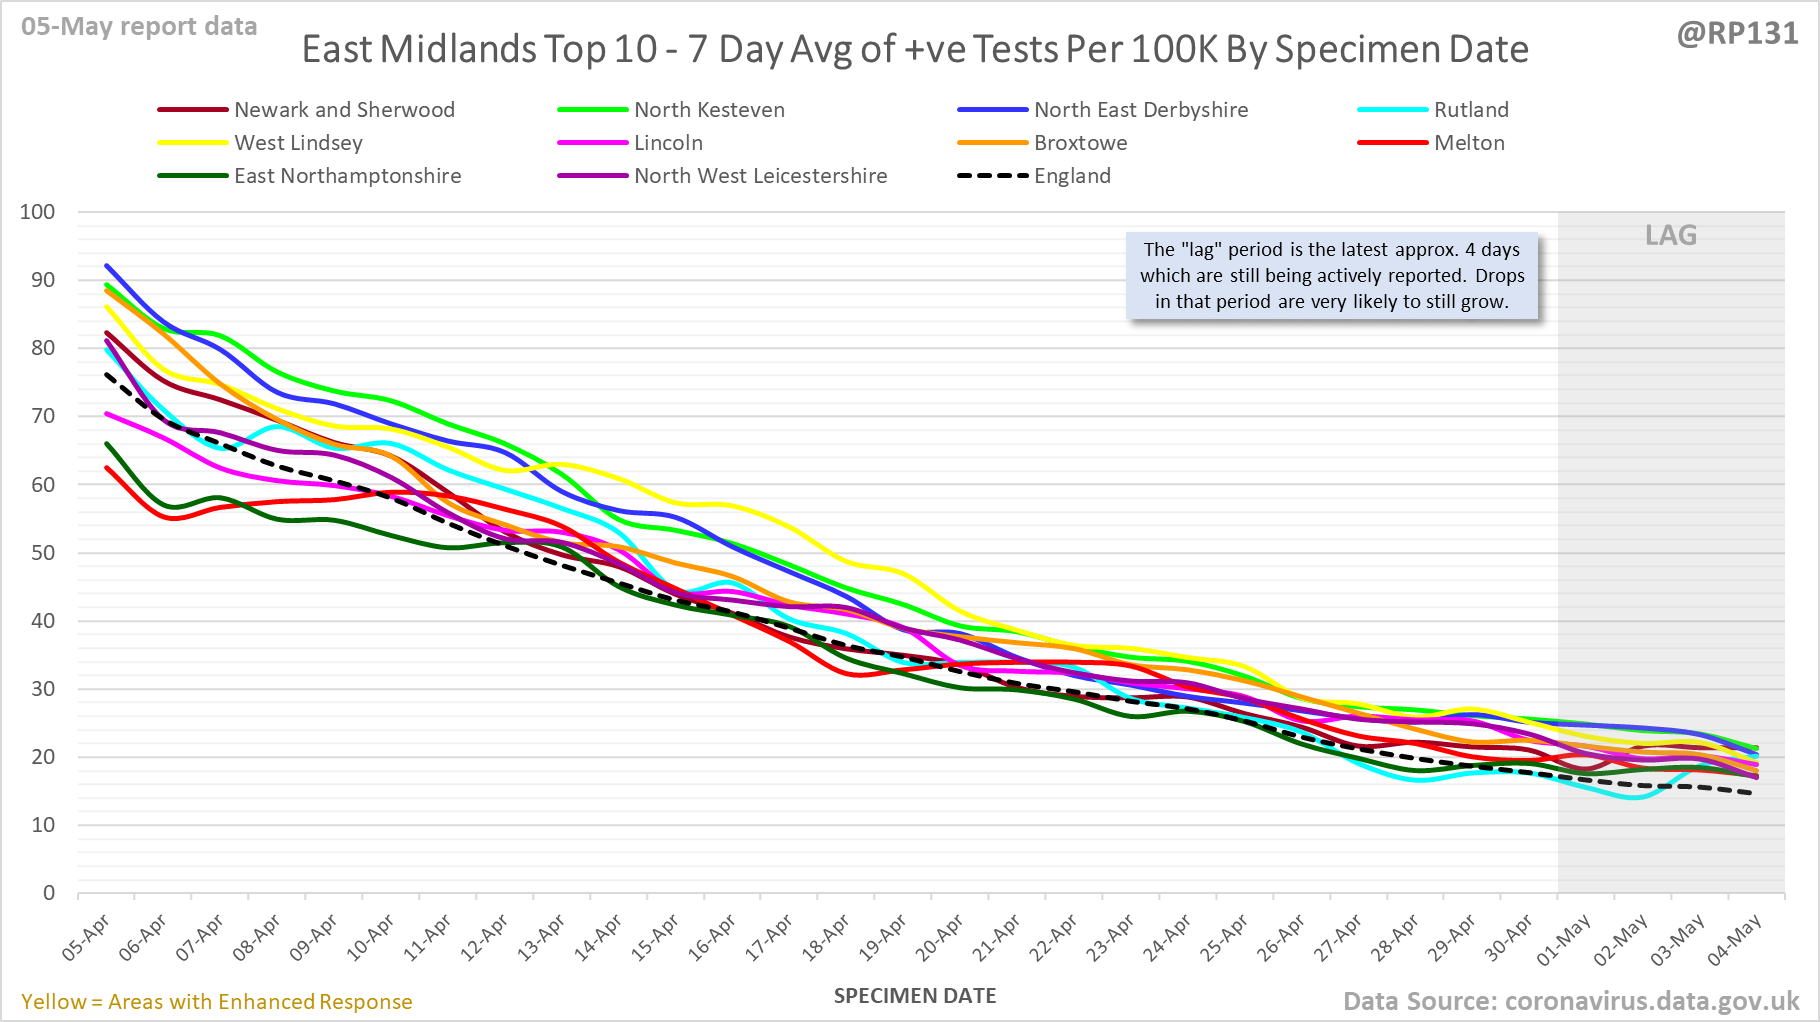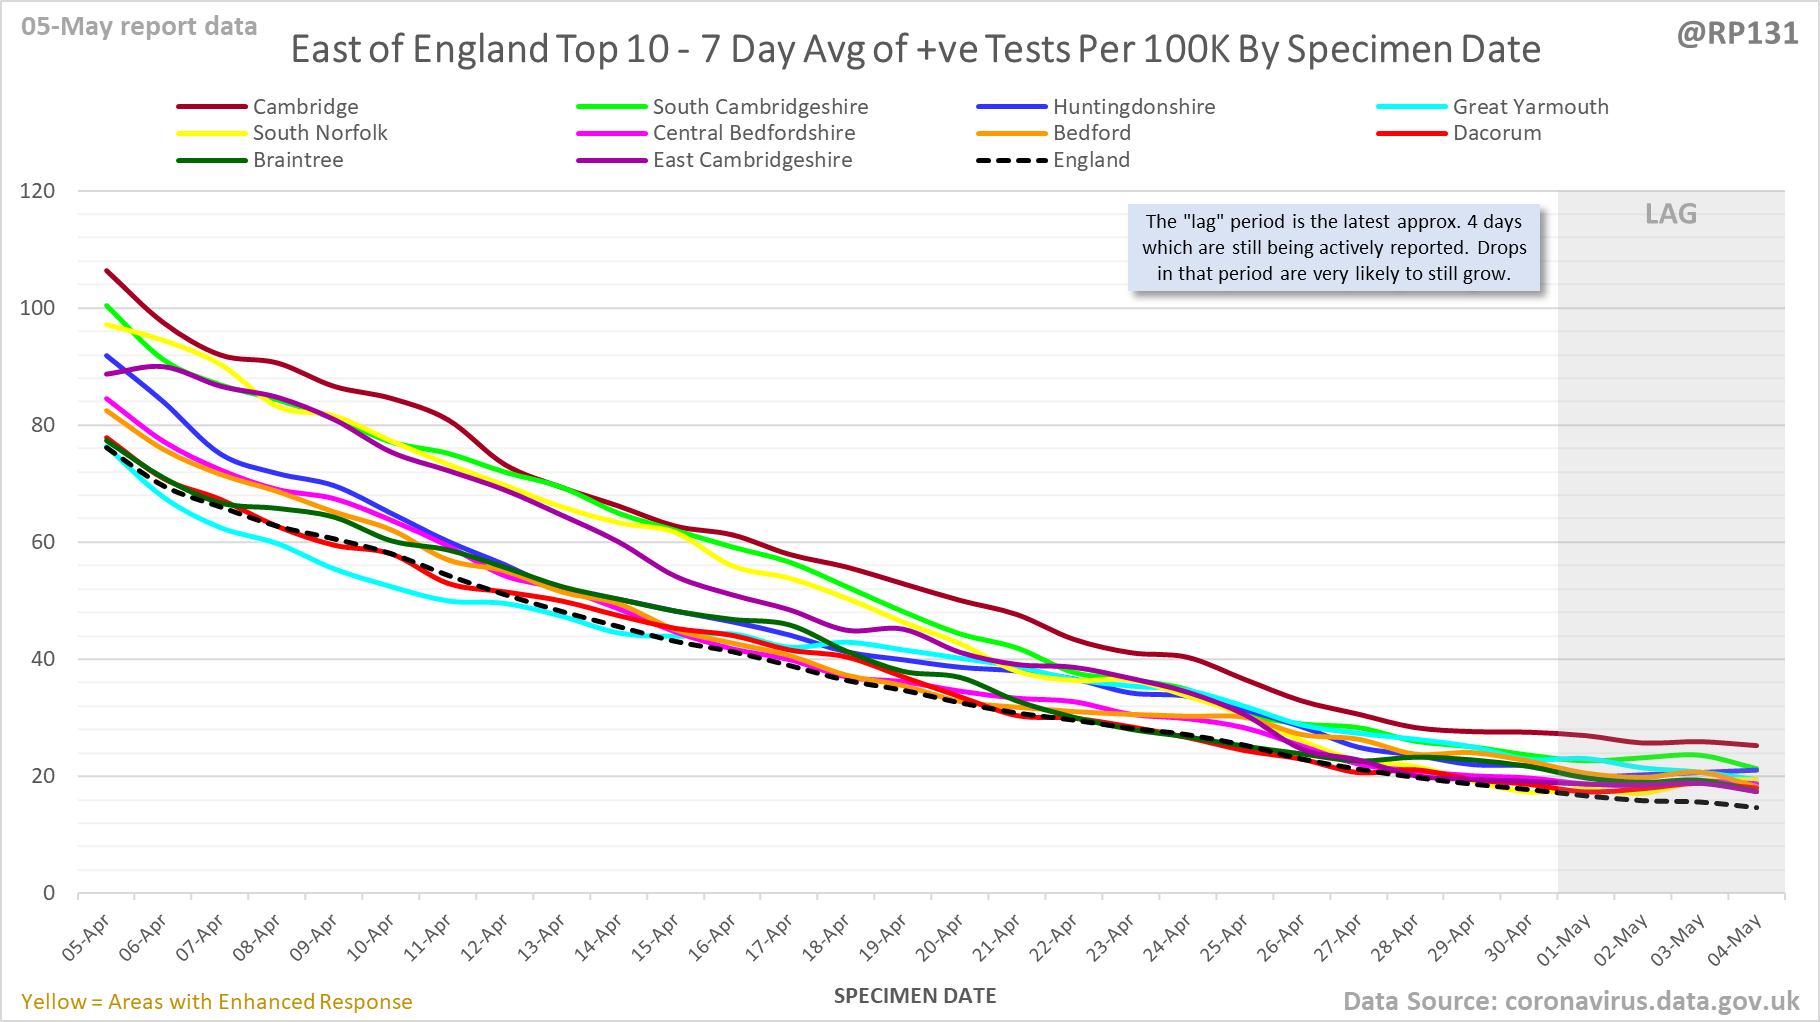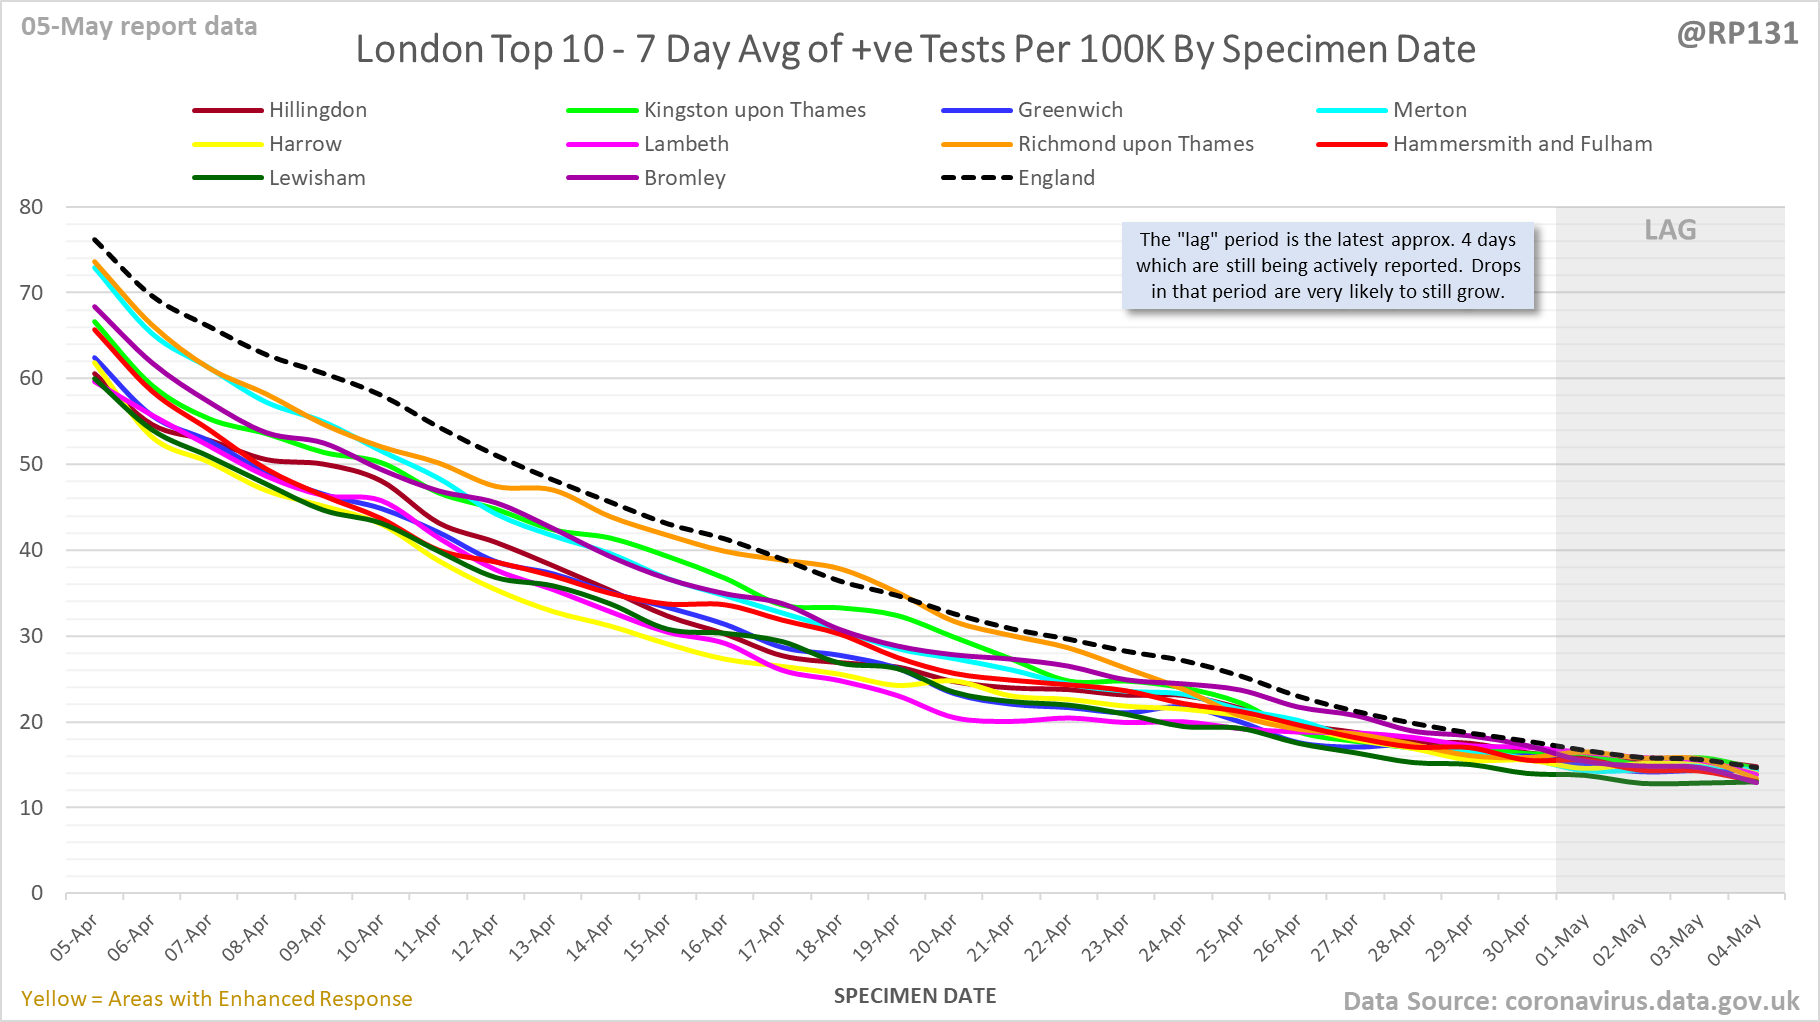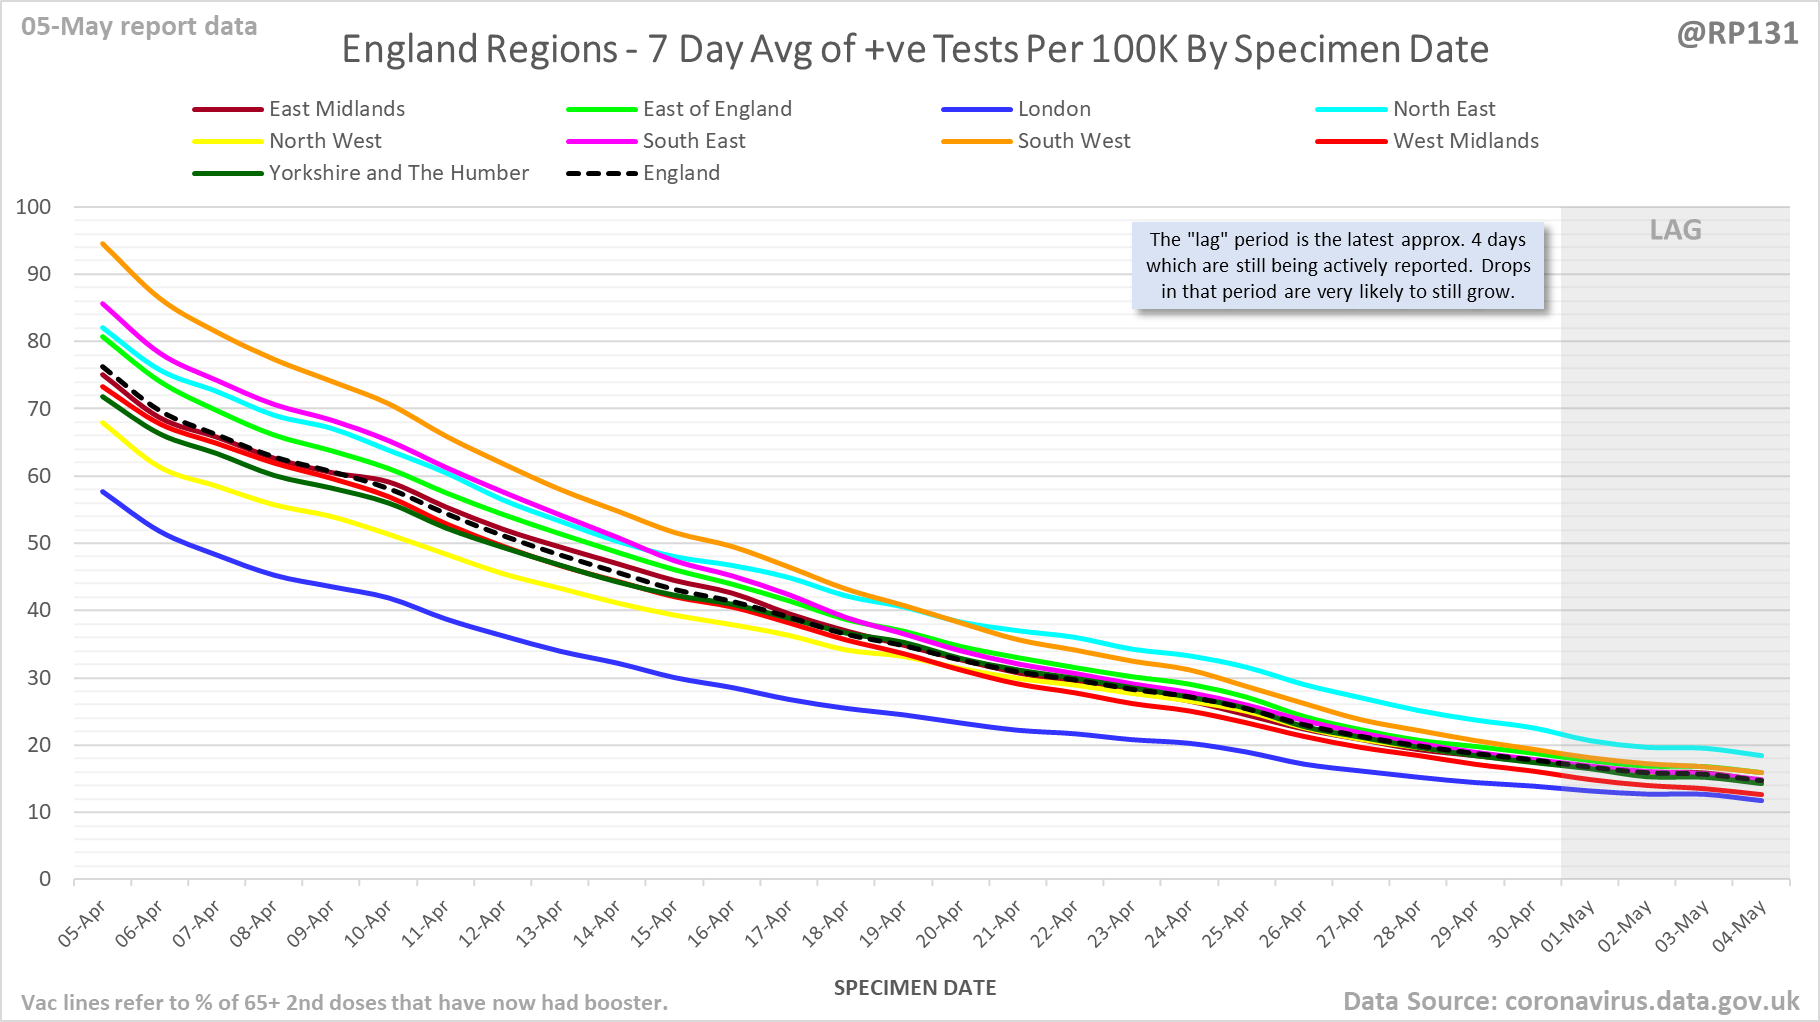
[1/23] #covid19uk - Detailed positive tests thread. The majority of this thread is a set of views of rolling 7 day average positives per 100K by specimen date. Starting with England regions:


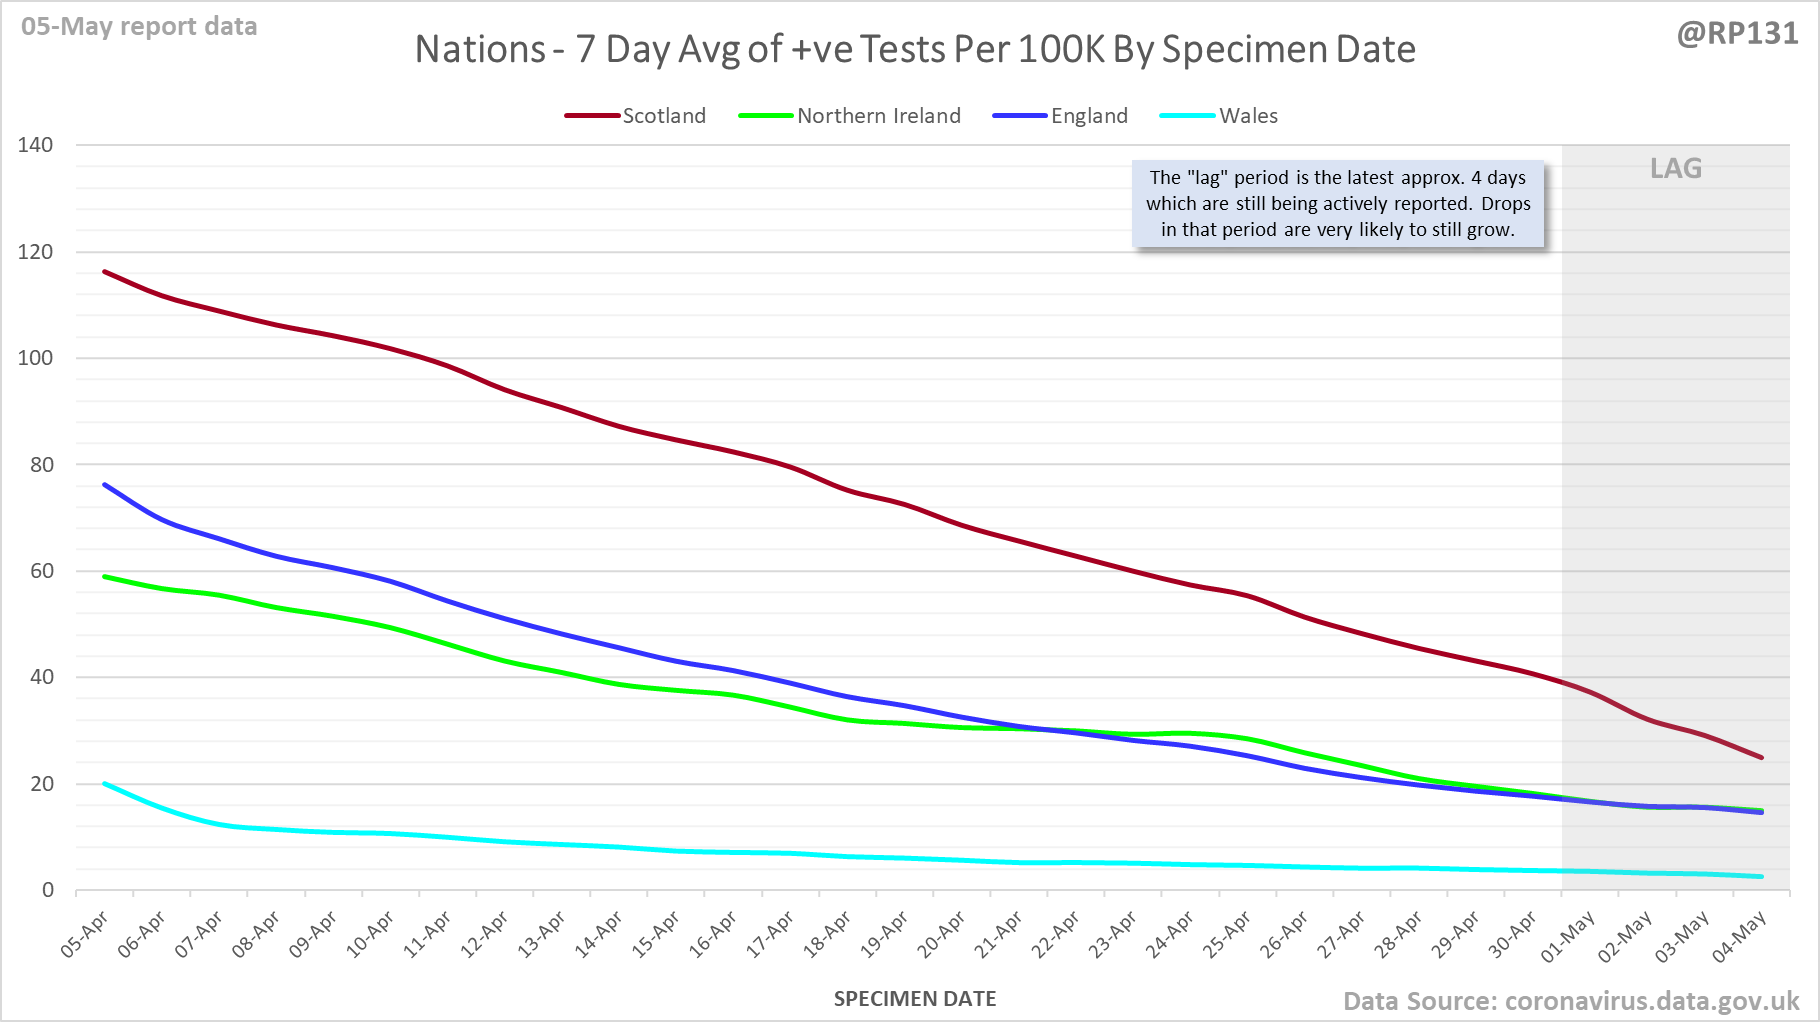
                [2/23] UK nations:


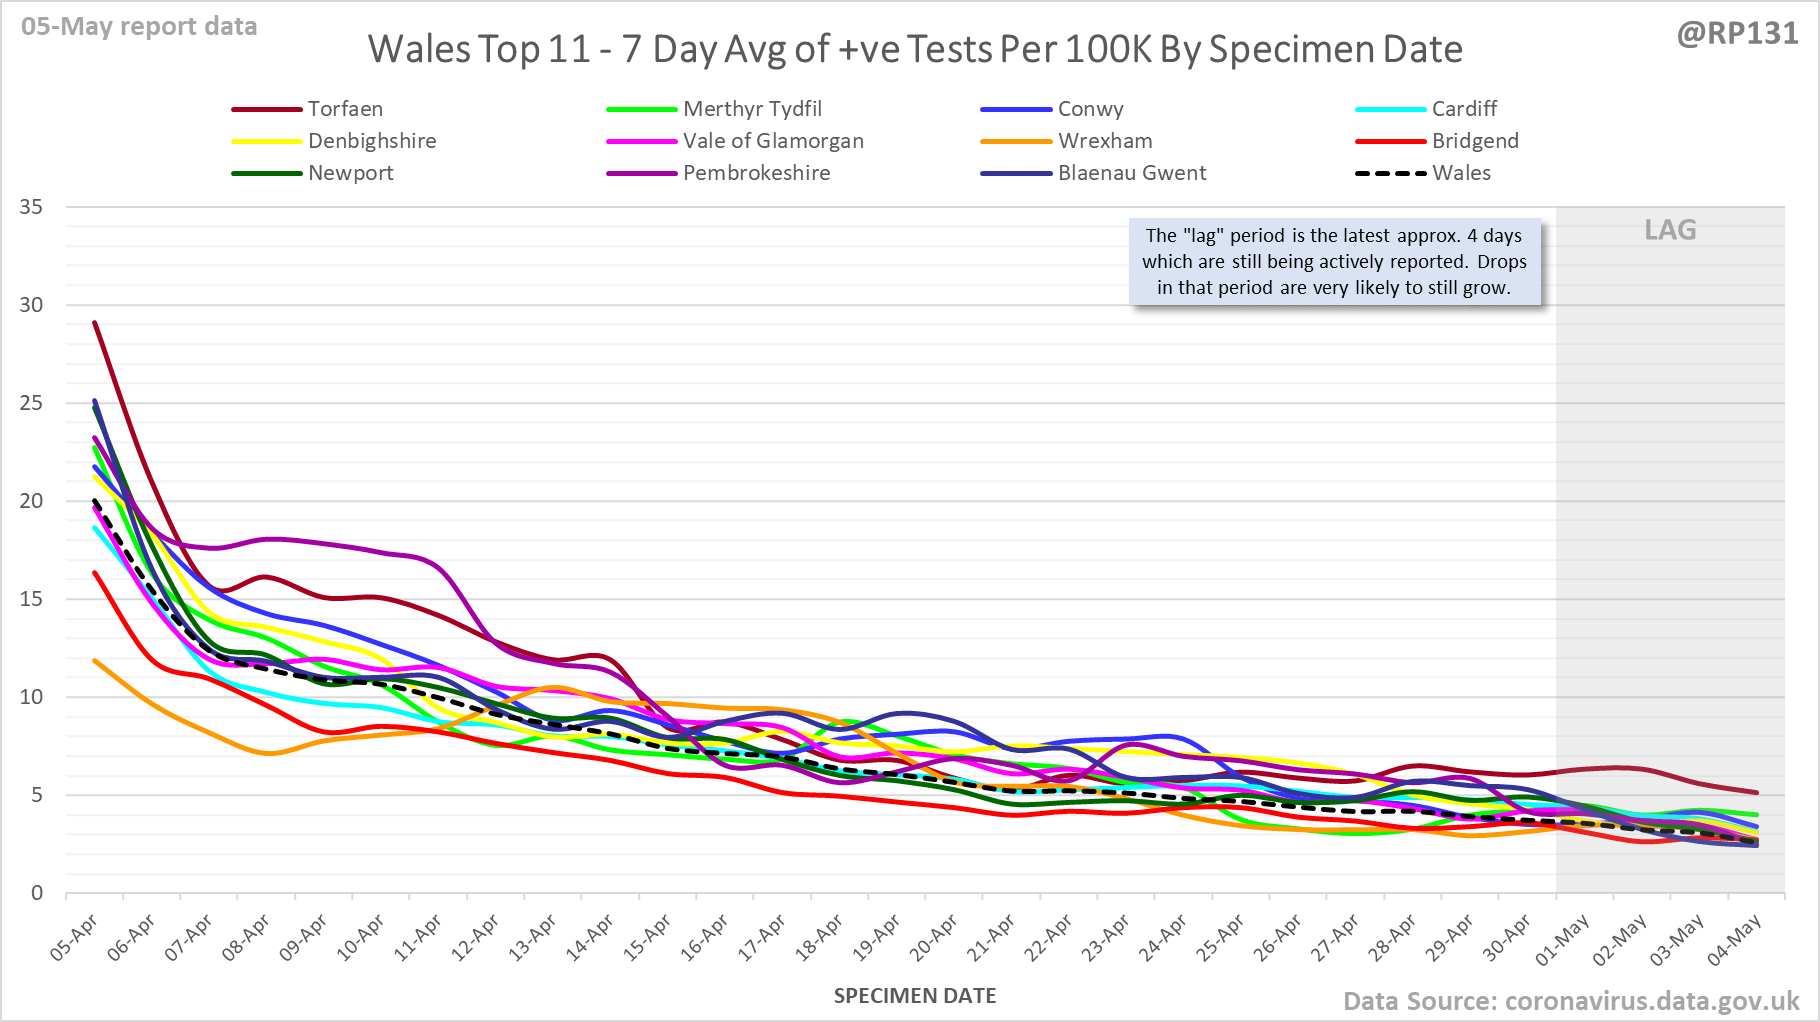
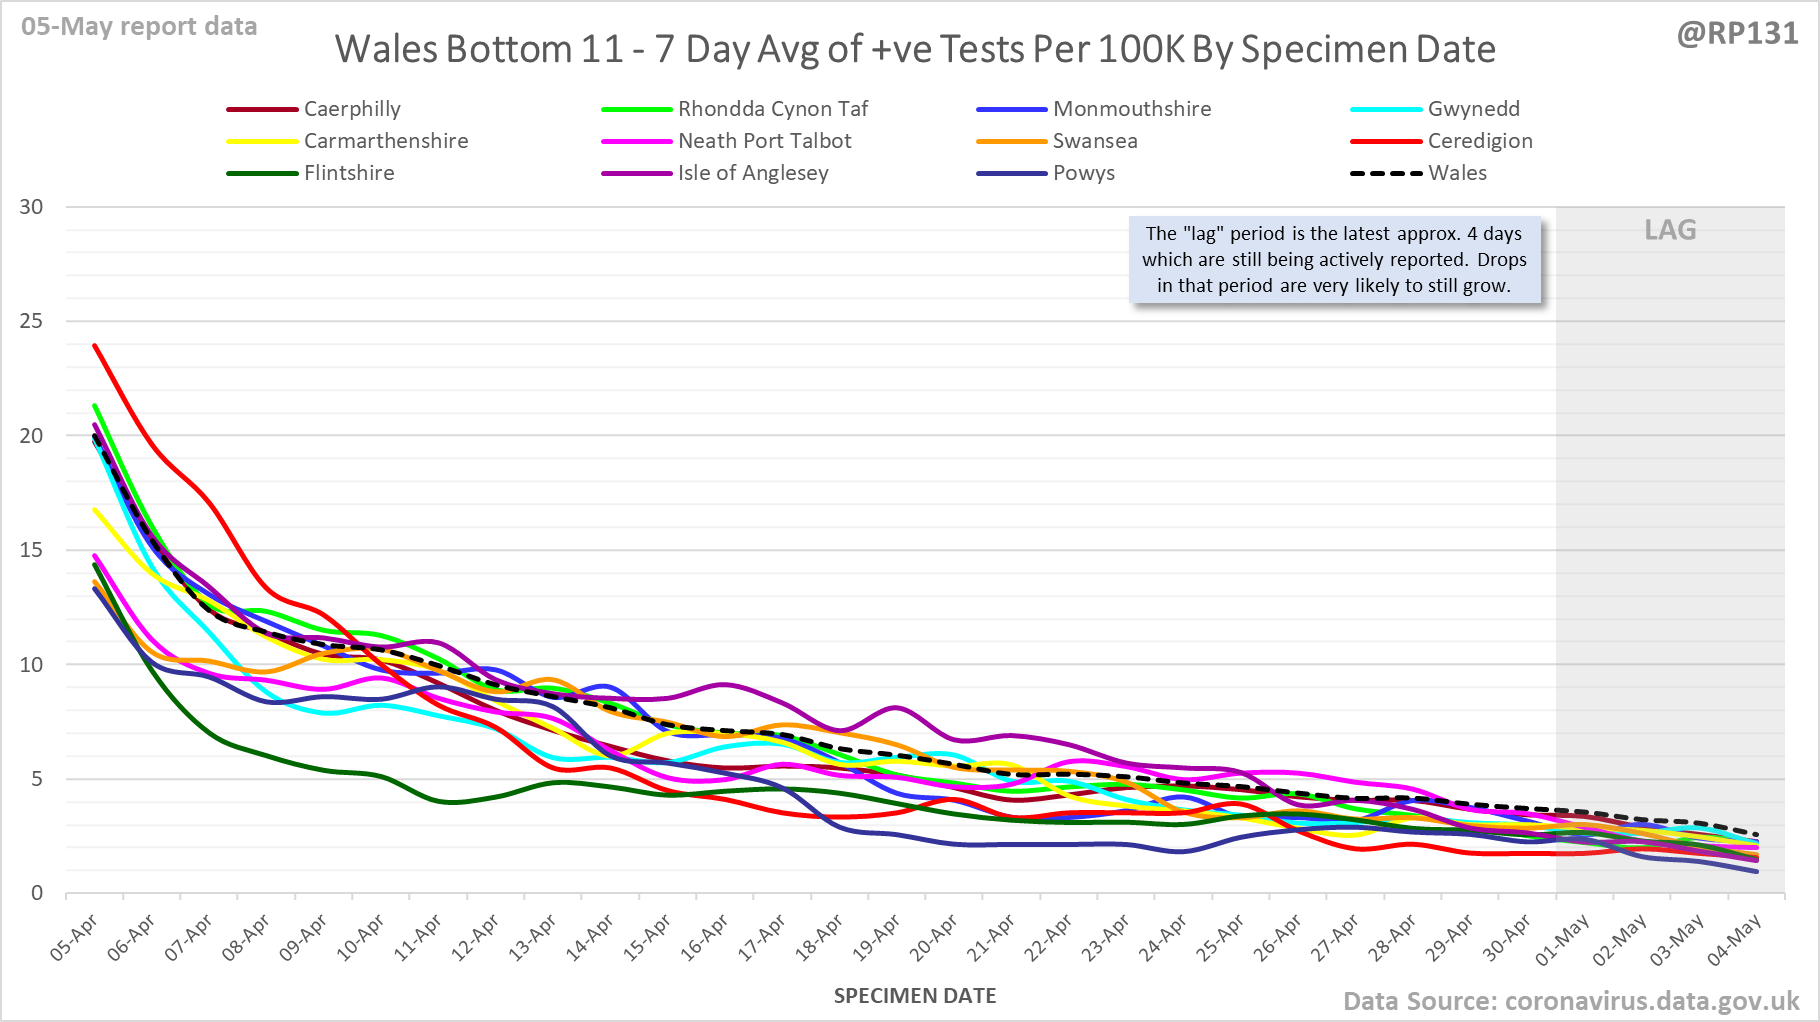
                [3/23] Wales - Top and bottom 11 (i.e. all 22 of them). Note they may have different Y axis scales to each other.


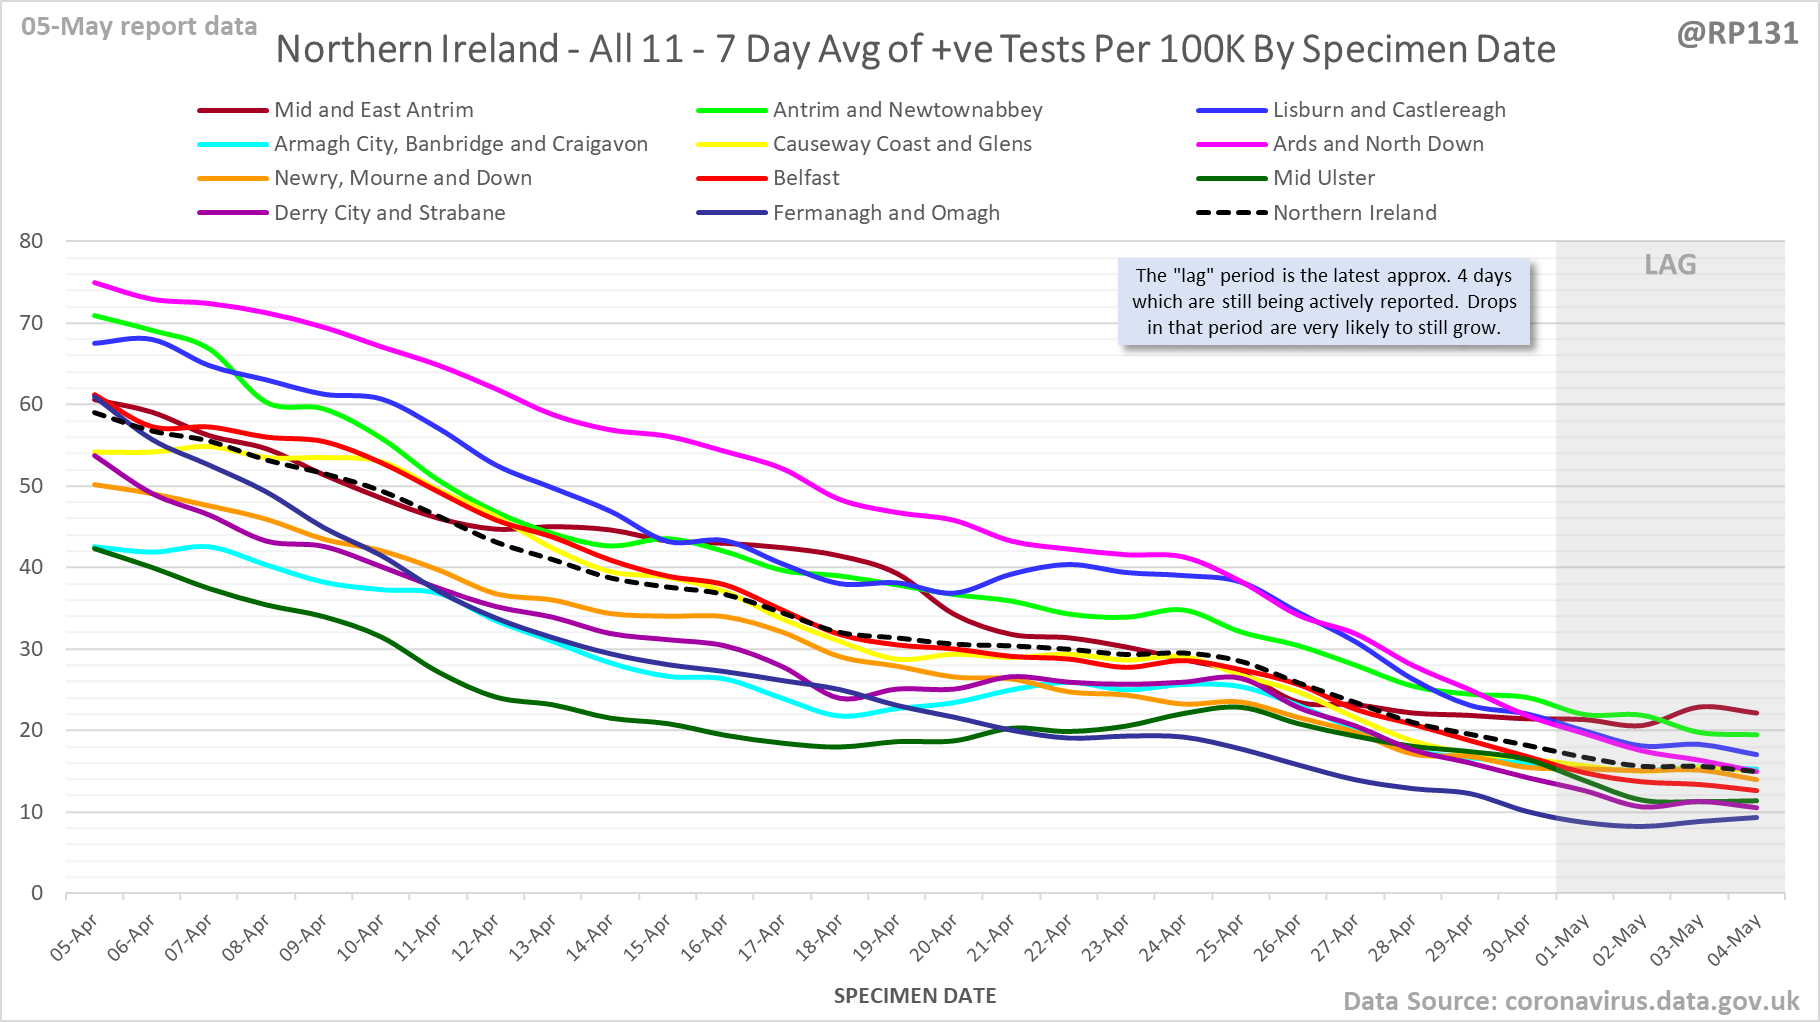
                [4/23] Northern Ireland:


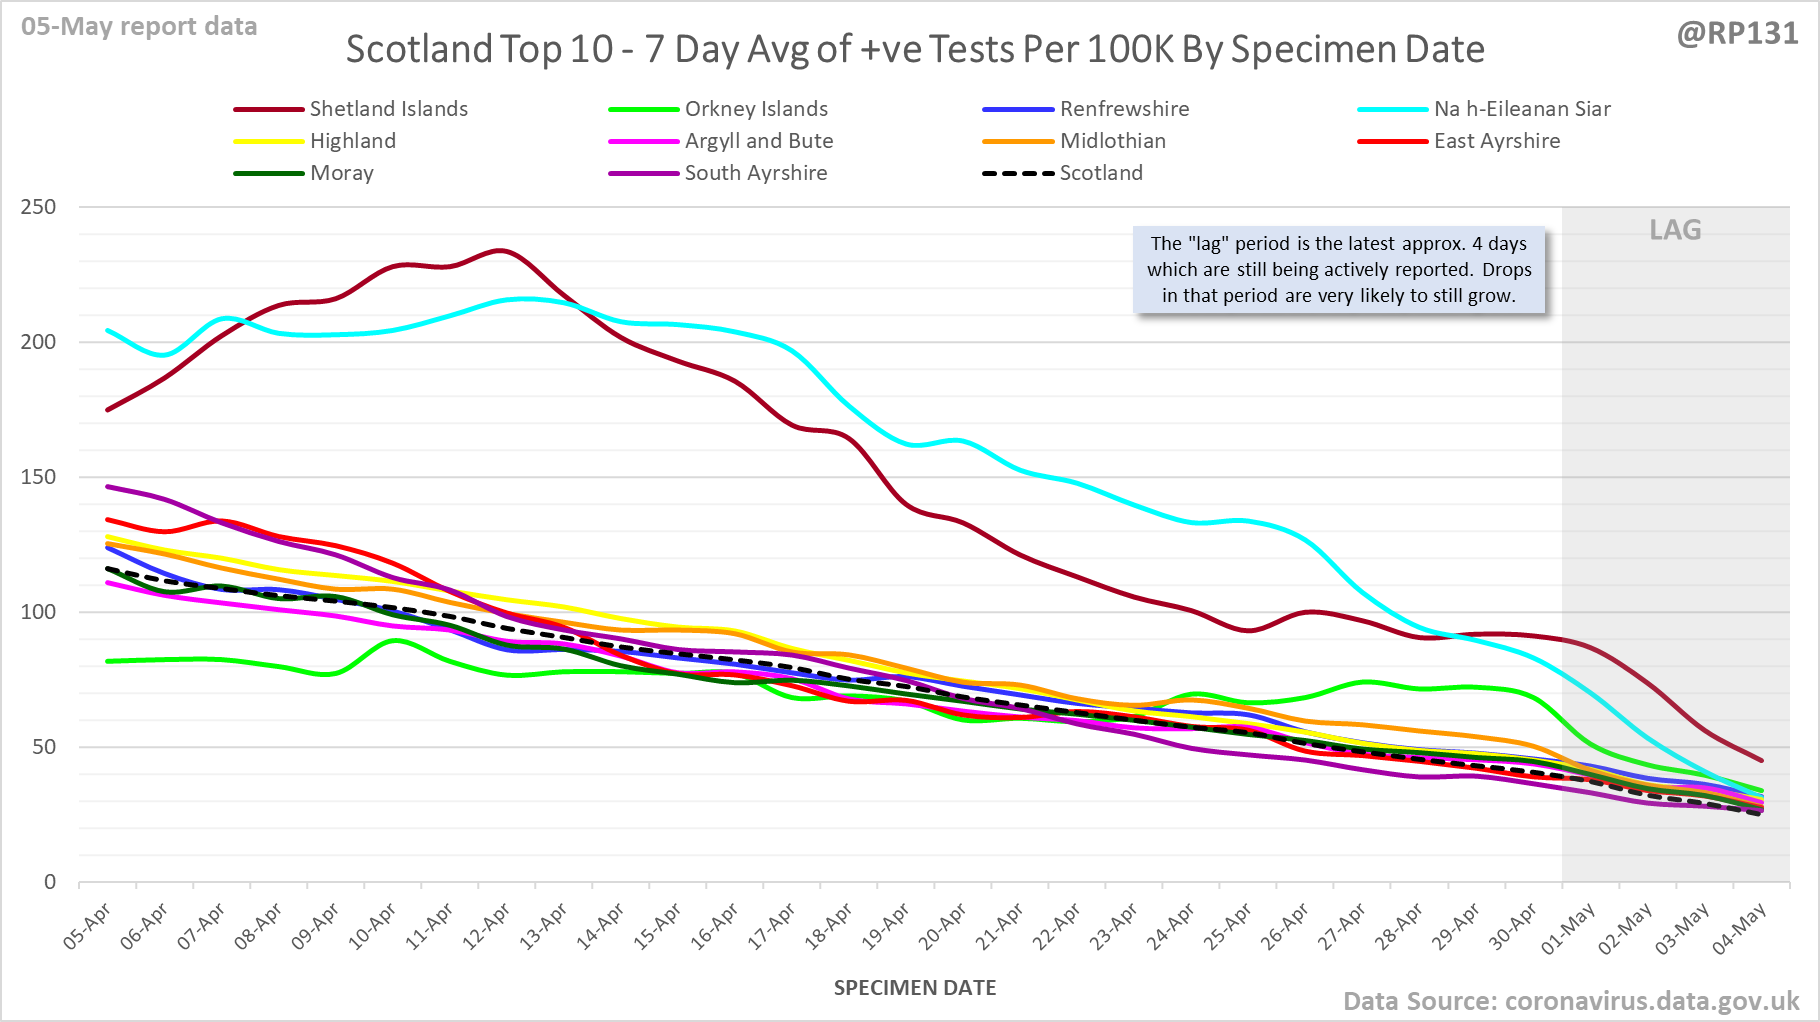
                [5/23] Scotland:


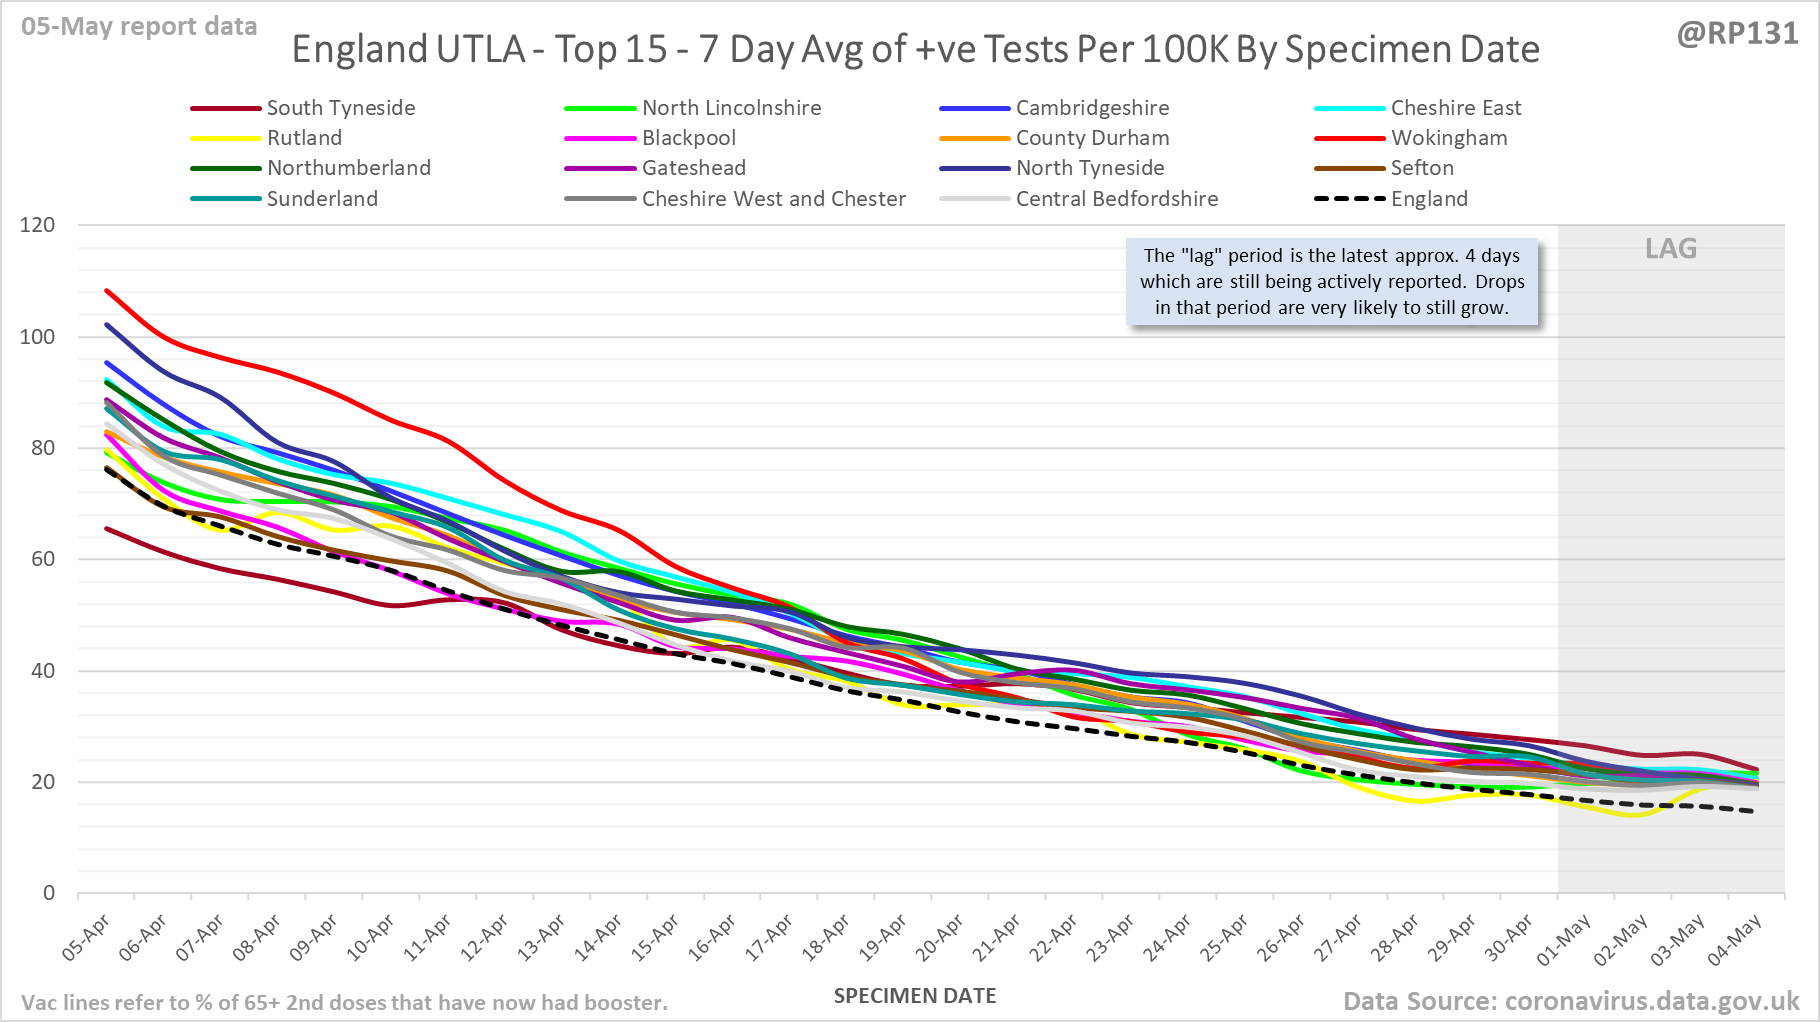
                [6/23] Top 15 of just Upper Tier Local Authorities in England:


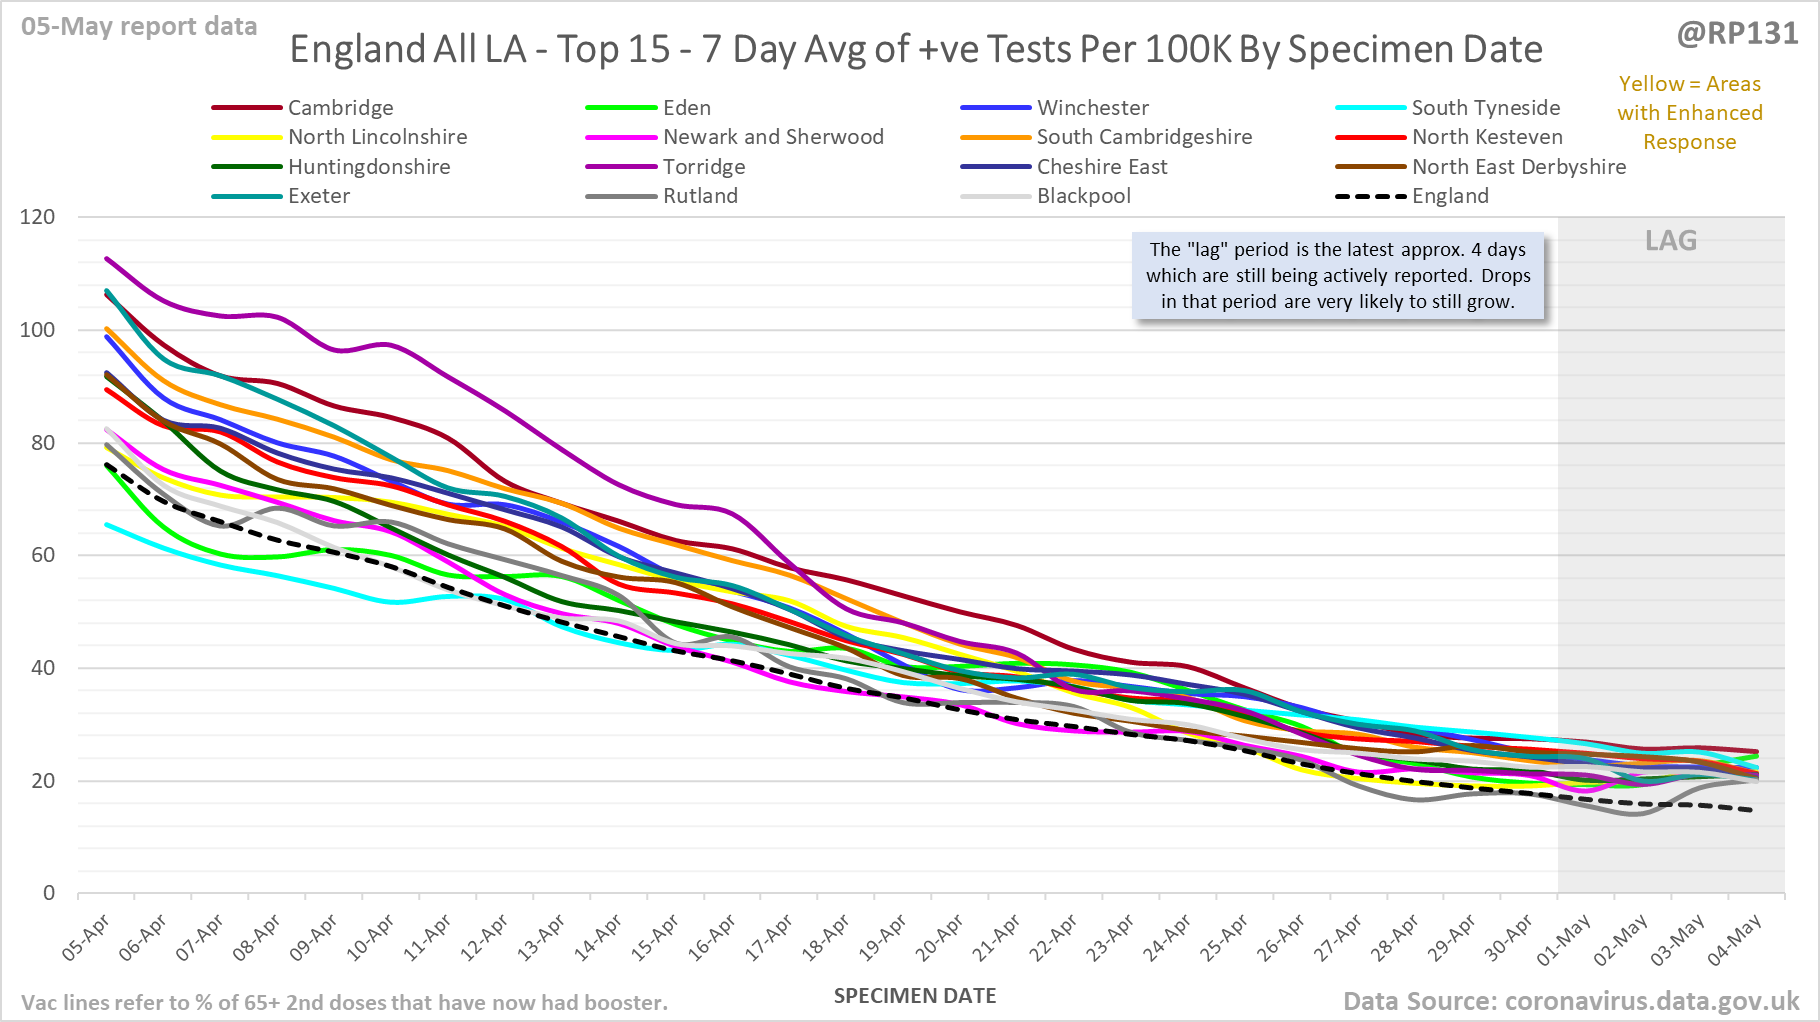
                [7/23] Top 15 of both Upper and Lower Tier Local Authorities in England:


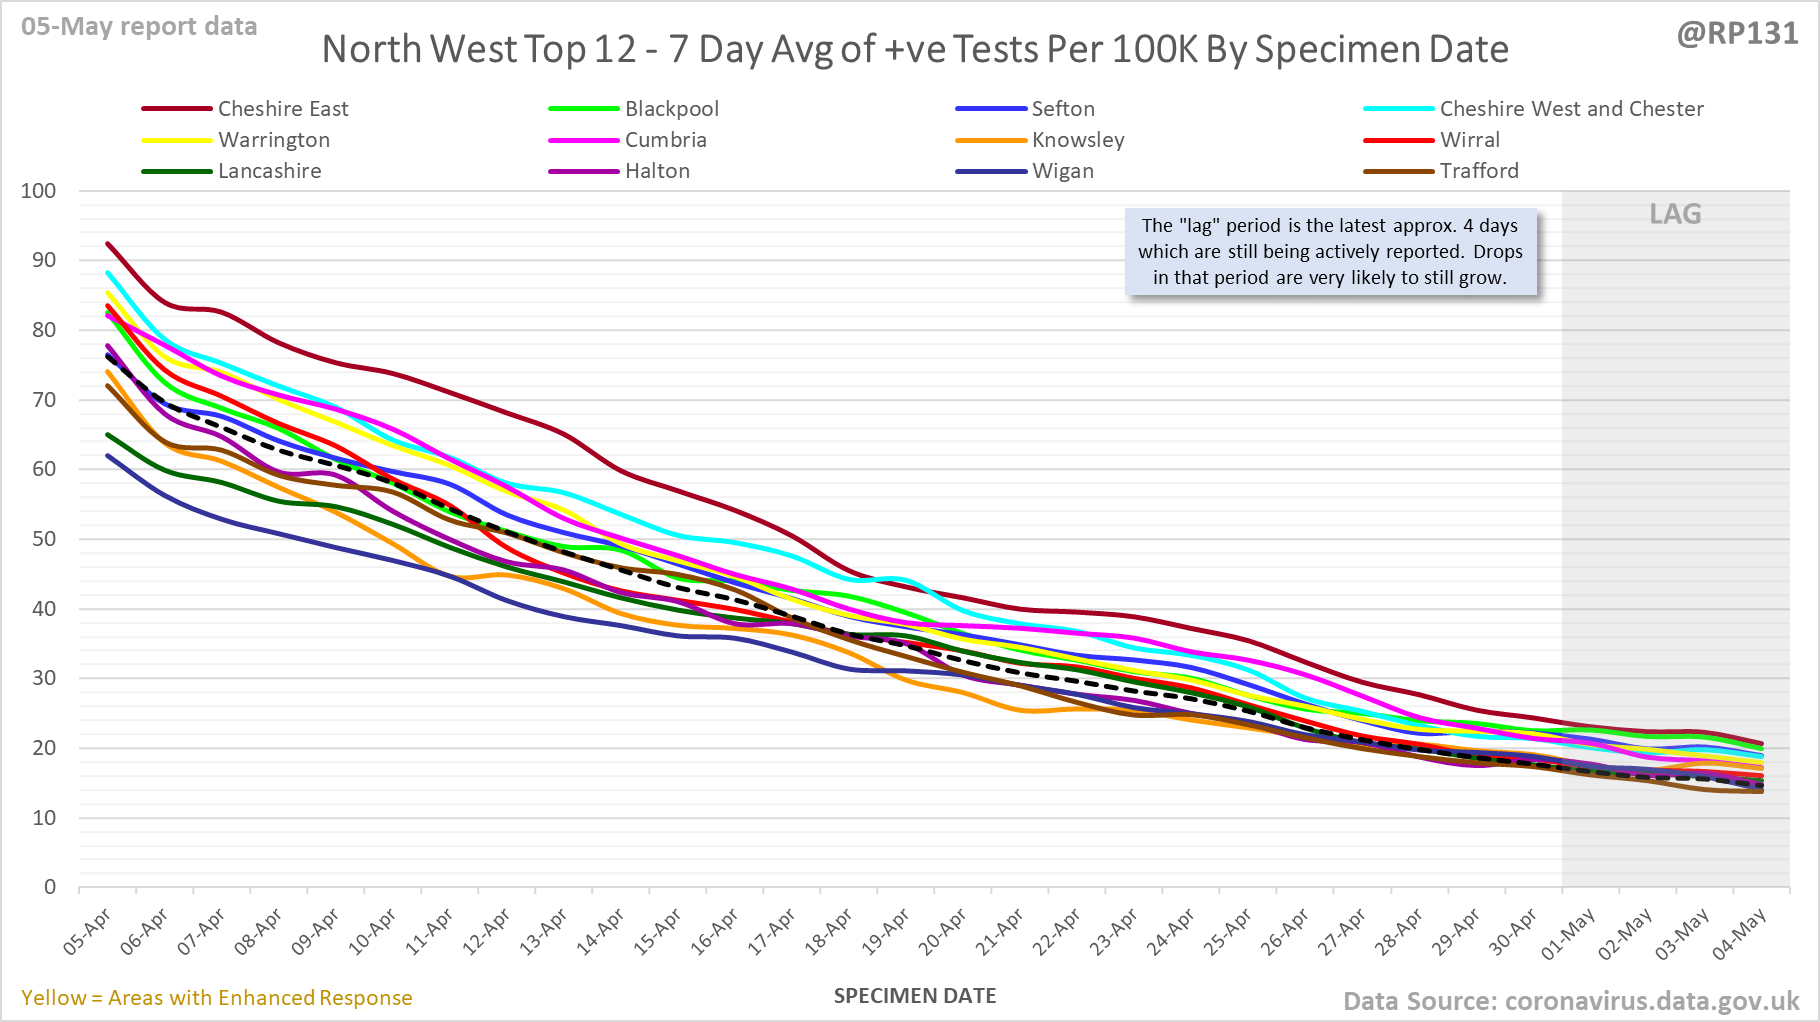
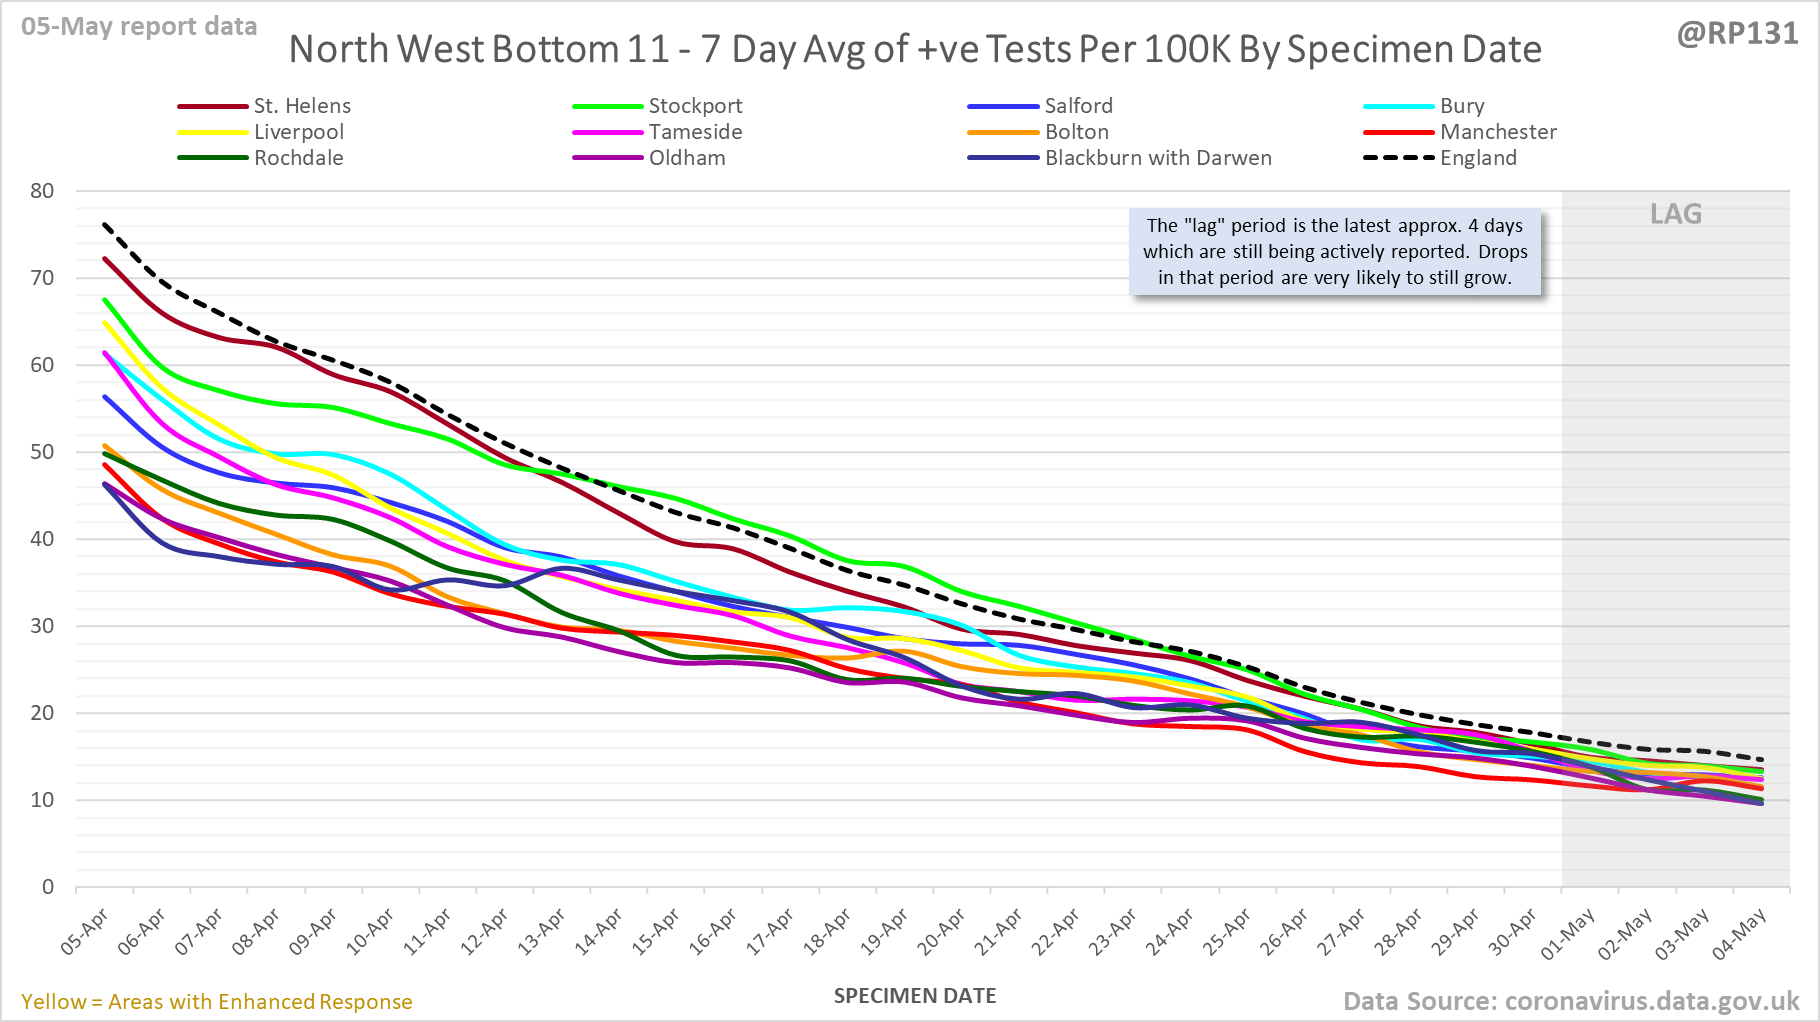
                [8/23] North West - Top 12 and bottom 11 (i.e. all 23 of them). Note they may have different Y axis scales to each other


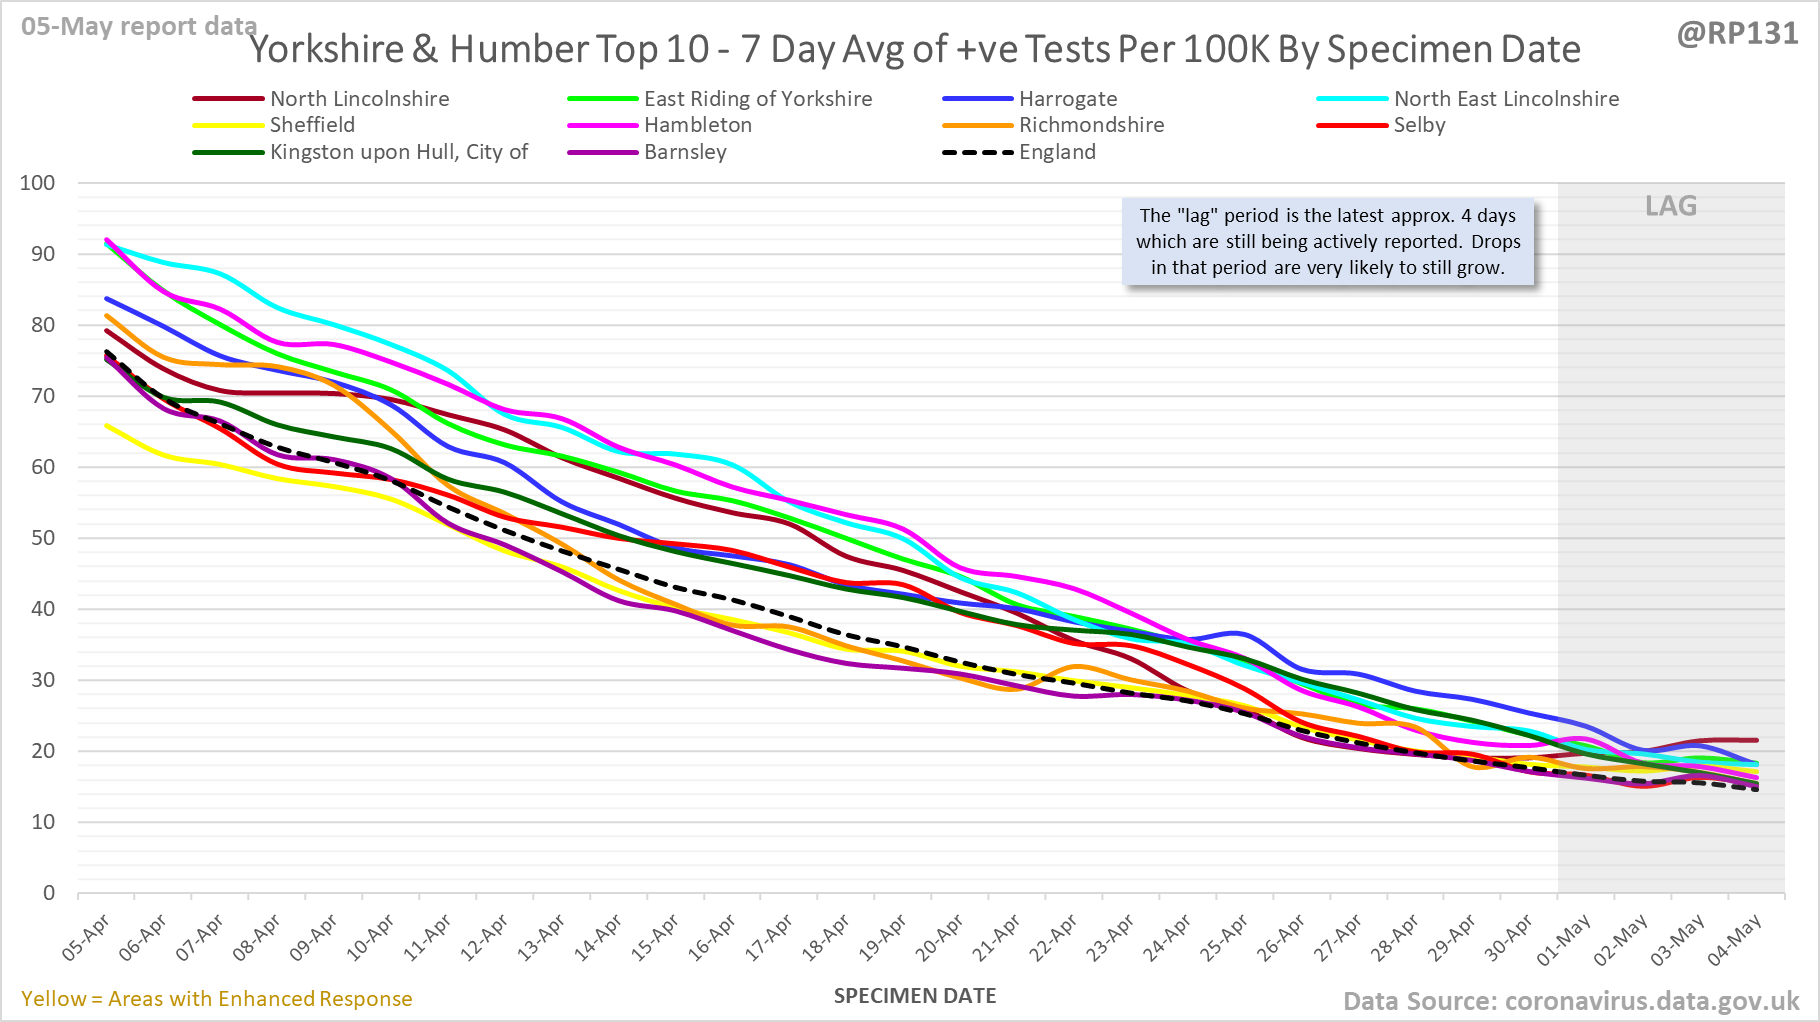
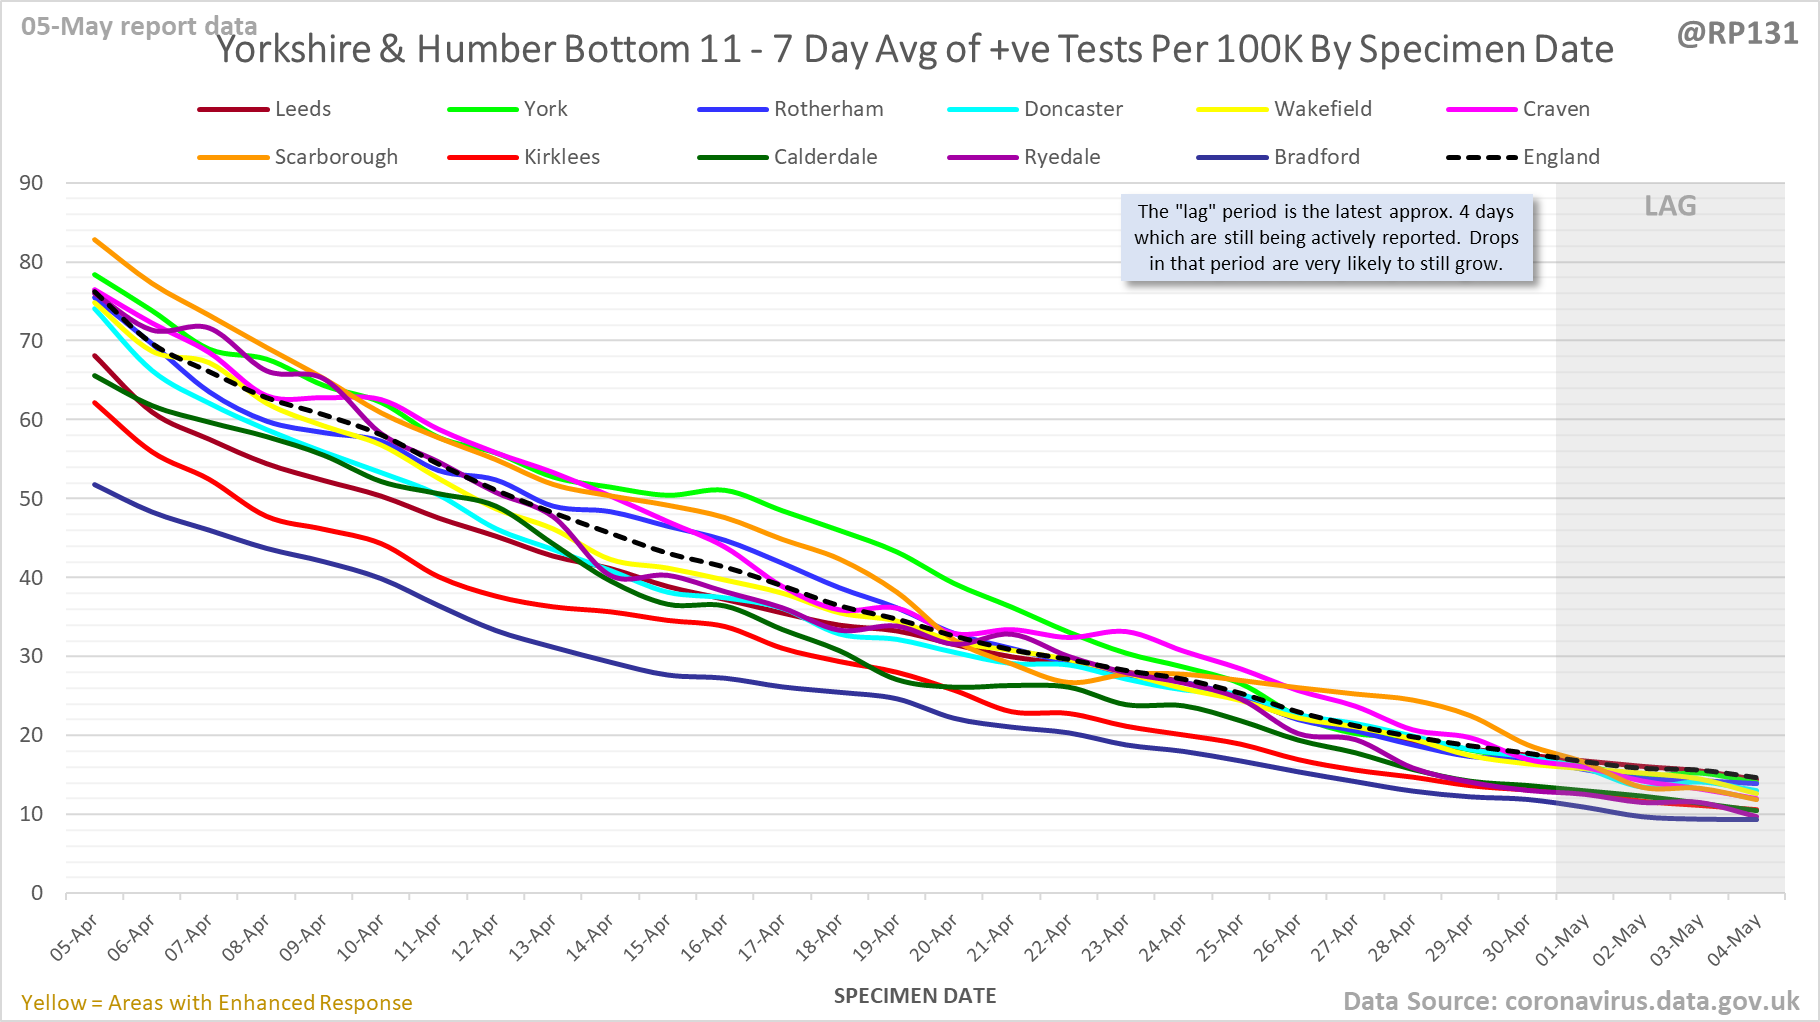
                [9/23] Yorkshire & Humber - Top 10 and bottom 11 (i.e. all 21 of them). Note they may have different Y axis scales to each other


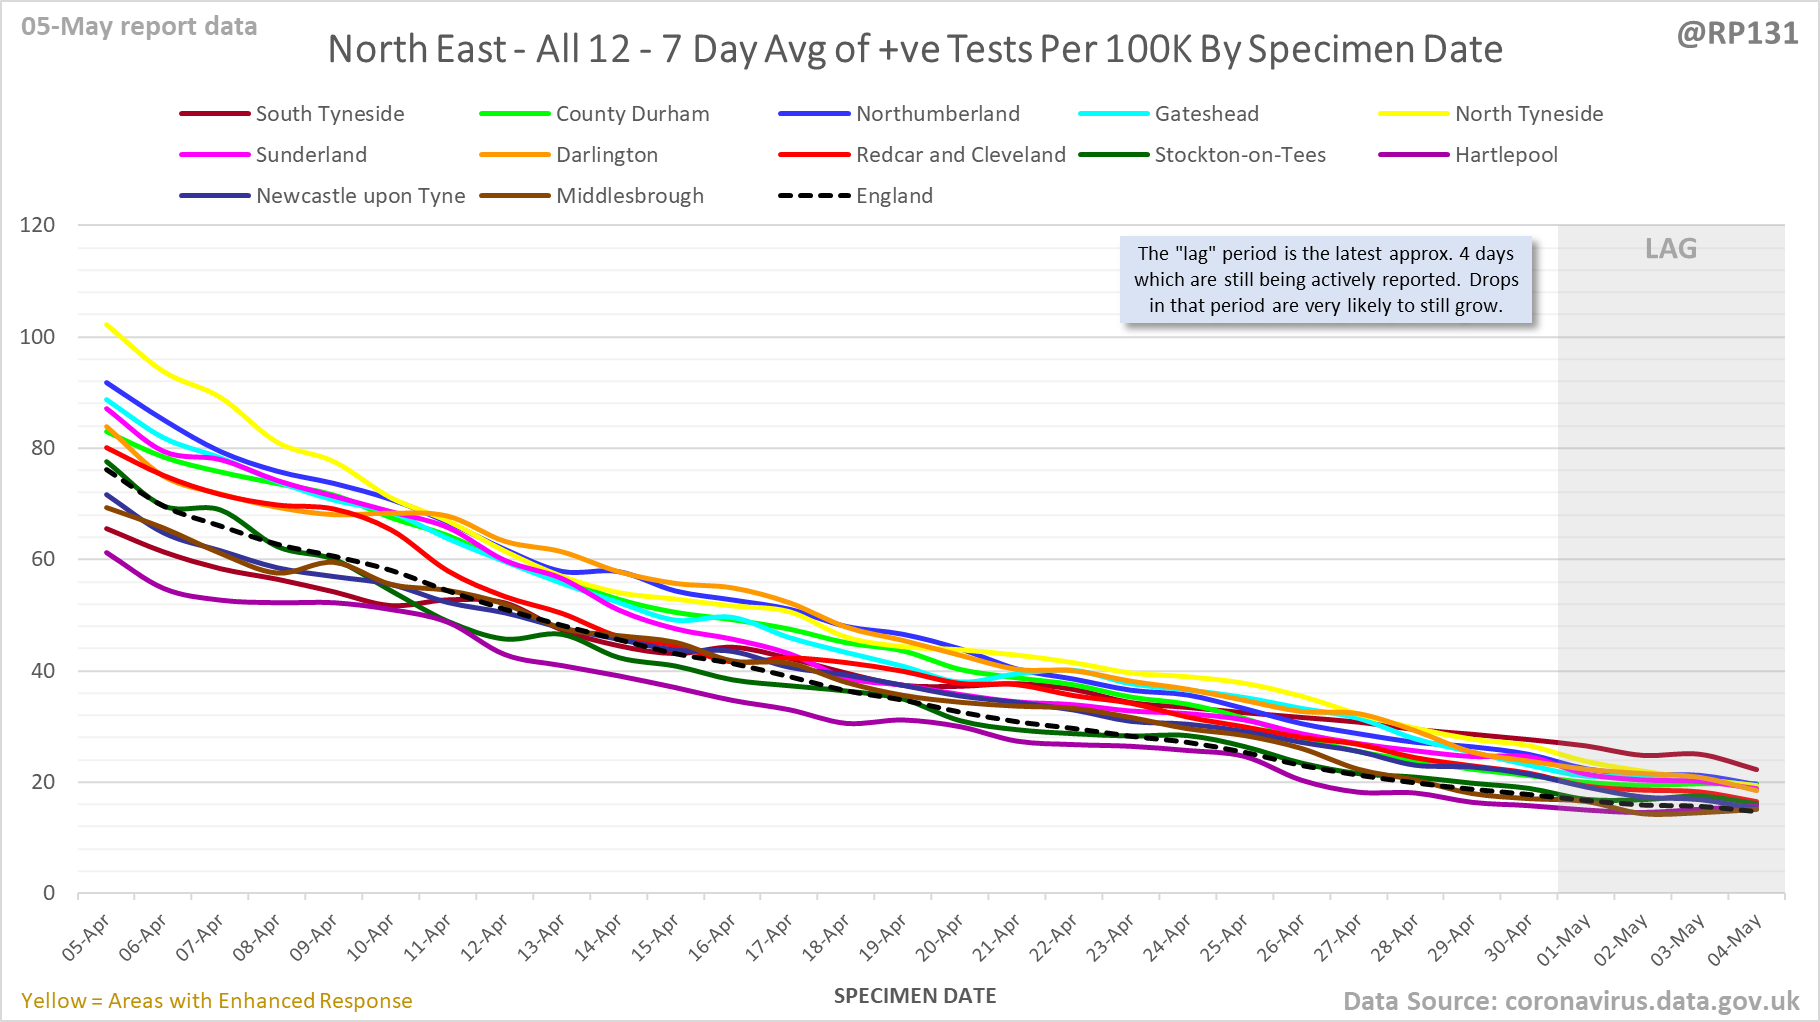
                [10/23] North East / West Midlands / East Midlands / East of England:


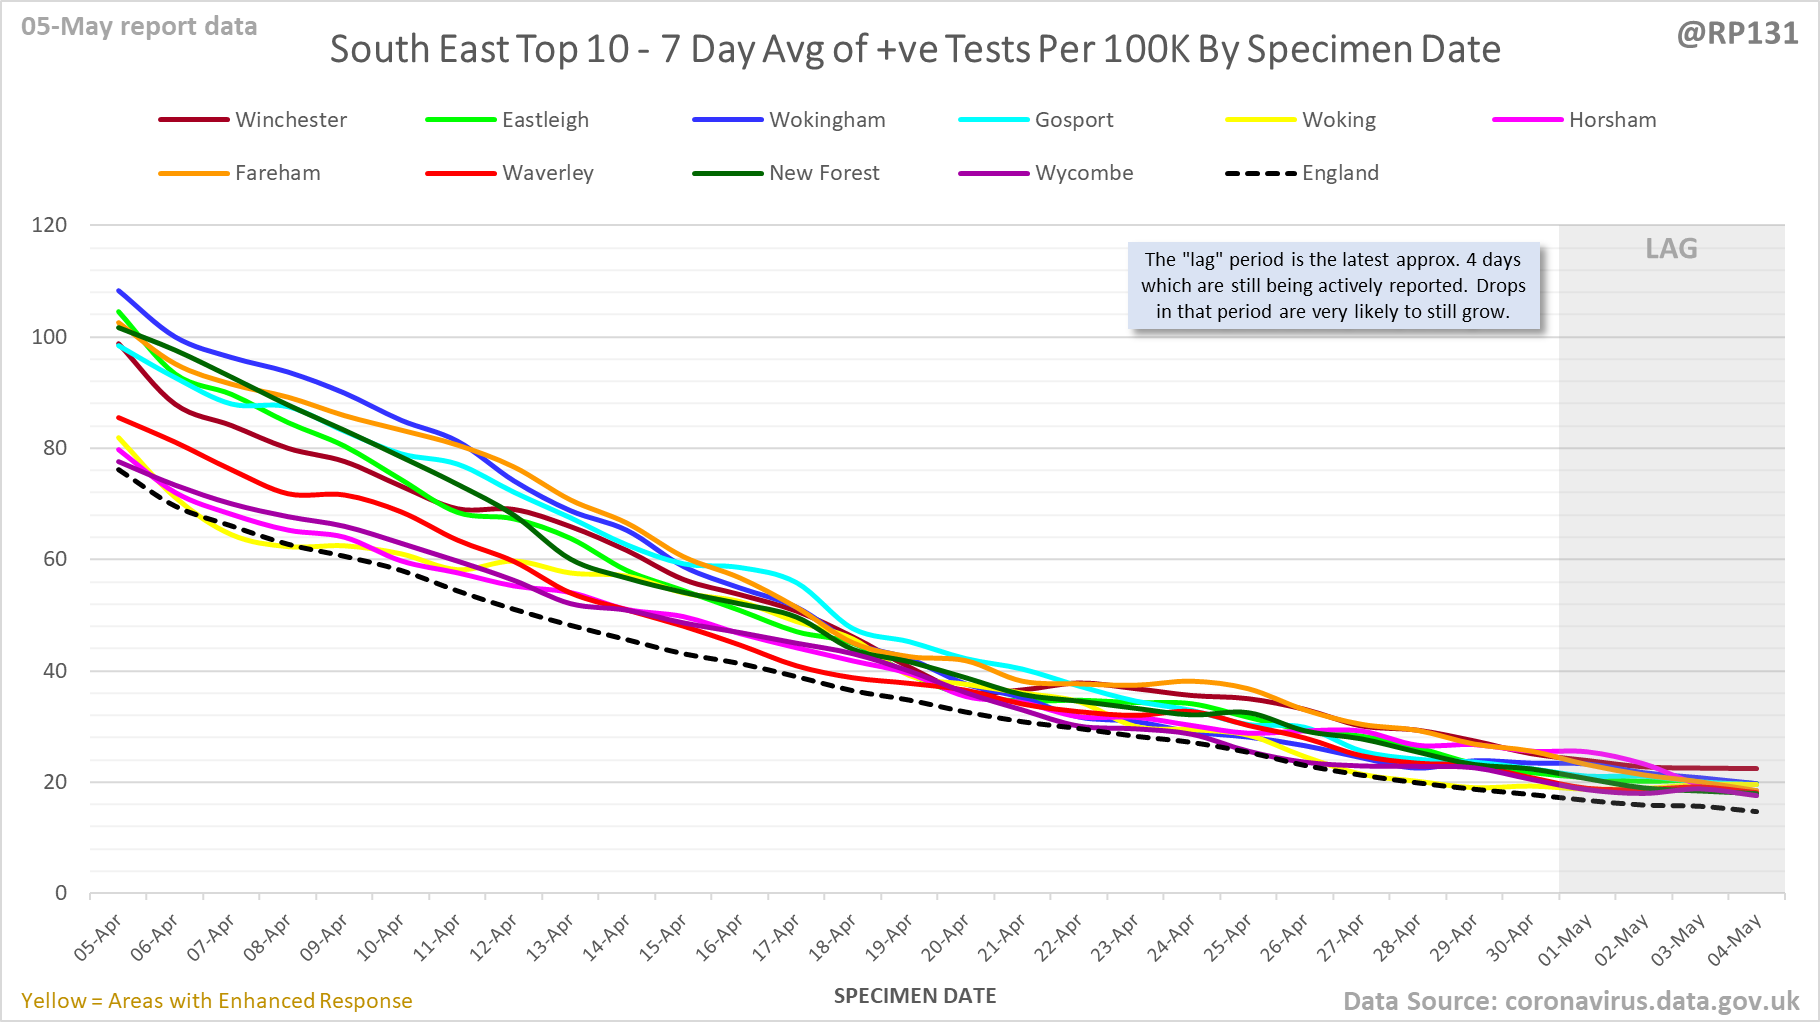
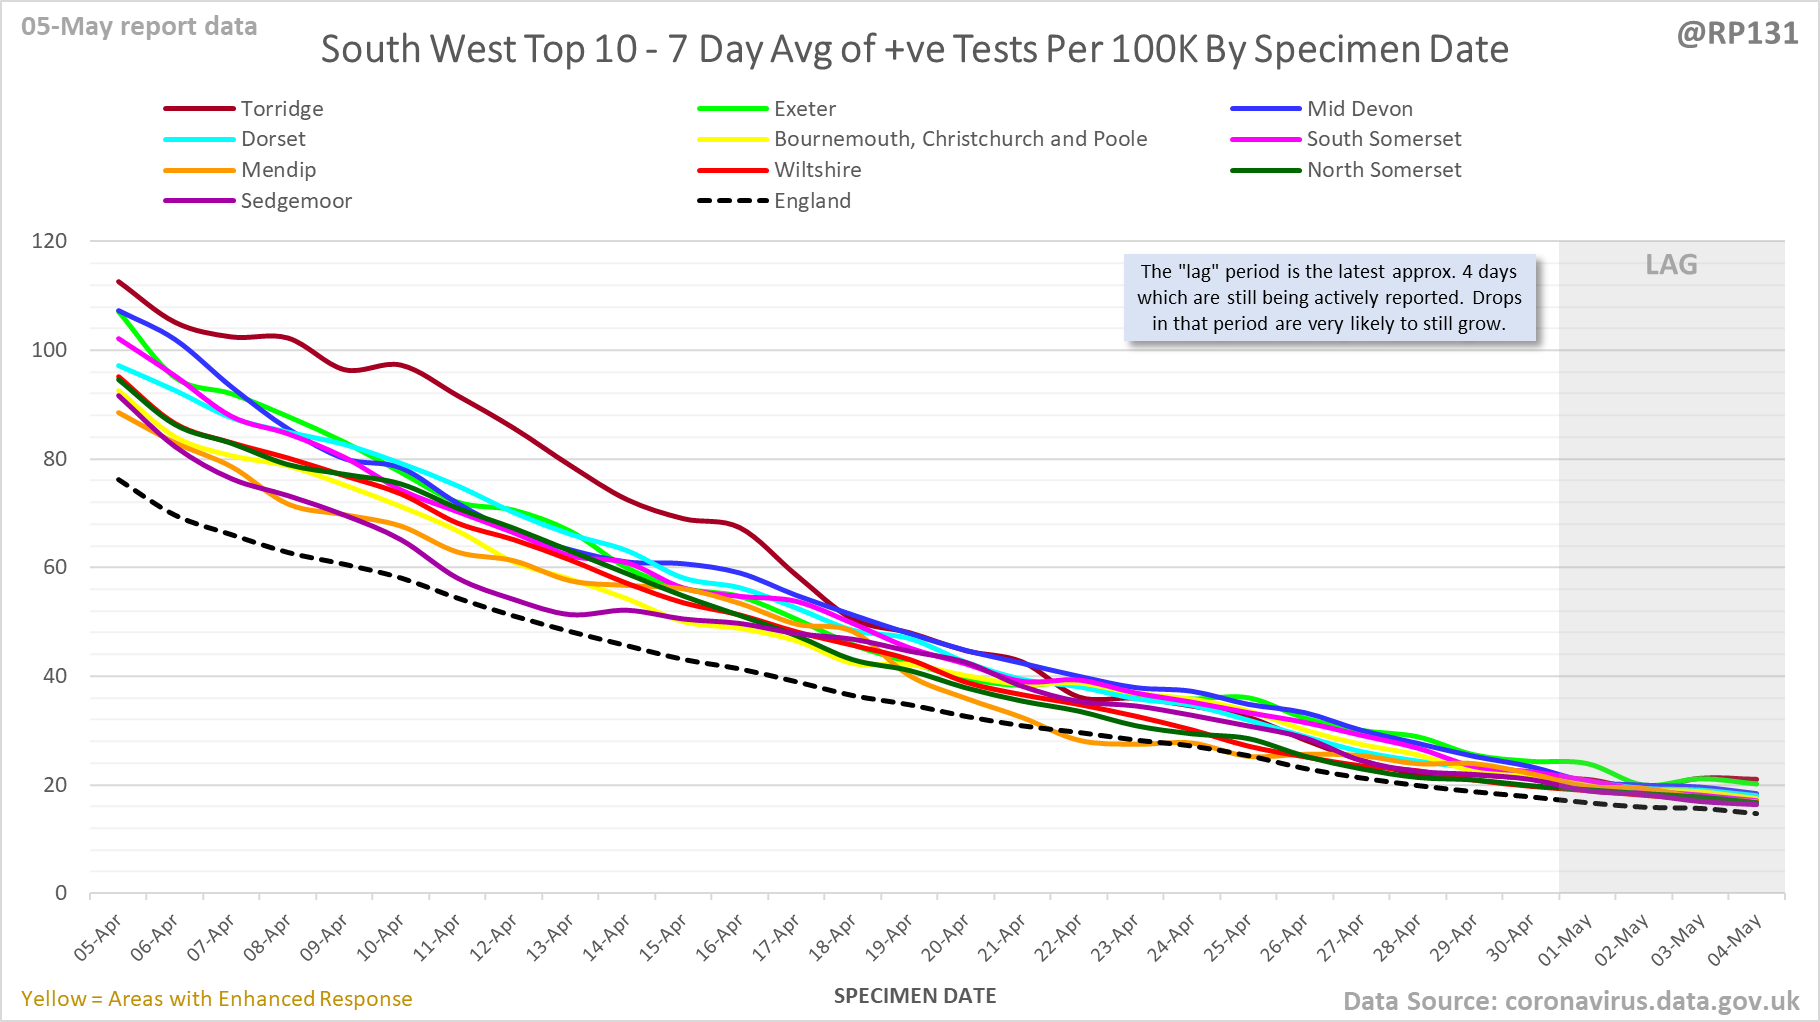
                [11/23] London / South East / South West:


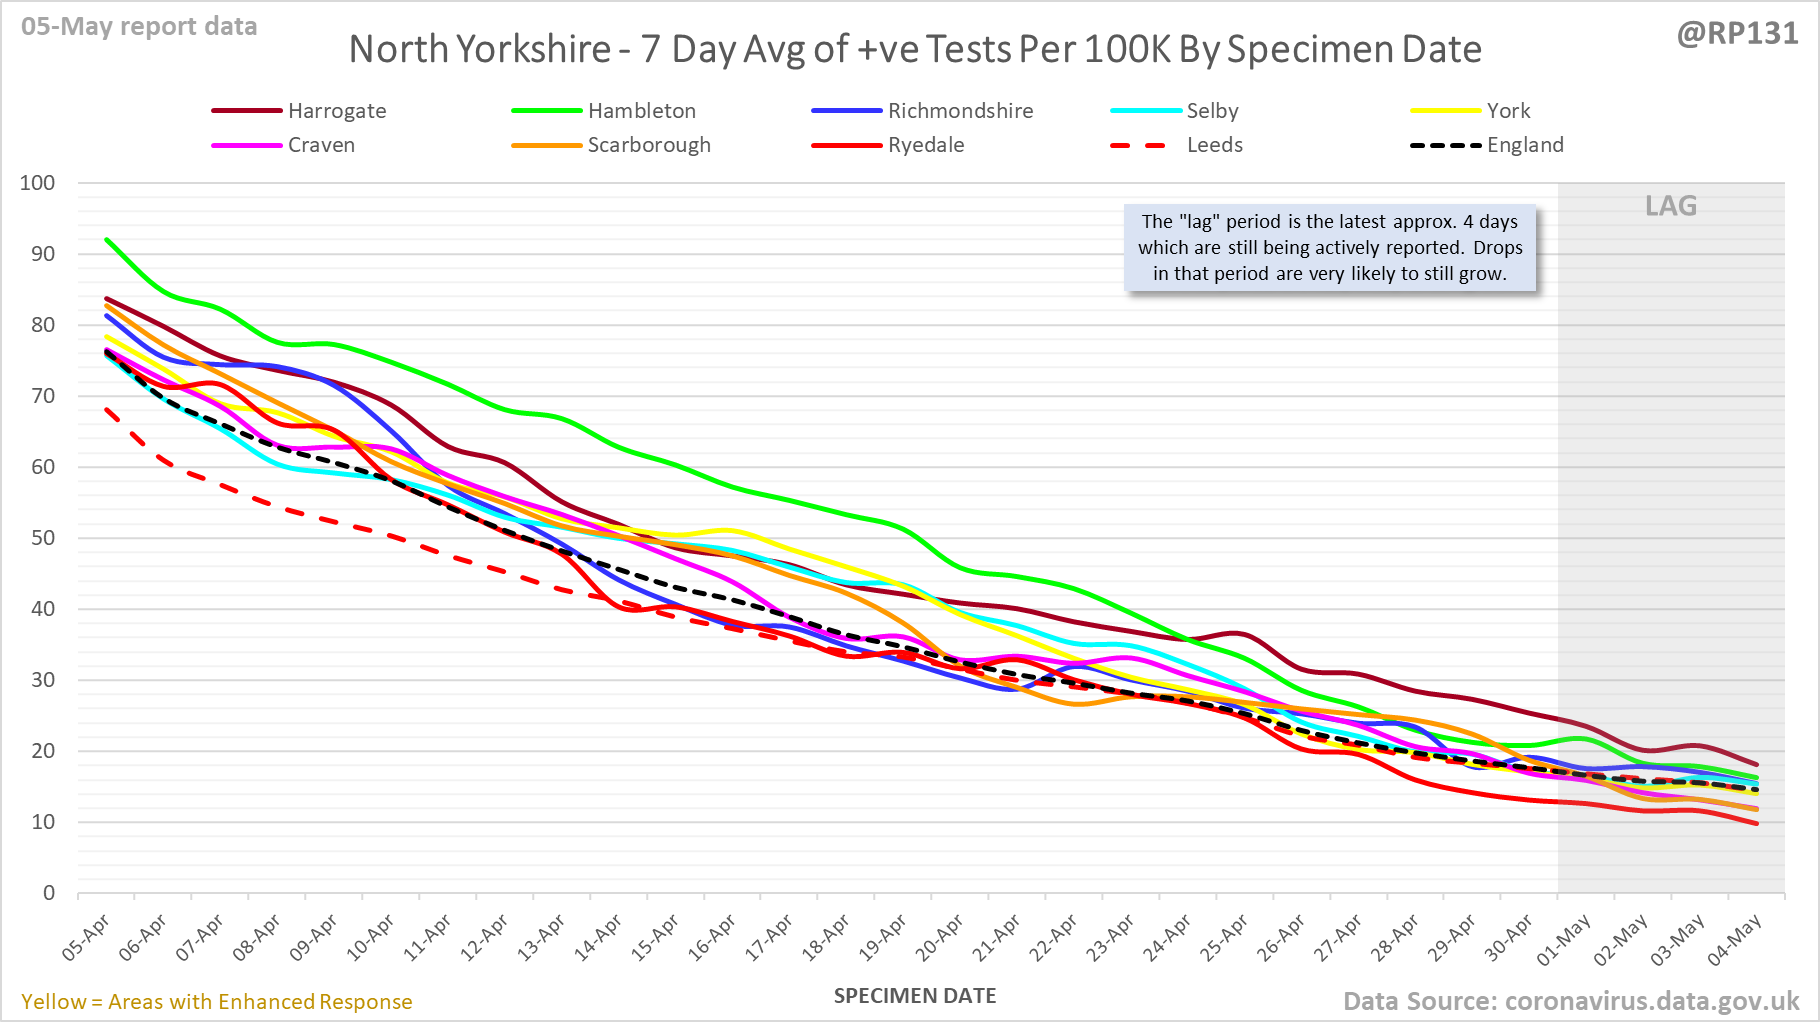
                [12/23] North Yorkshire by itself (with Leeds included as a nearby hotspot example, which I know isn't in North Yorkshire!):


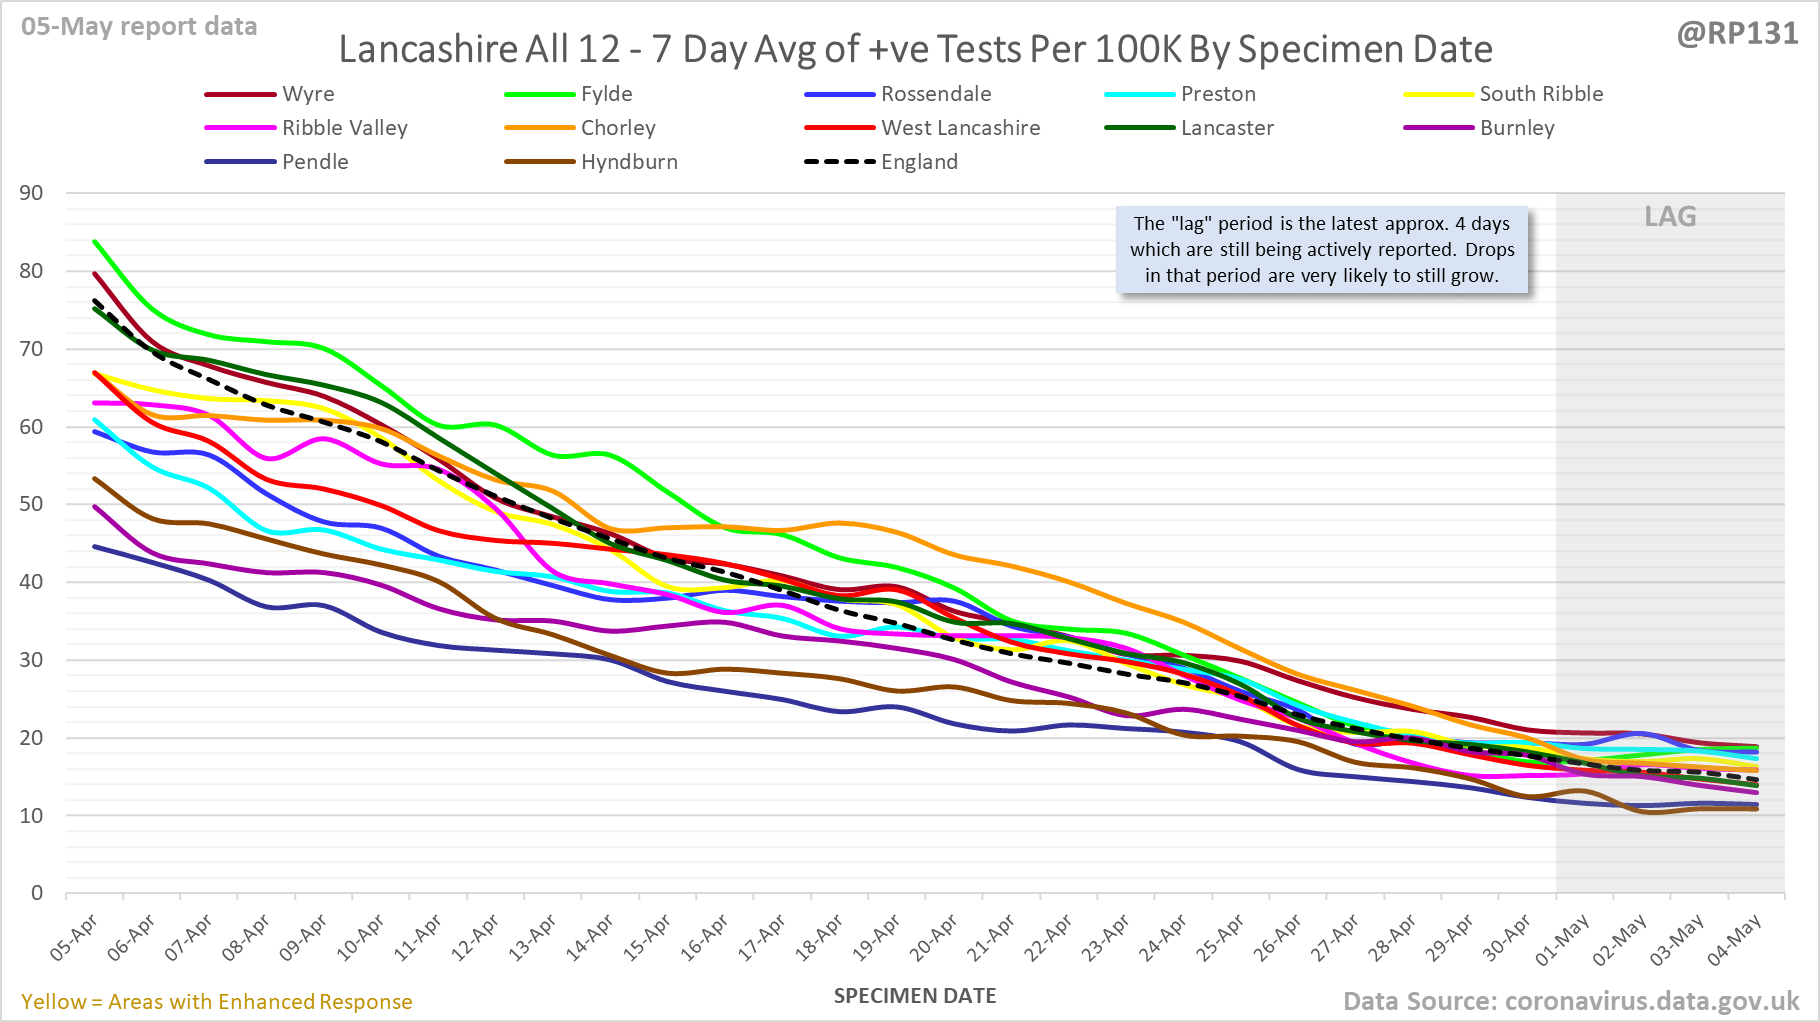
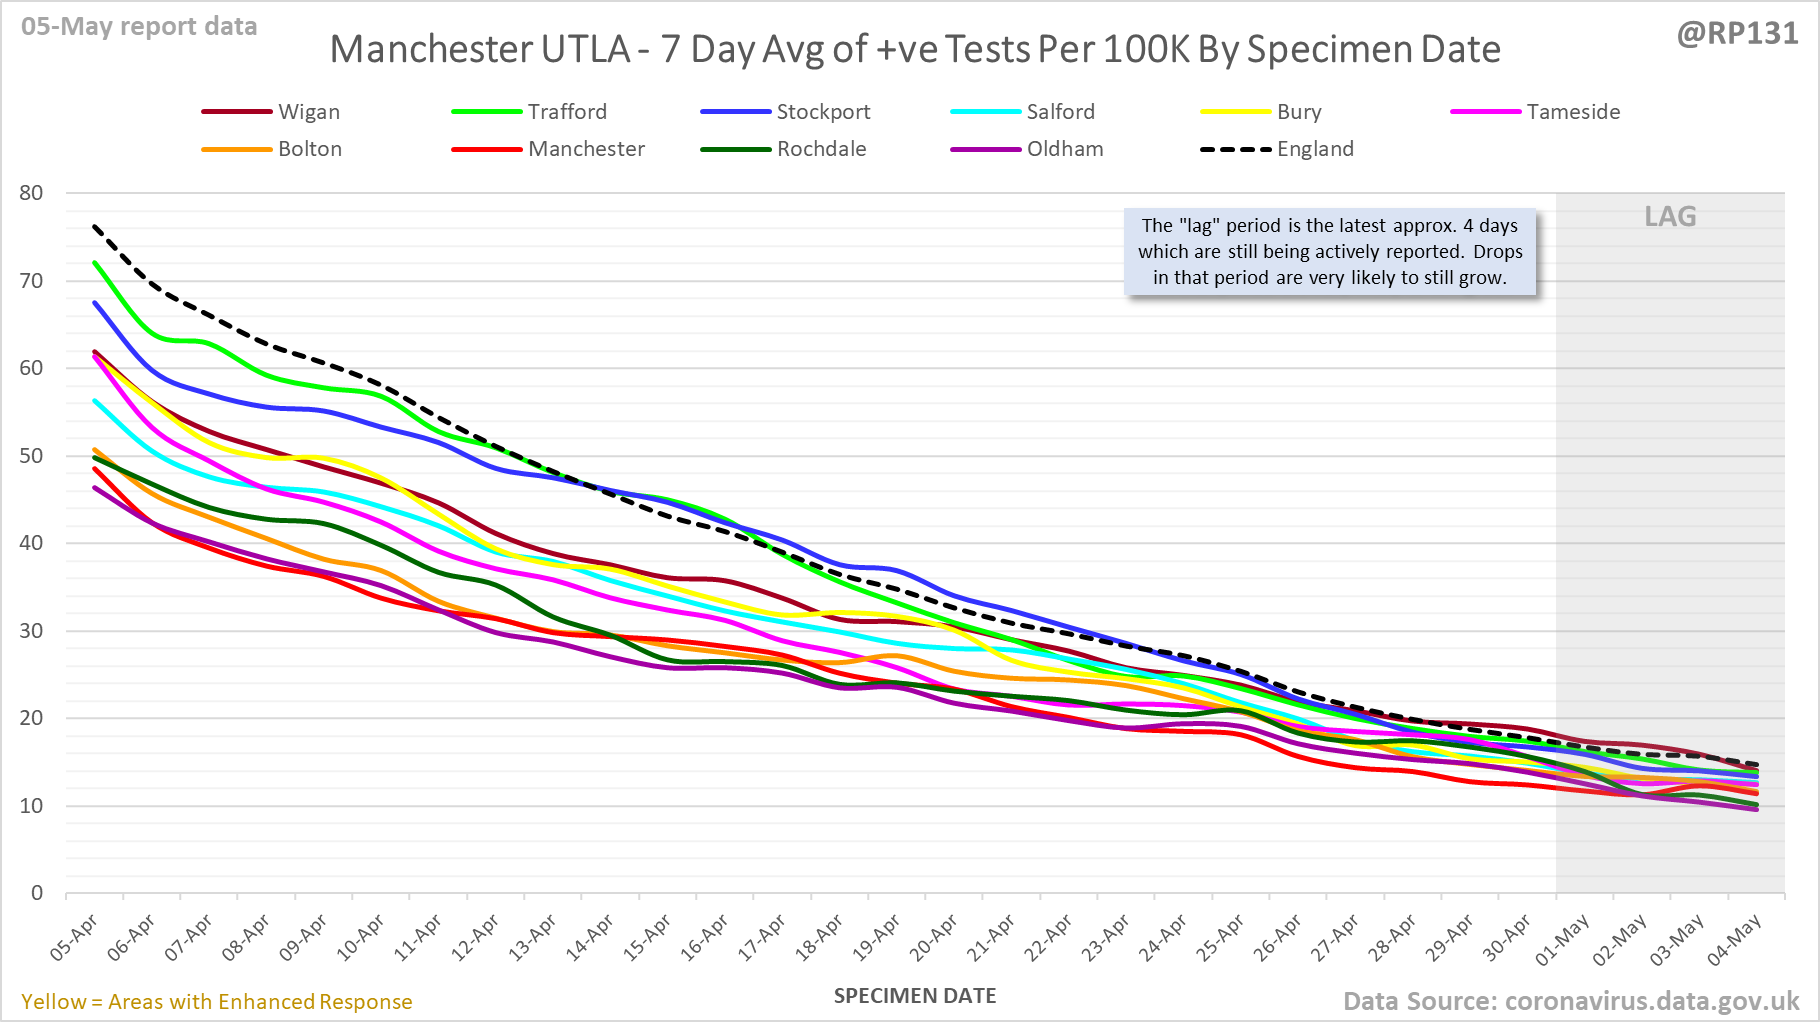
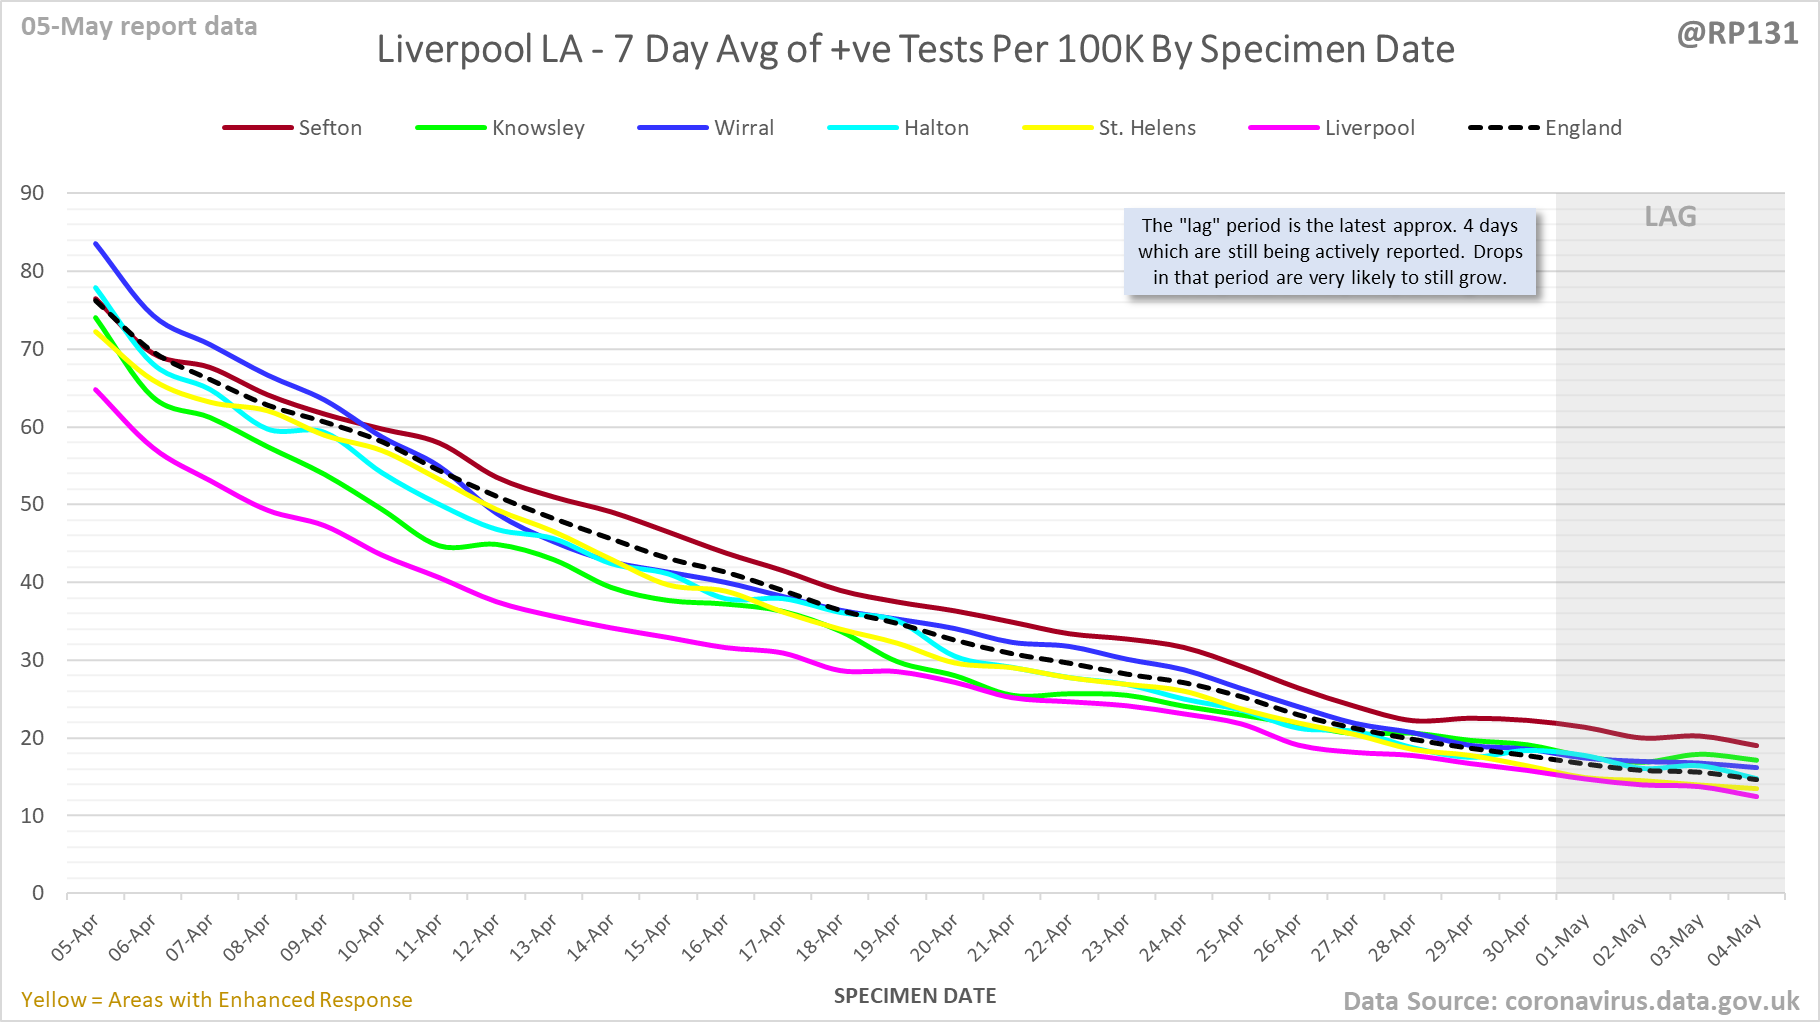
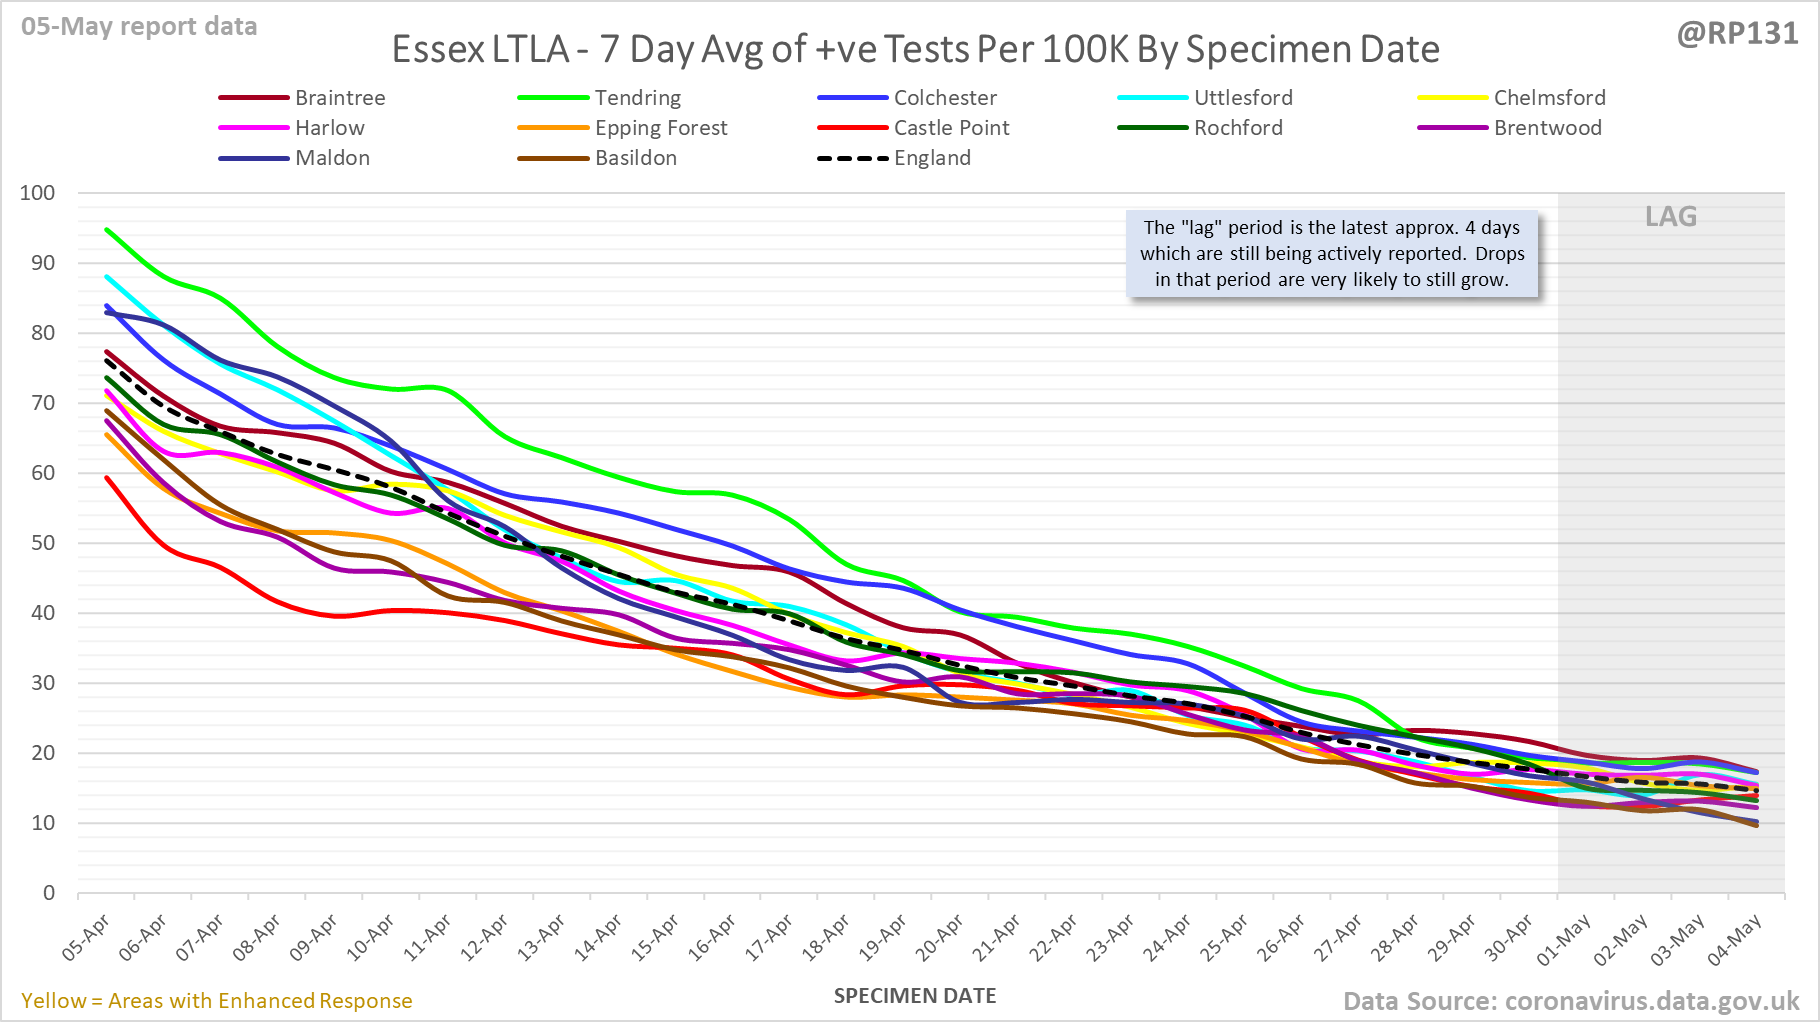
                [13/23] By request, focus on inner authorities of Lancashire, Manchester, Liverpool and Essex:


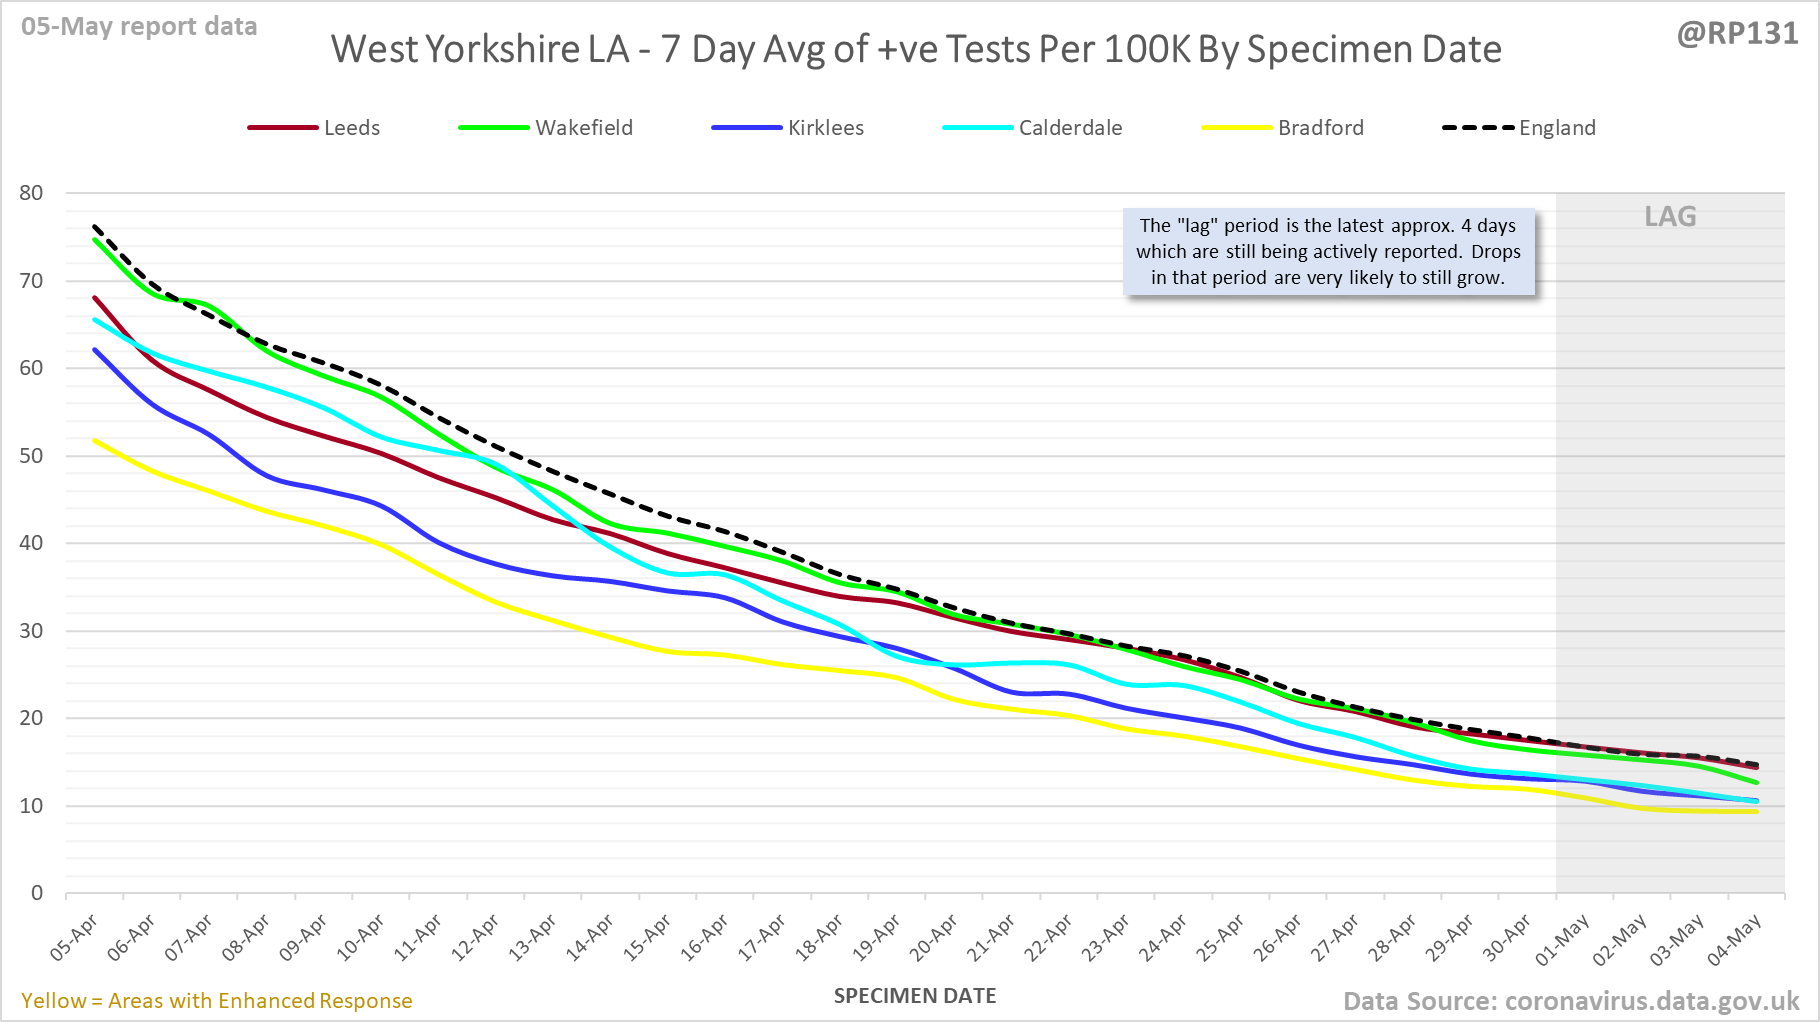
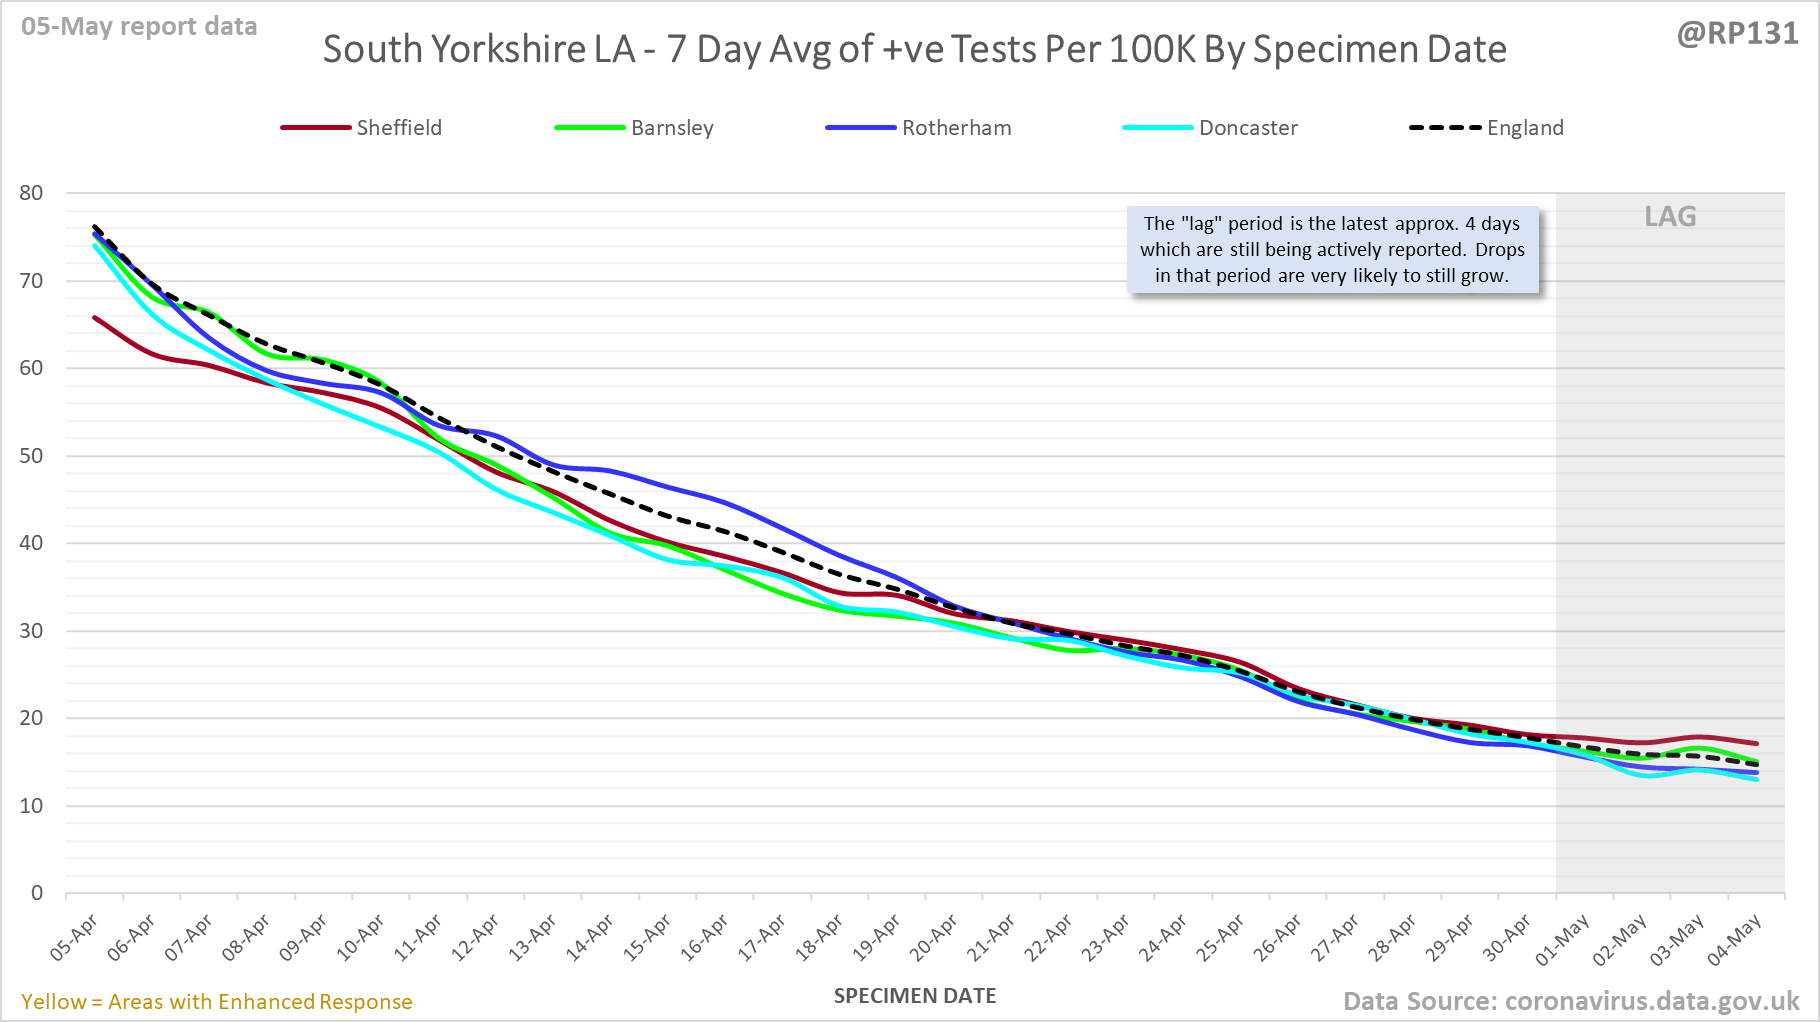
                [14/23] Also, West Yorkshire and South Yorkshire:


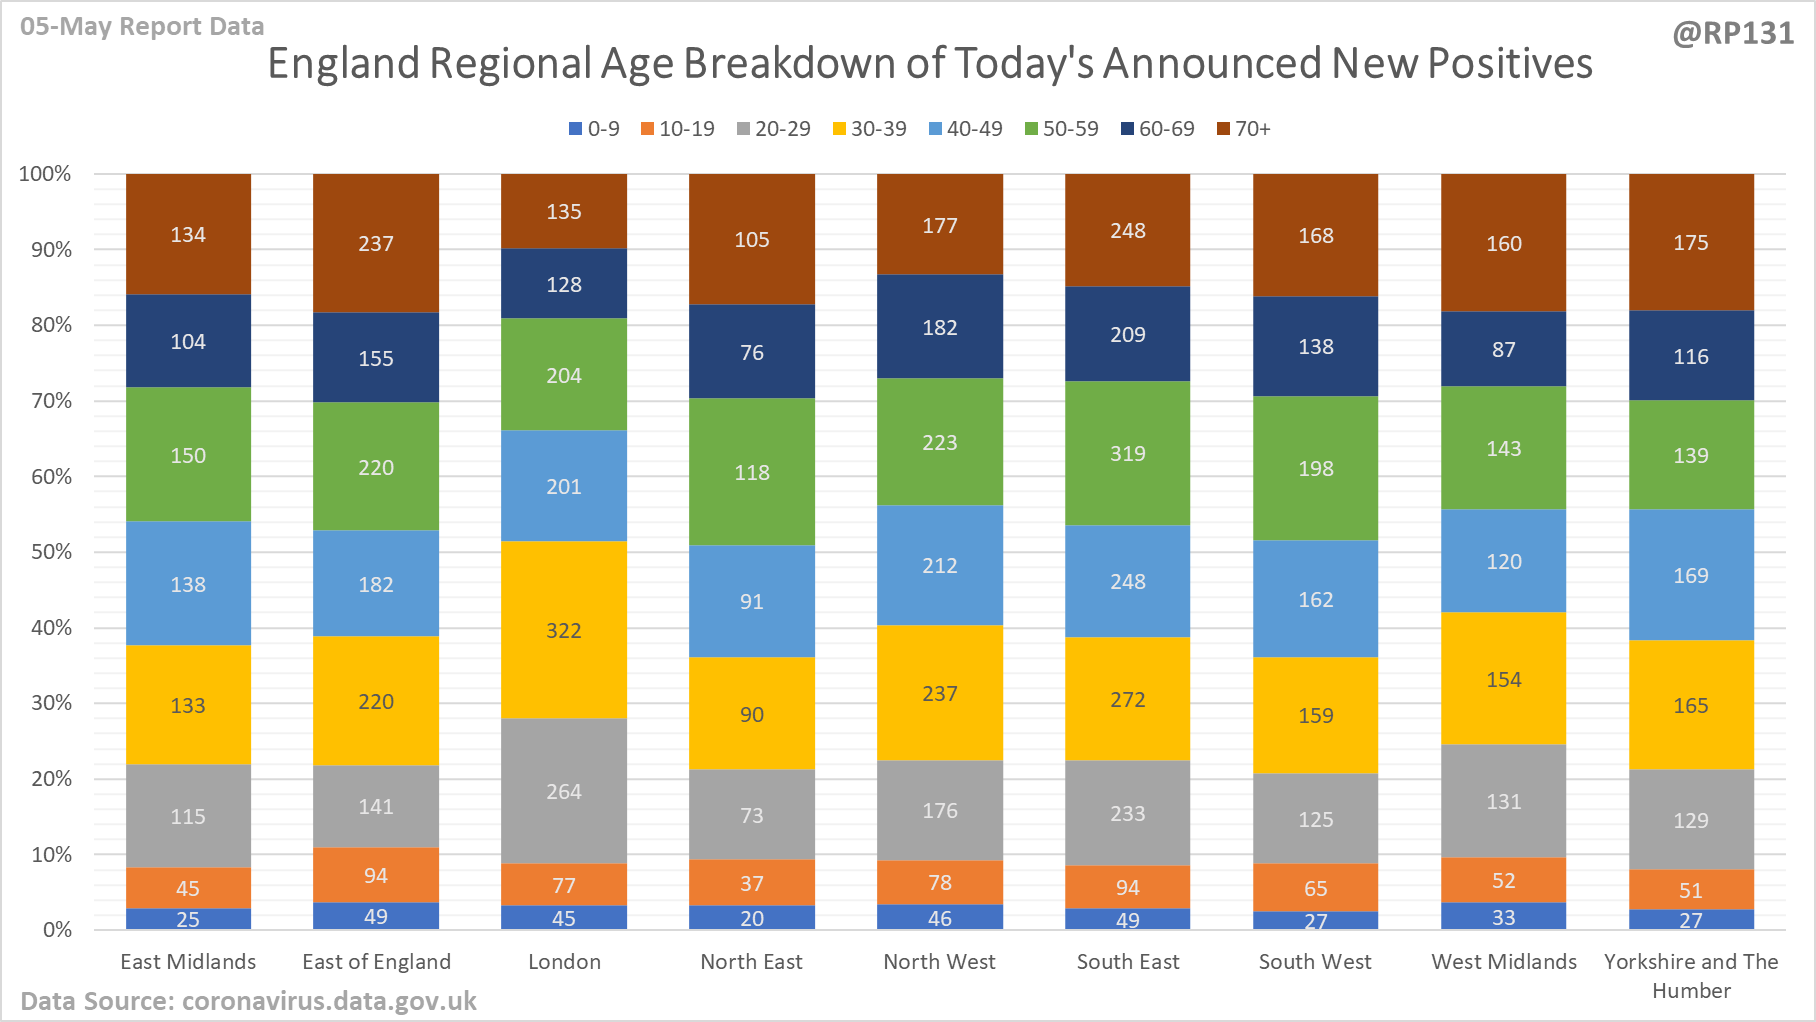
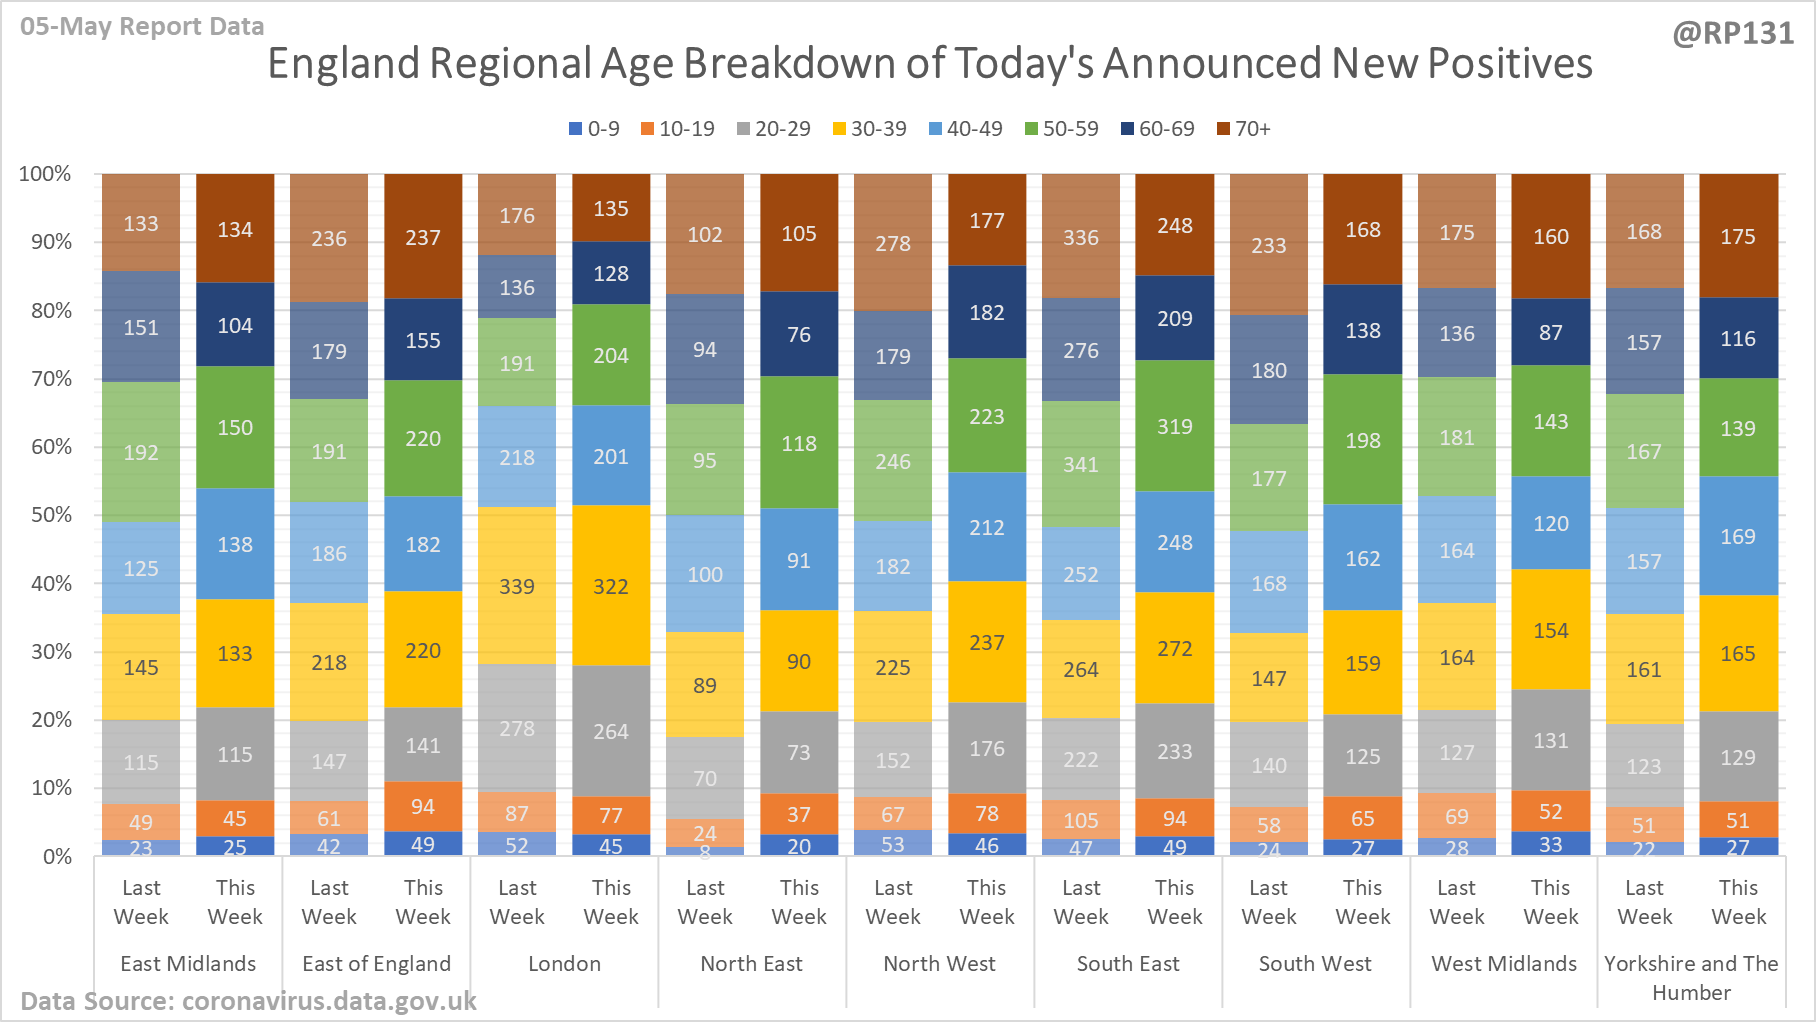
                [15/23] Regional / age distribution of today's newly announced positives for England.


                [16/23] Plus to see how it's shifting, here's the same values but with the same day last week for comparison:


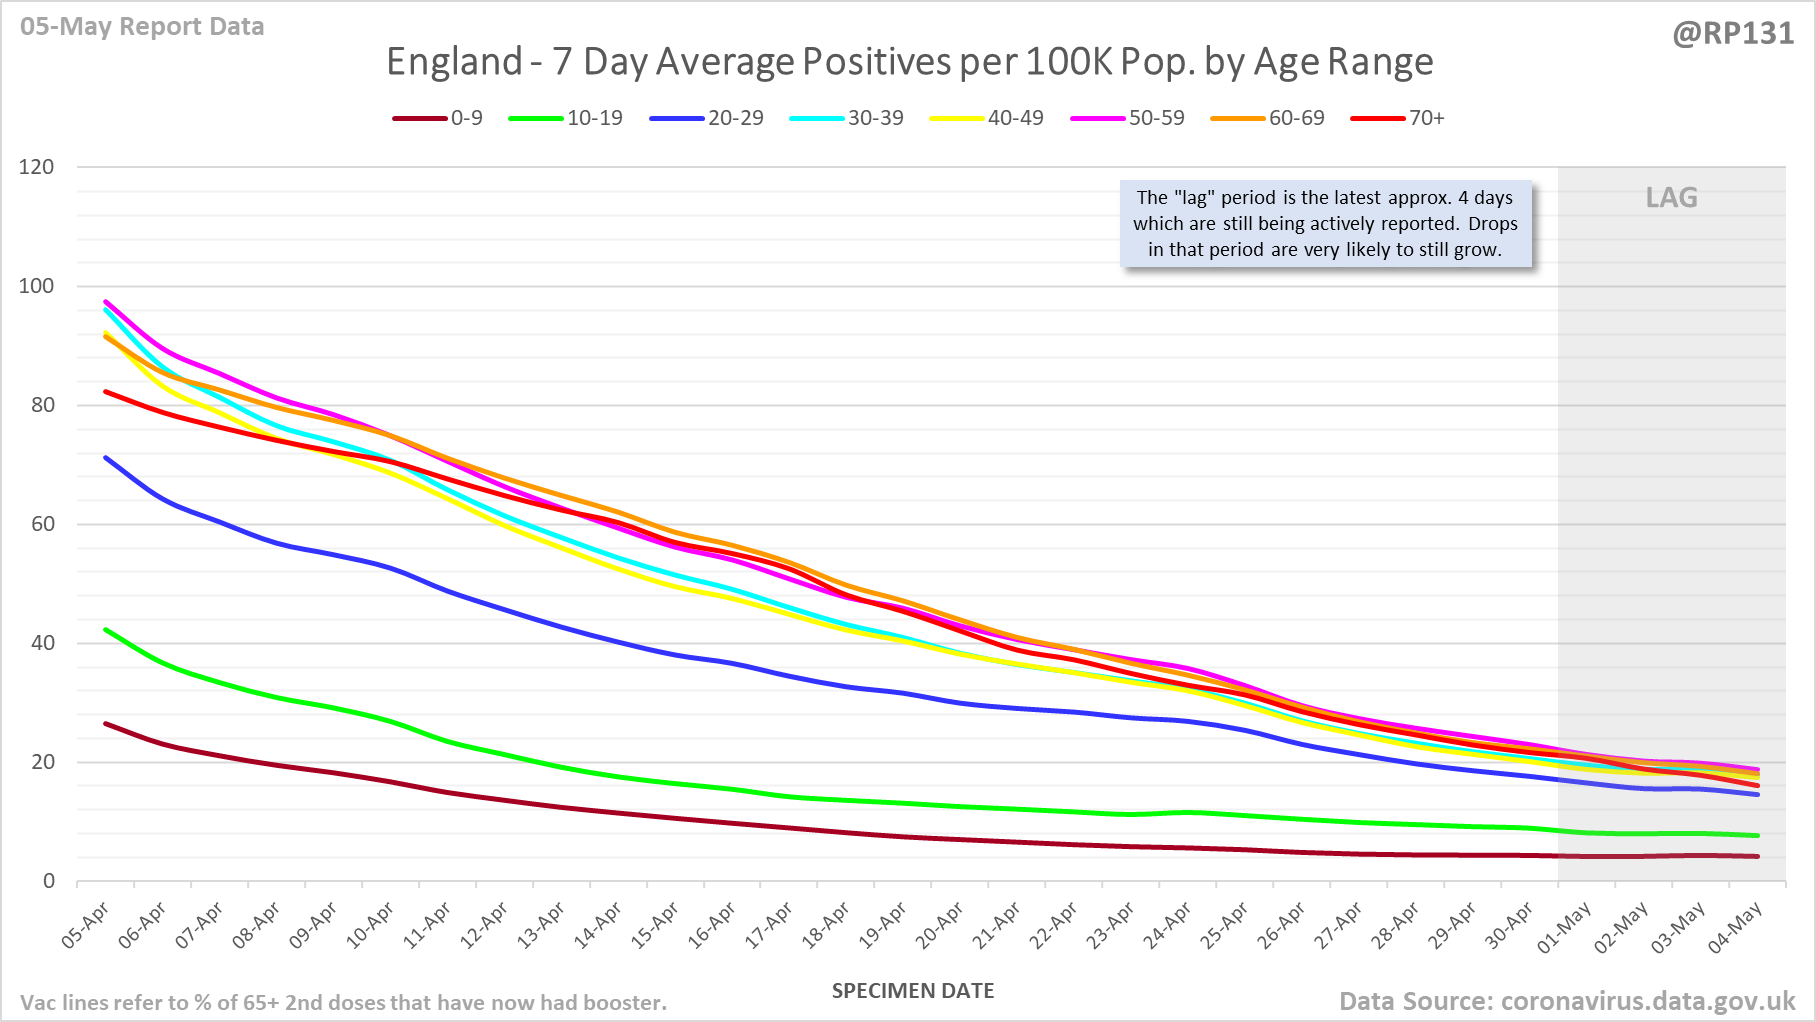
                [17/23] England rolling average positives (per 100K population) by age range:


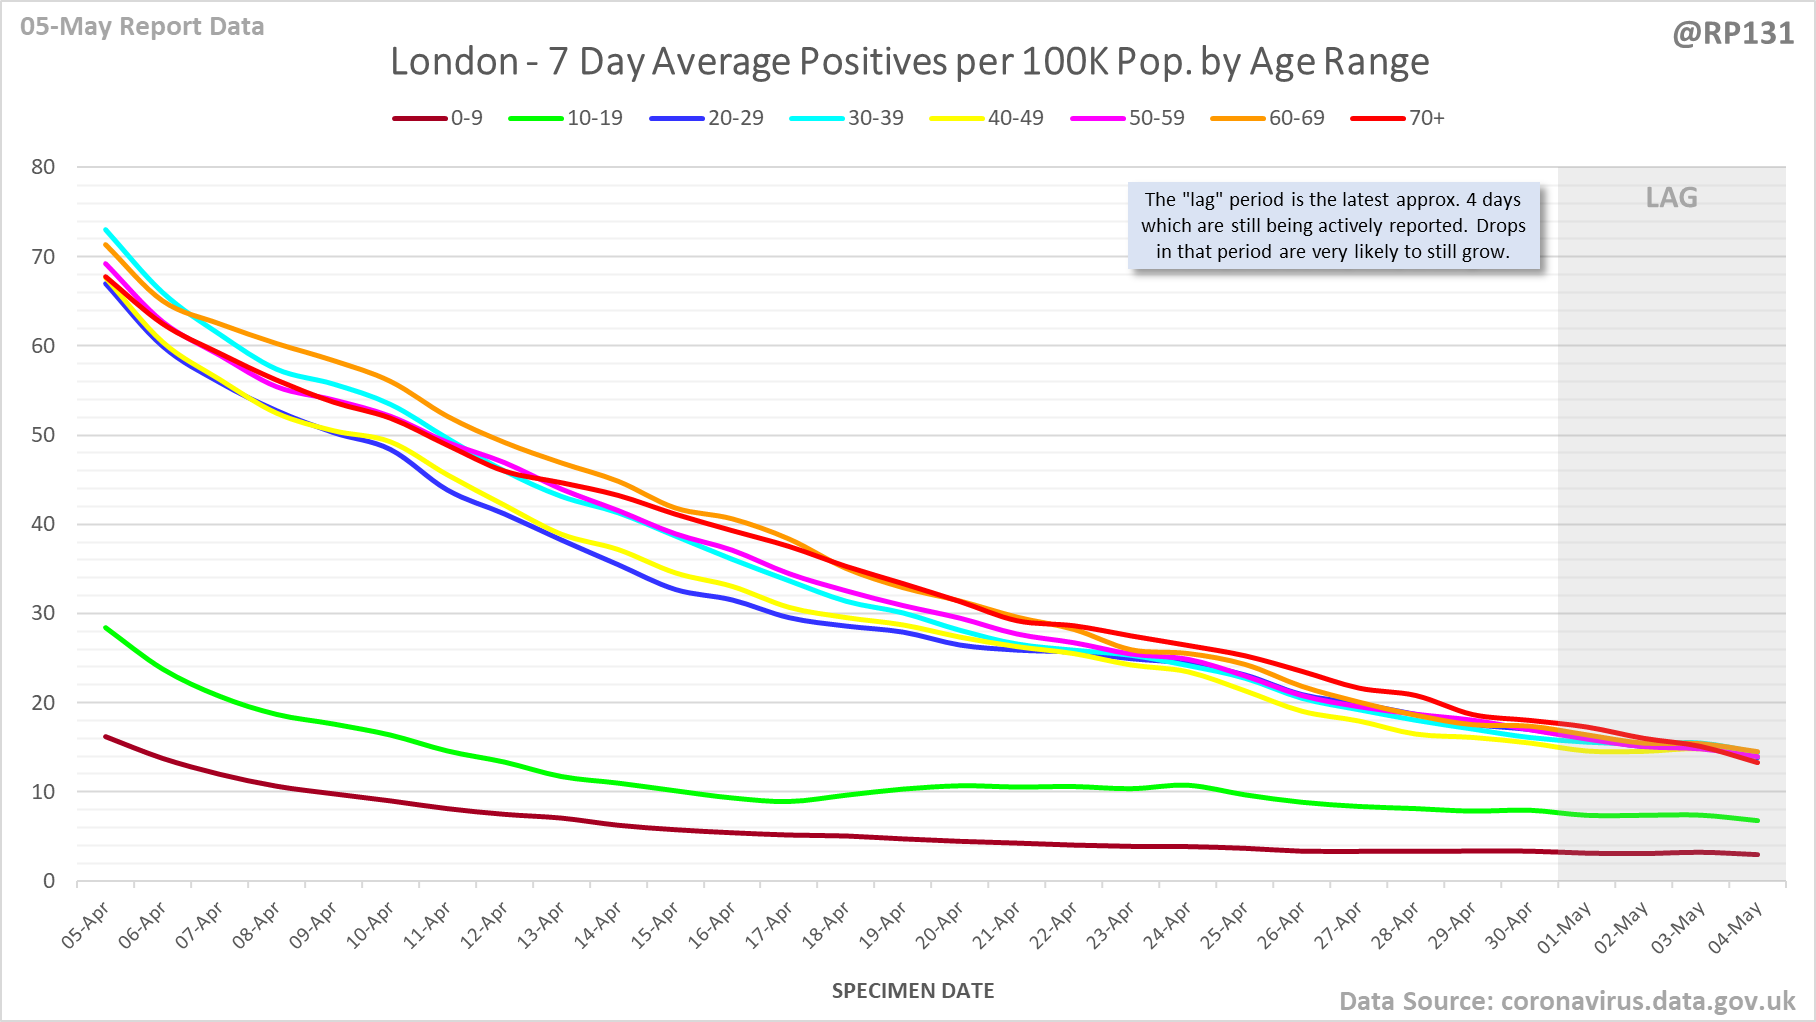
                [18/23] London rolling average positives (per 100K population) by age range:


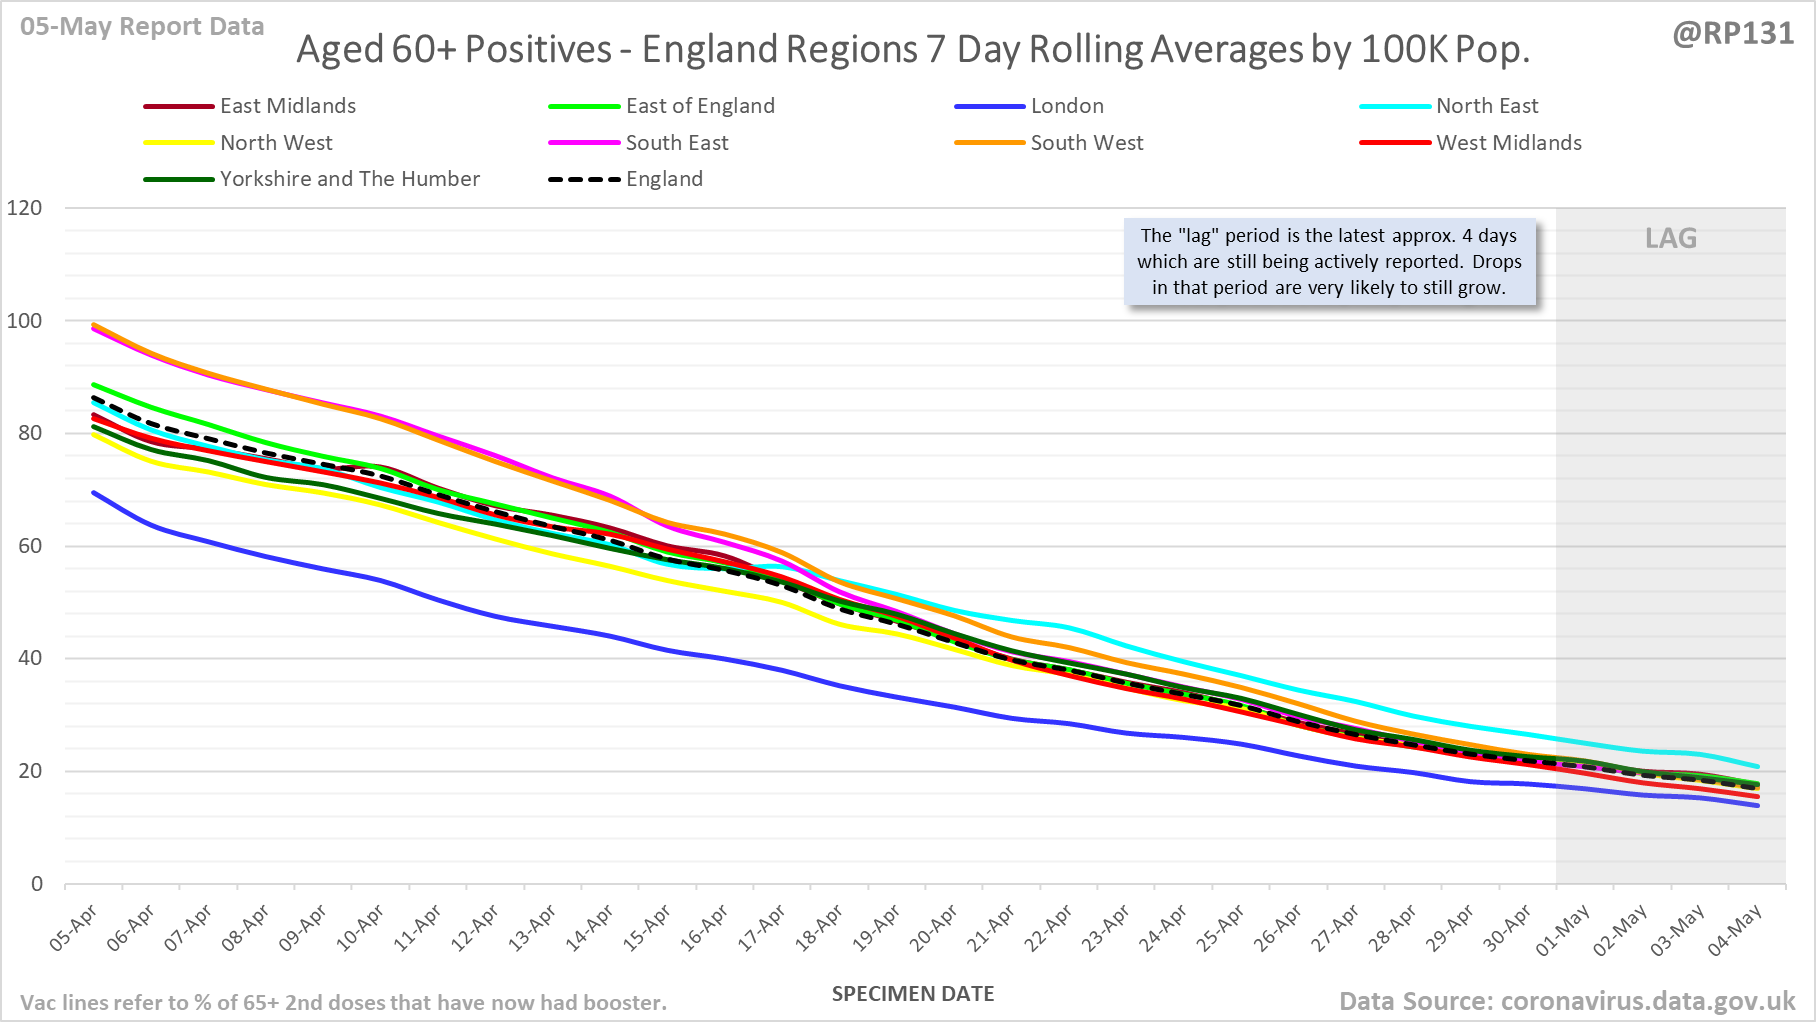
                [19/23] England regional rolling average positives (per 100K population) in the 60+ age range:


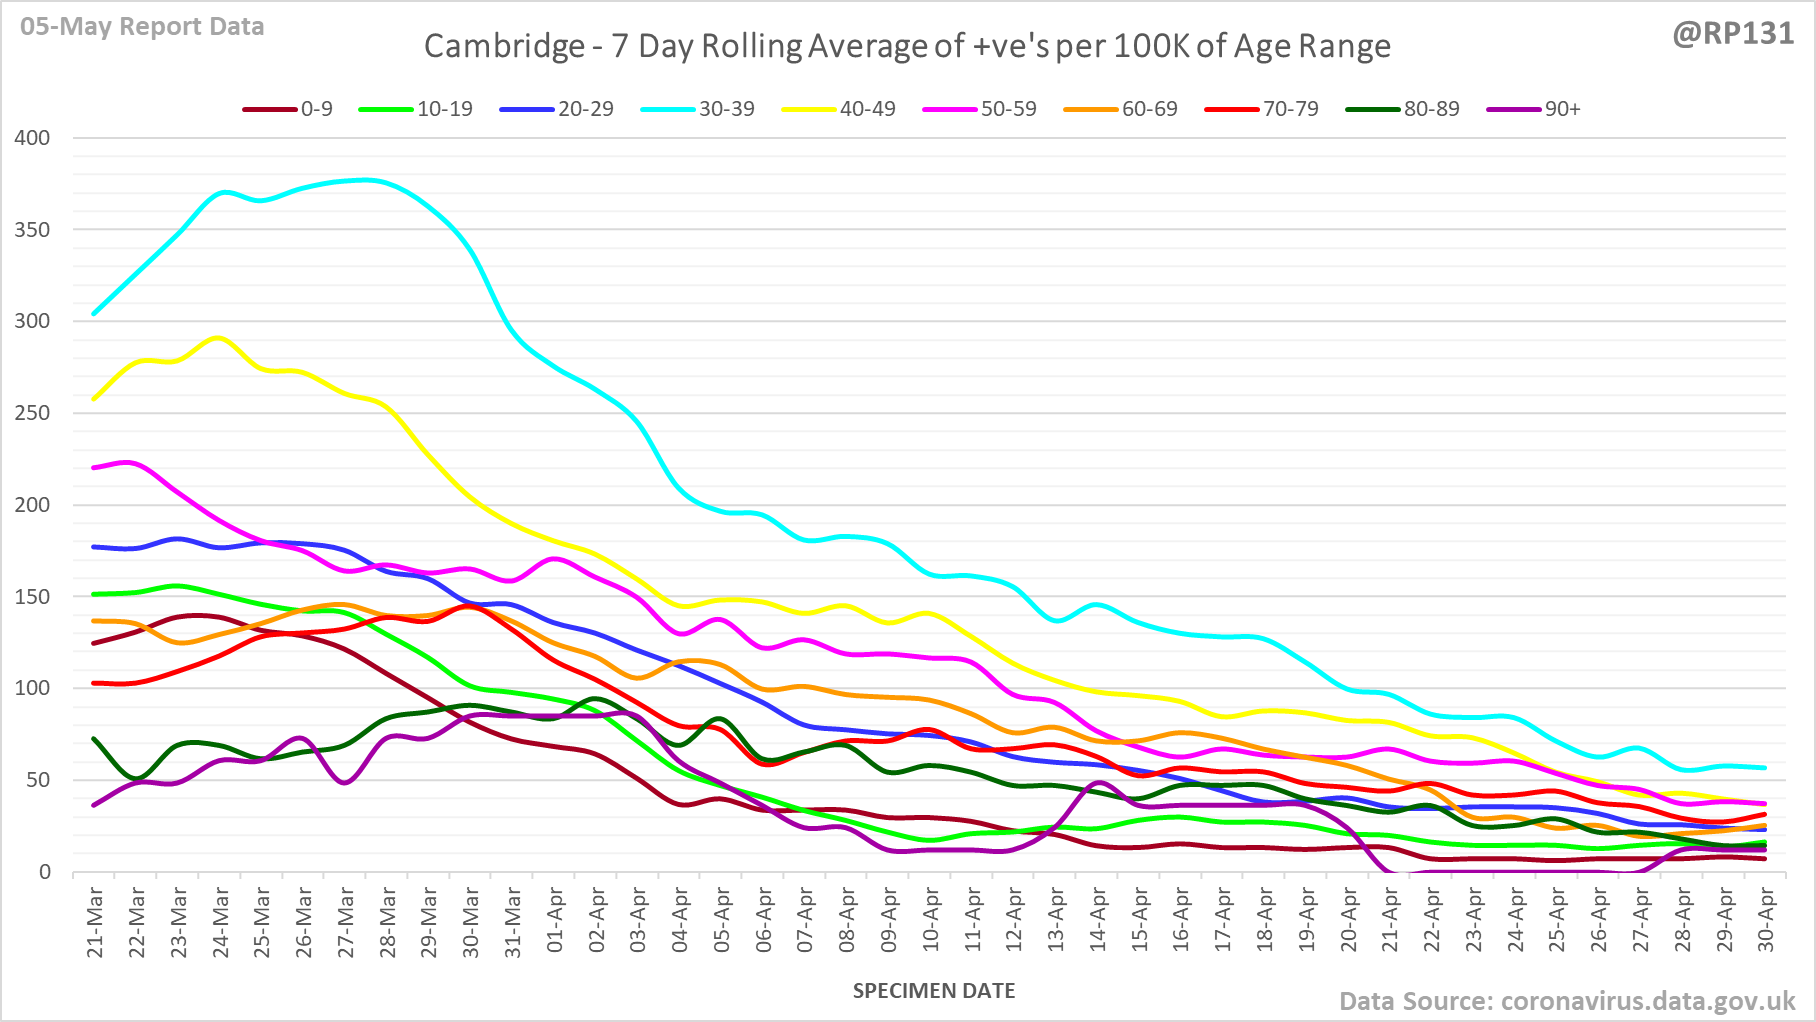
                [20/23] Age breakdown chart for Cambridge (current top LA). Rolling average of positive tests by specimen date per 100K population of each age range.


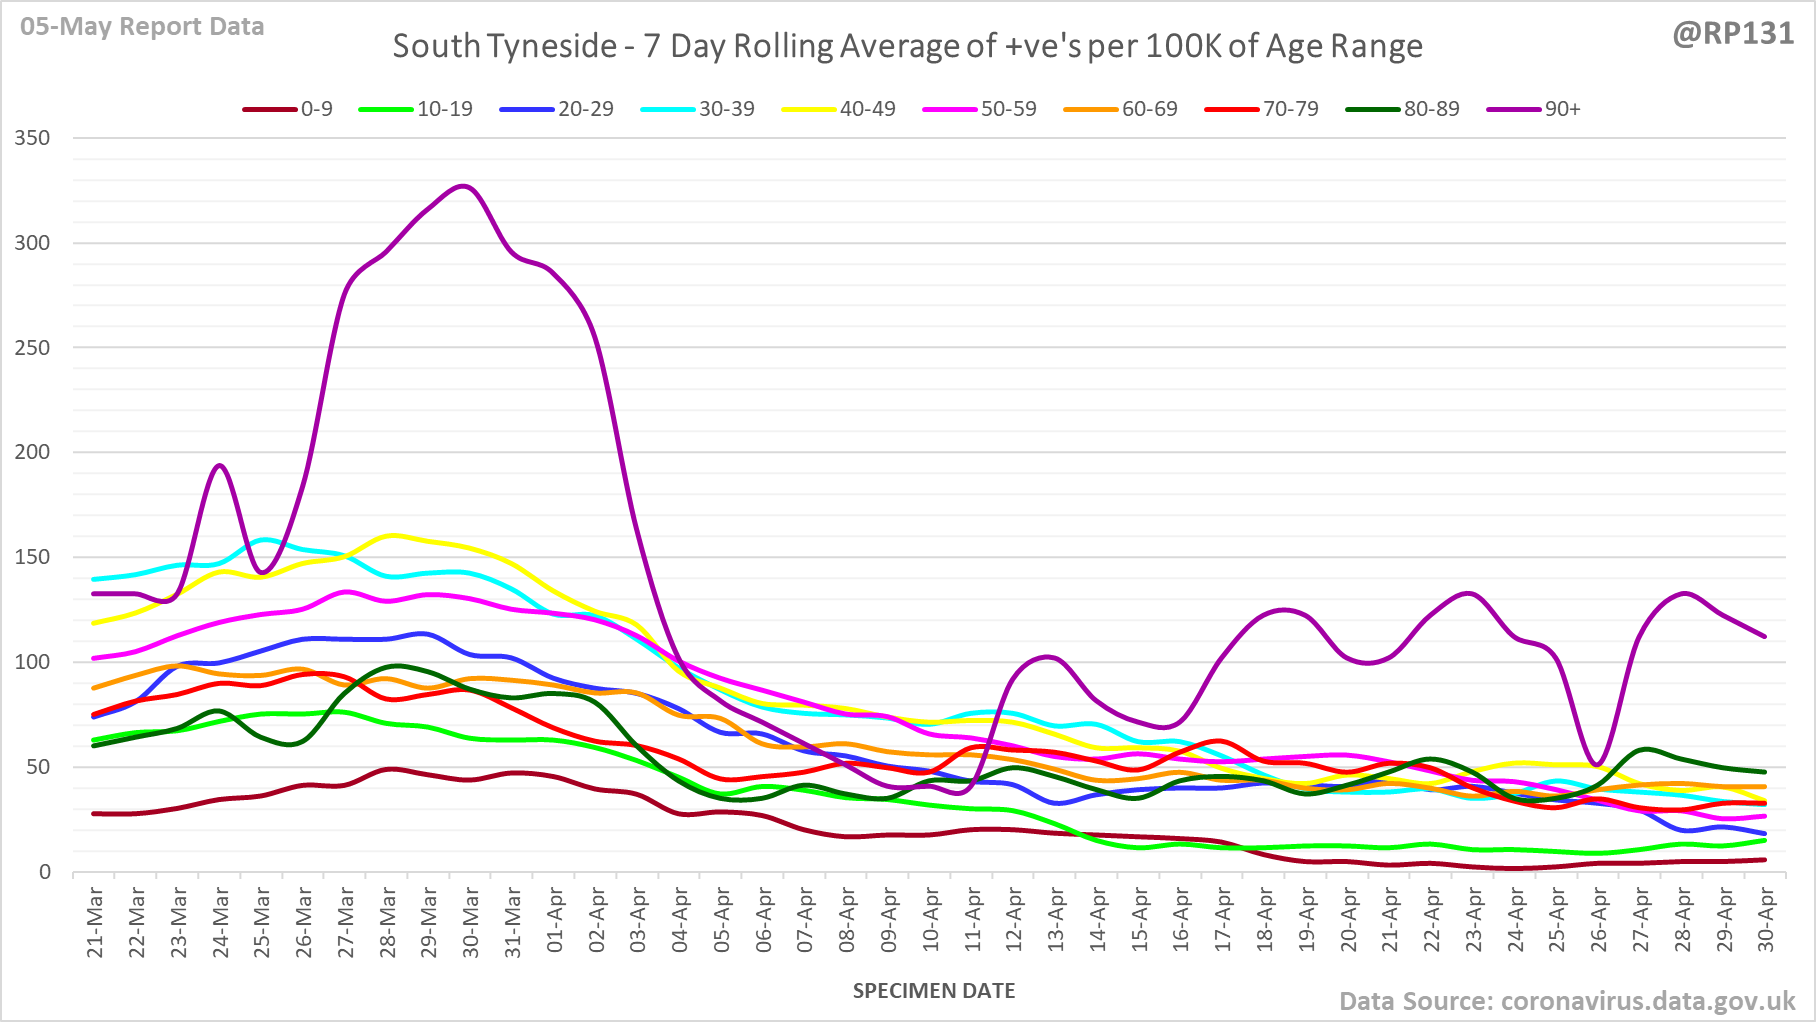
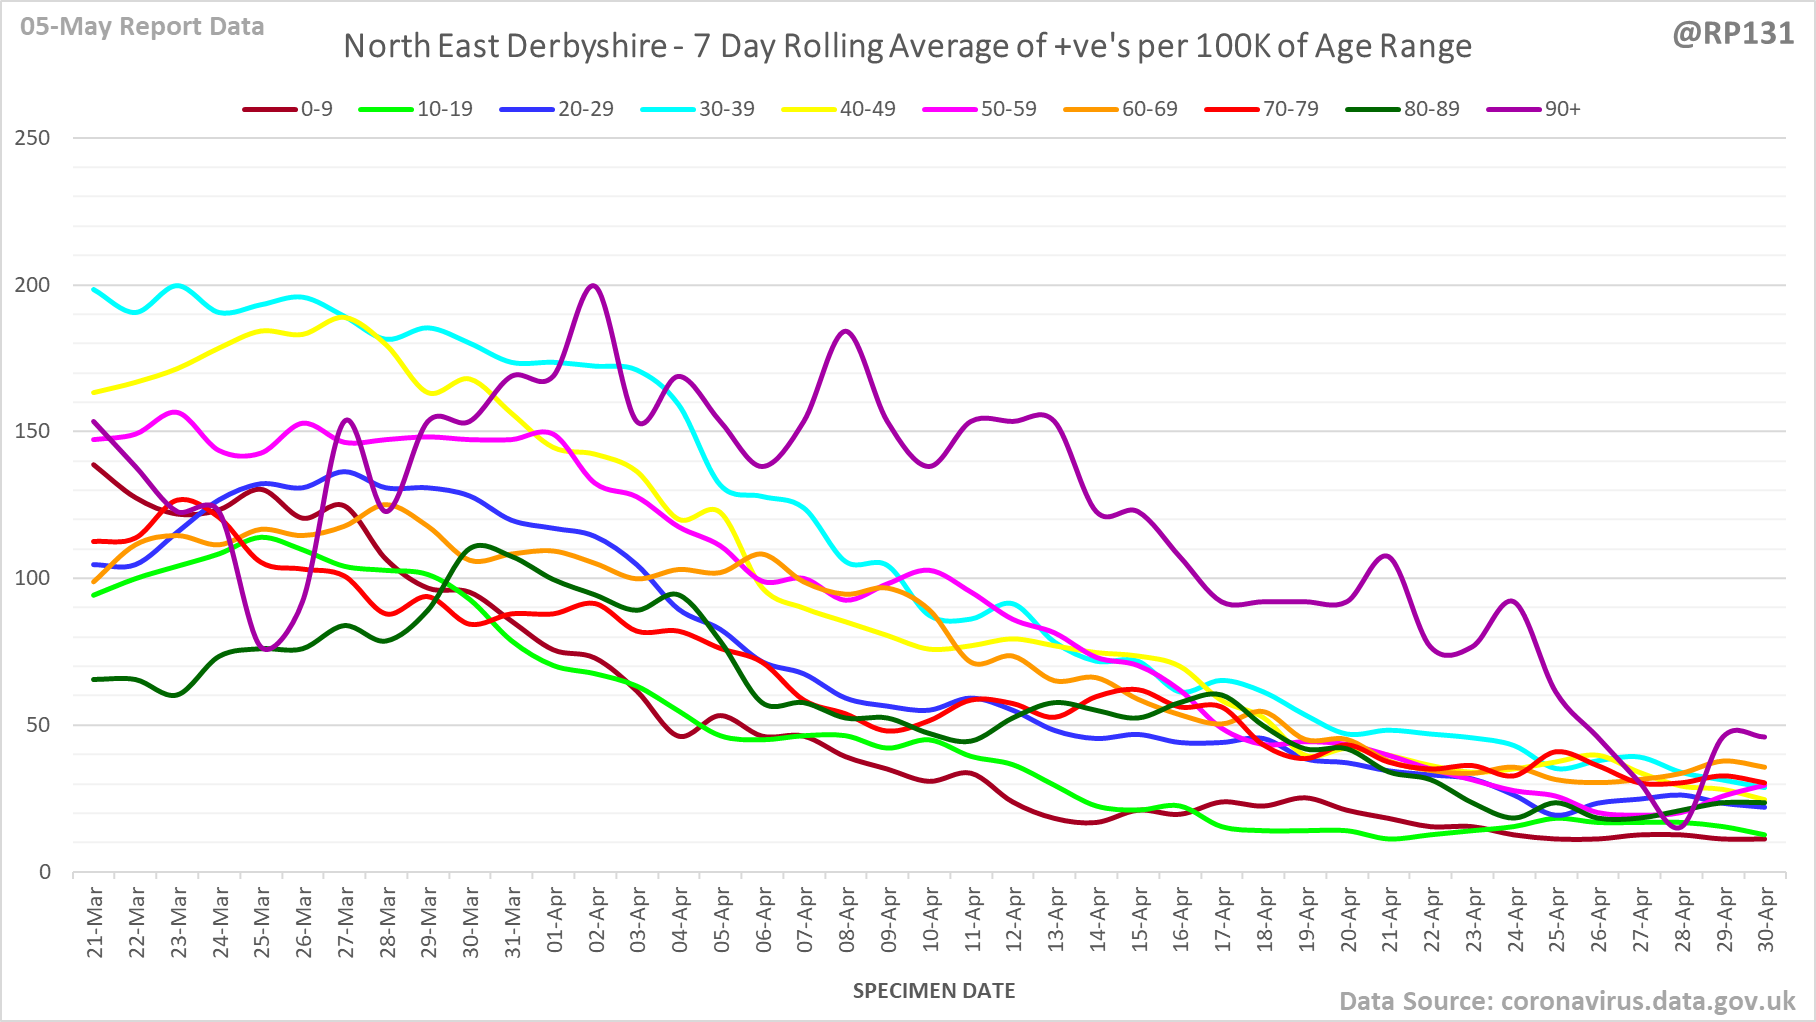
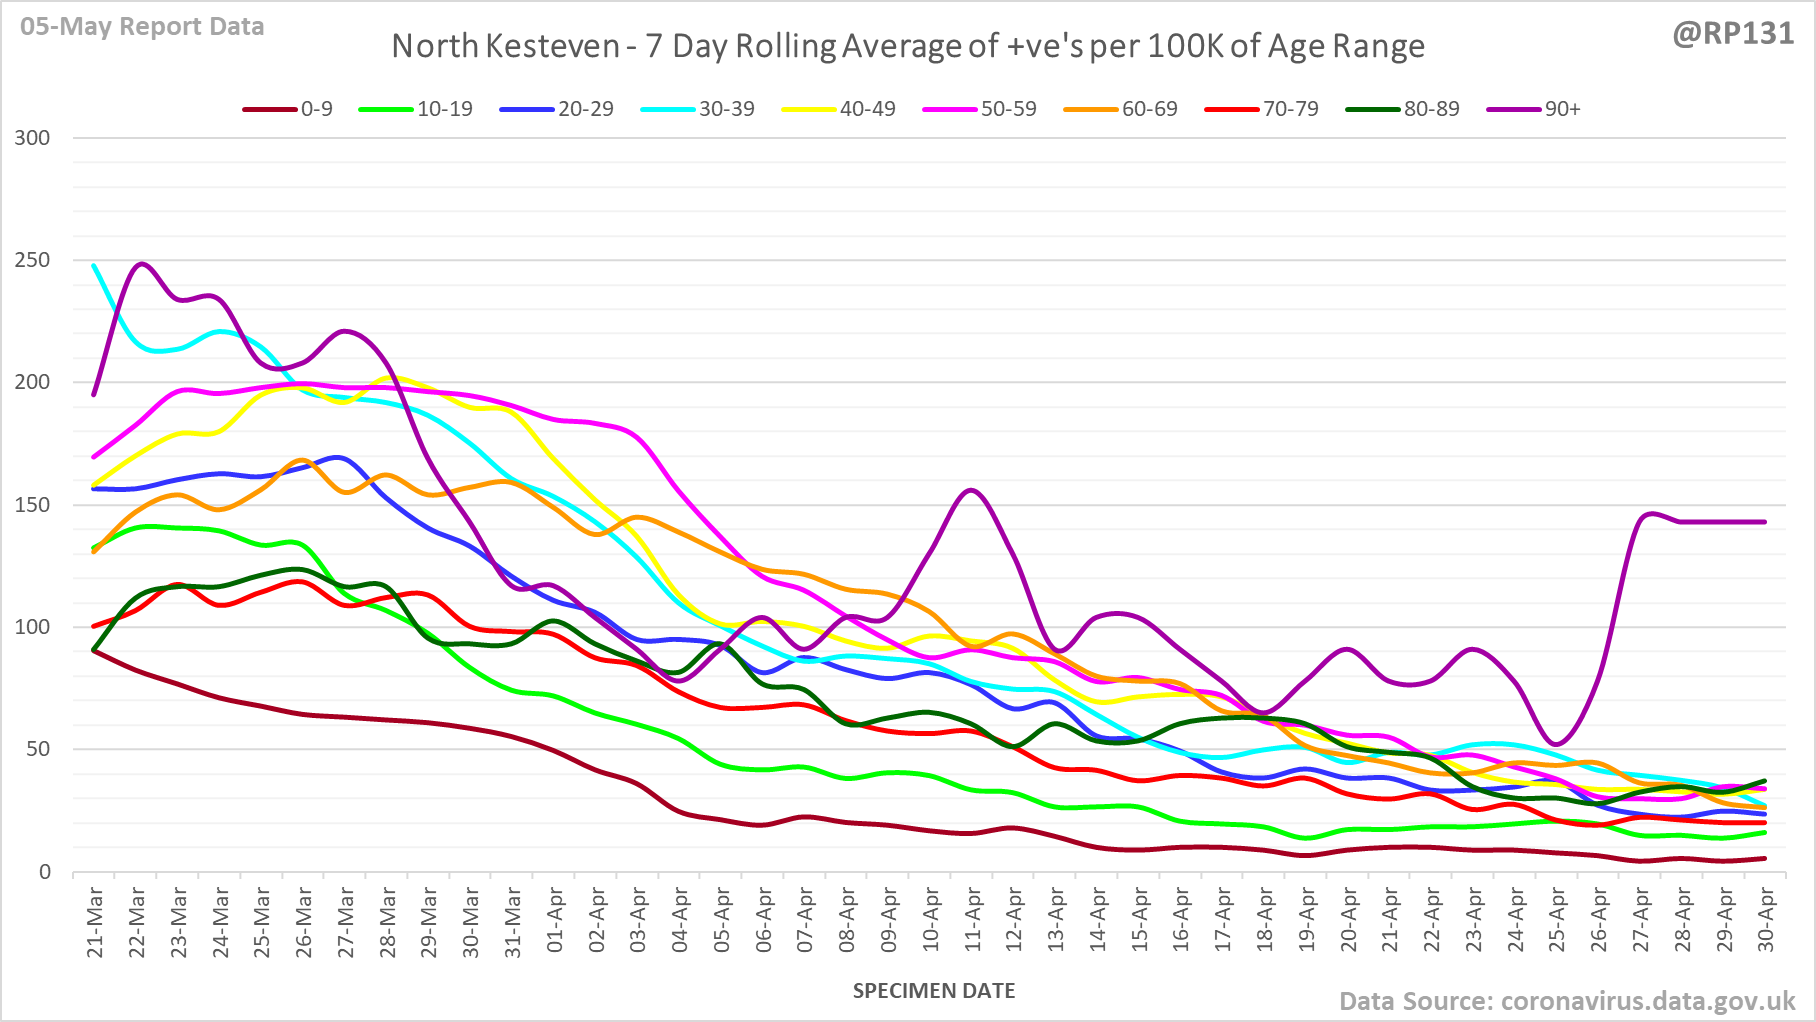
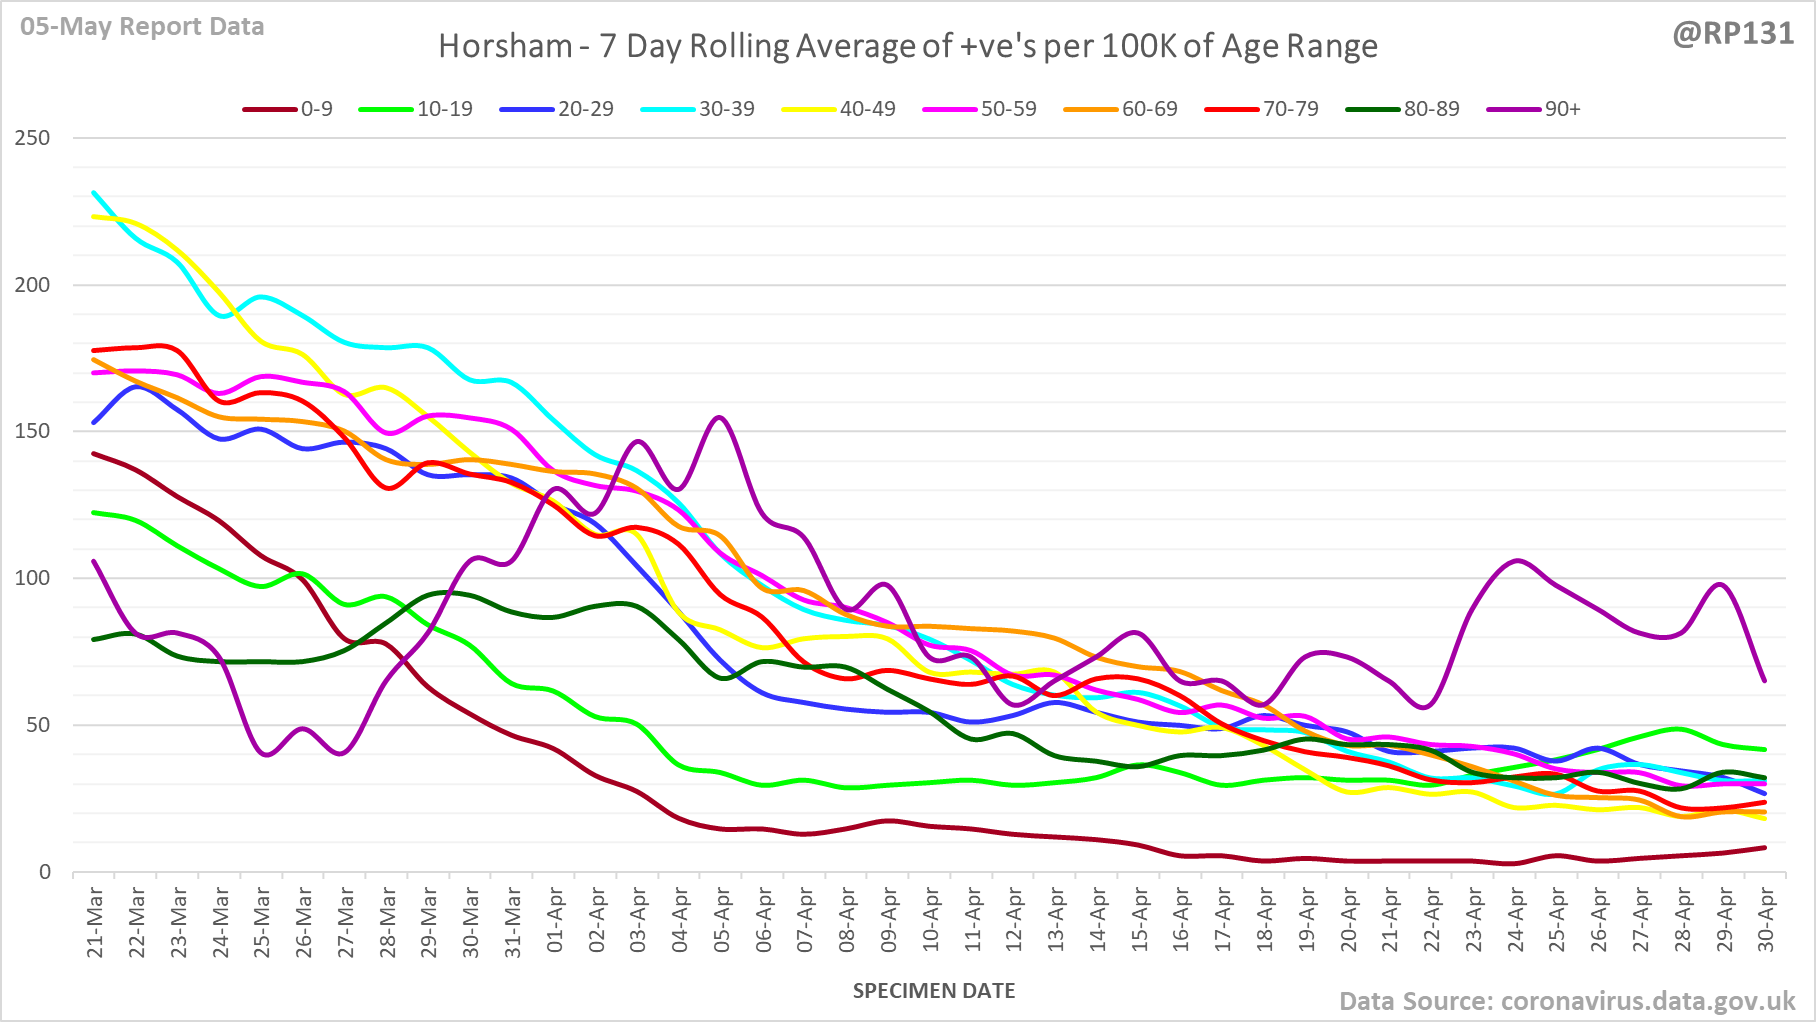
                [21/23] Also age breakdown charts for rest of top 5: South Tyneside, North East Derbyshire, North Kesteven and Horsham.
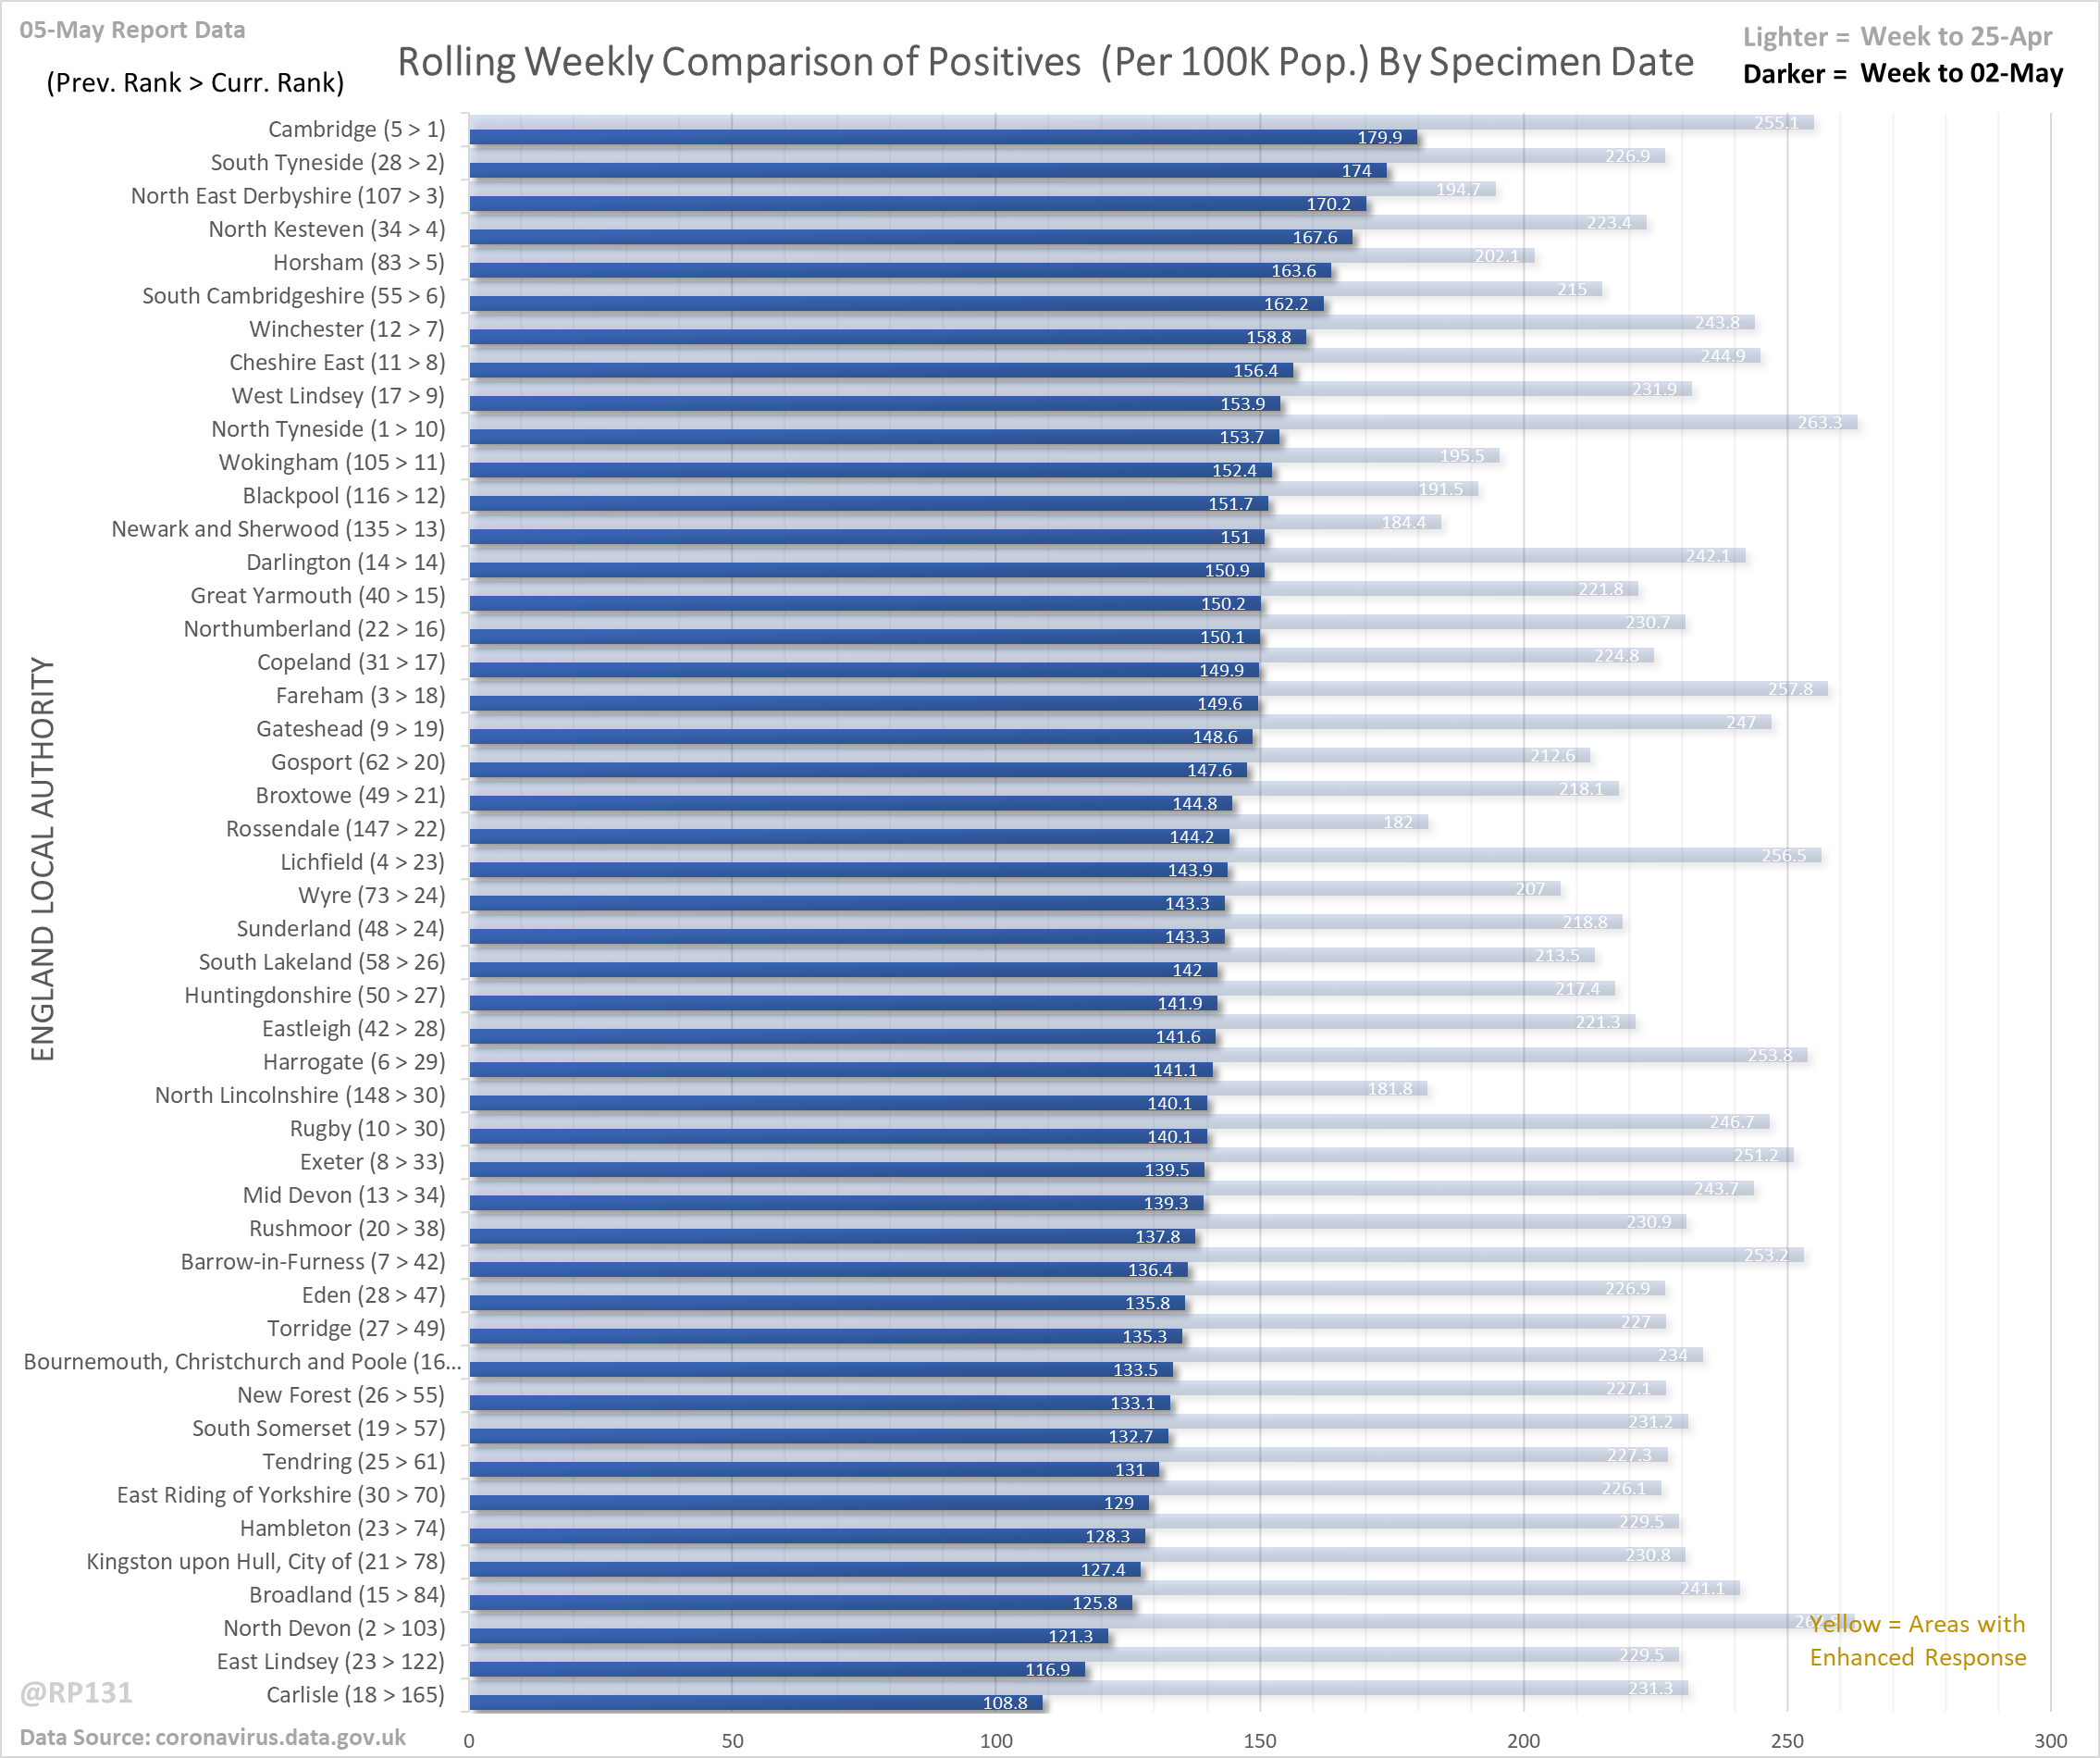


                [22/23] Rolling weekly comparison of totals up to 3 days ago. This chart is useful to see the relative movements of the local authorities towards the top of the list.


    Please feel free to use / share this content however you wish. Some form of link back to my twitter would be
        appreciated (e.g. mention me if posting on twitter).