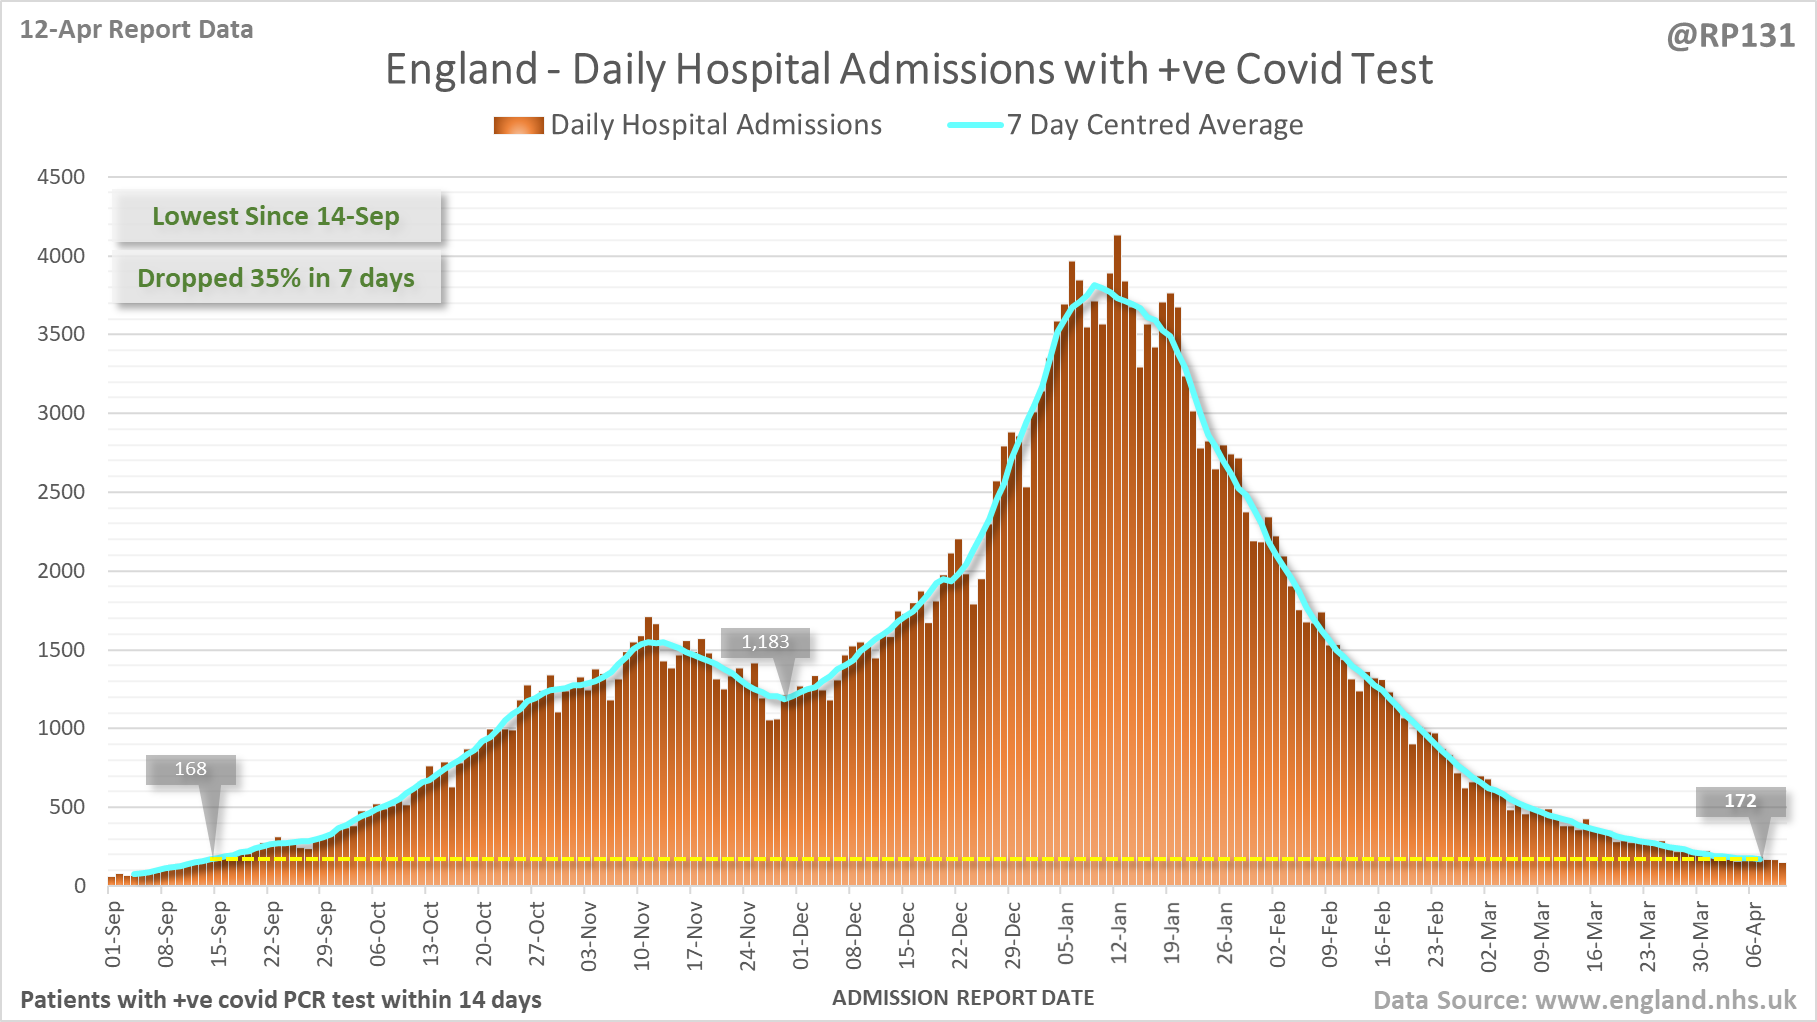
[1/20] Latest view on England covid hospital admissions (as of 12-Apr) with 151 reported for 10-Apr.
The 7 day average is now equivalent to around 14-Sep (i.e. 205 days ago).
The 7 day average is now equivalent to around 14-Sep (i.e. 205 days ago).
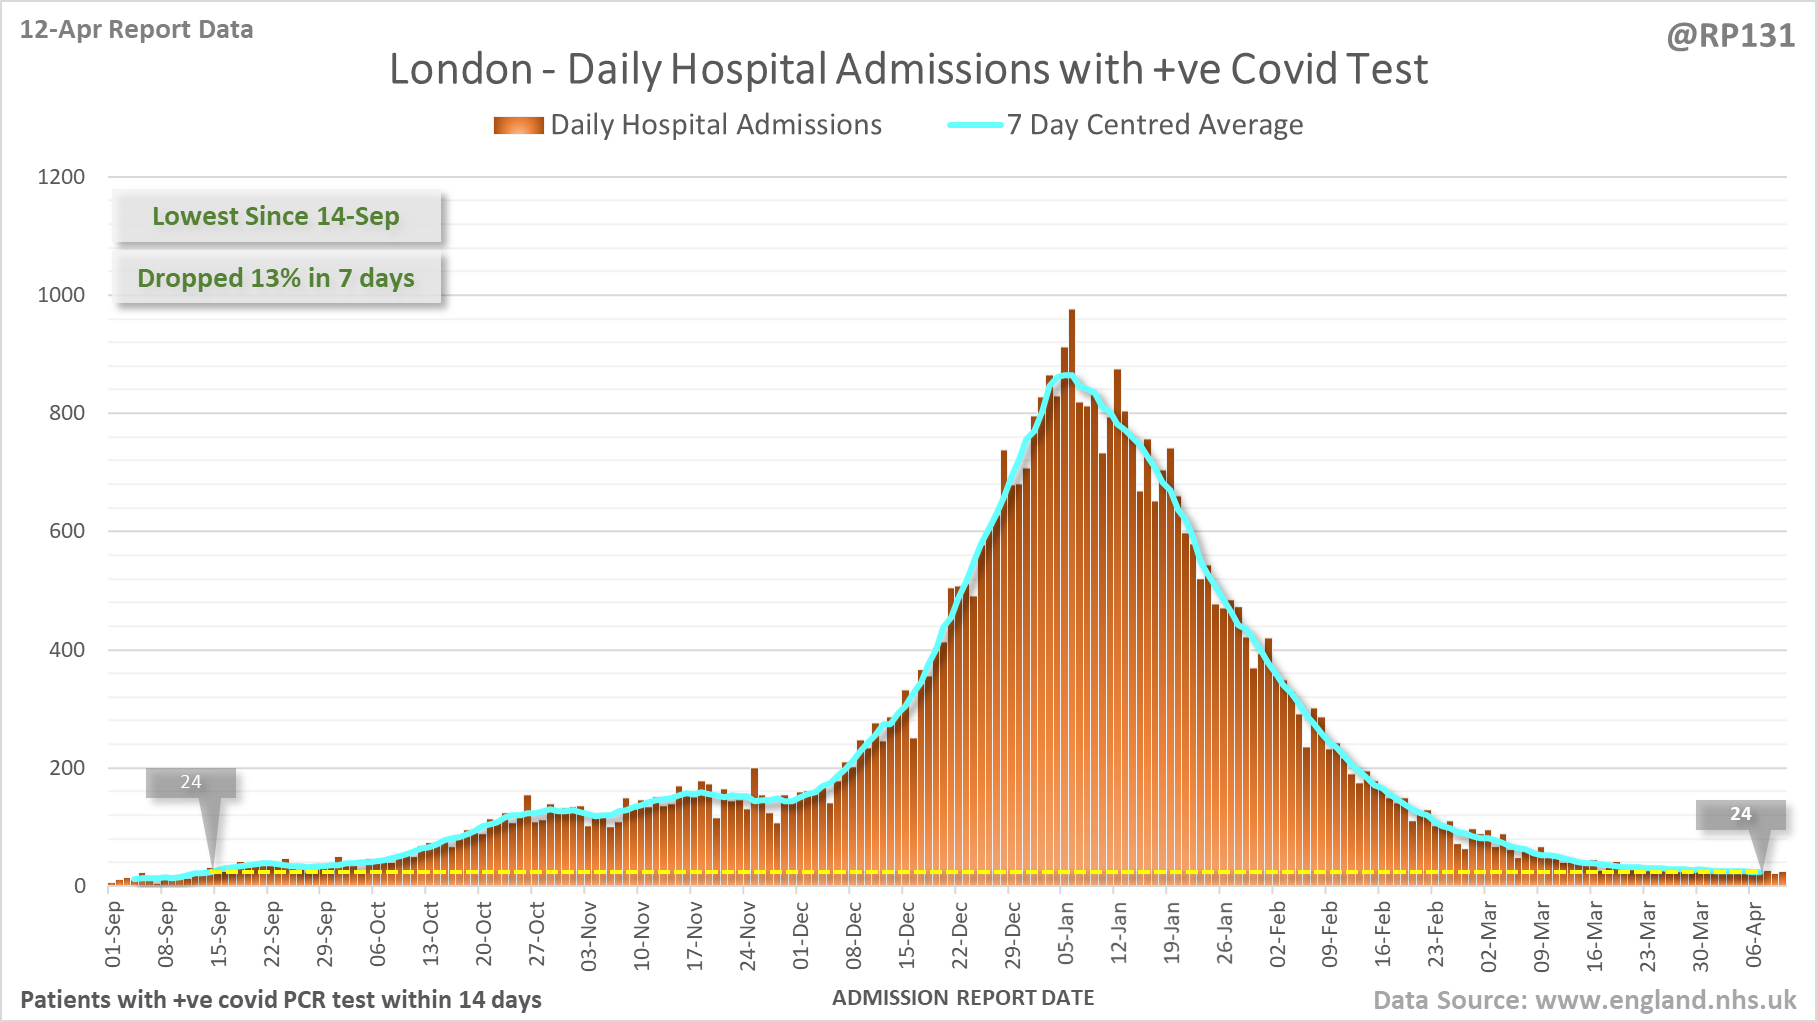
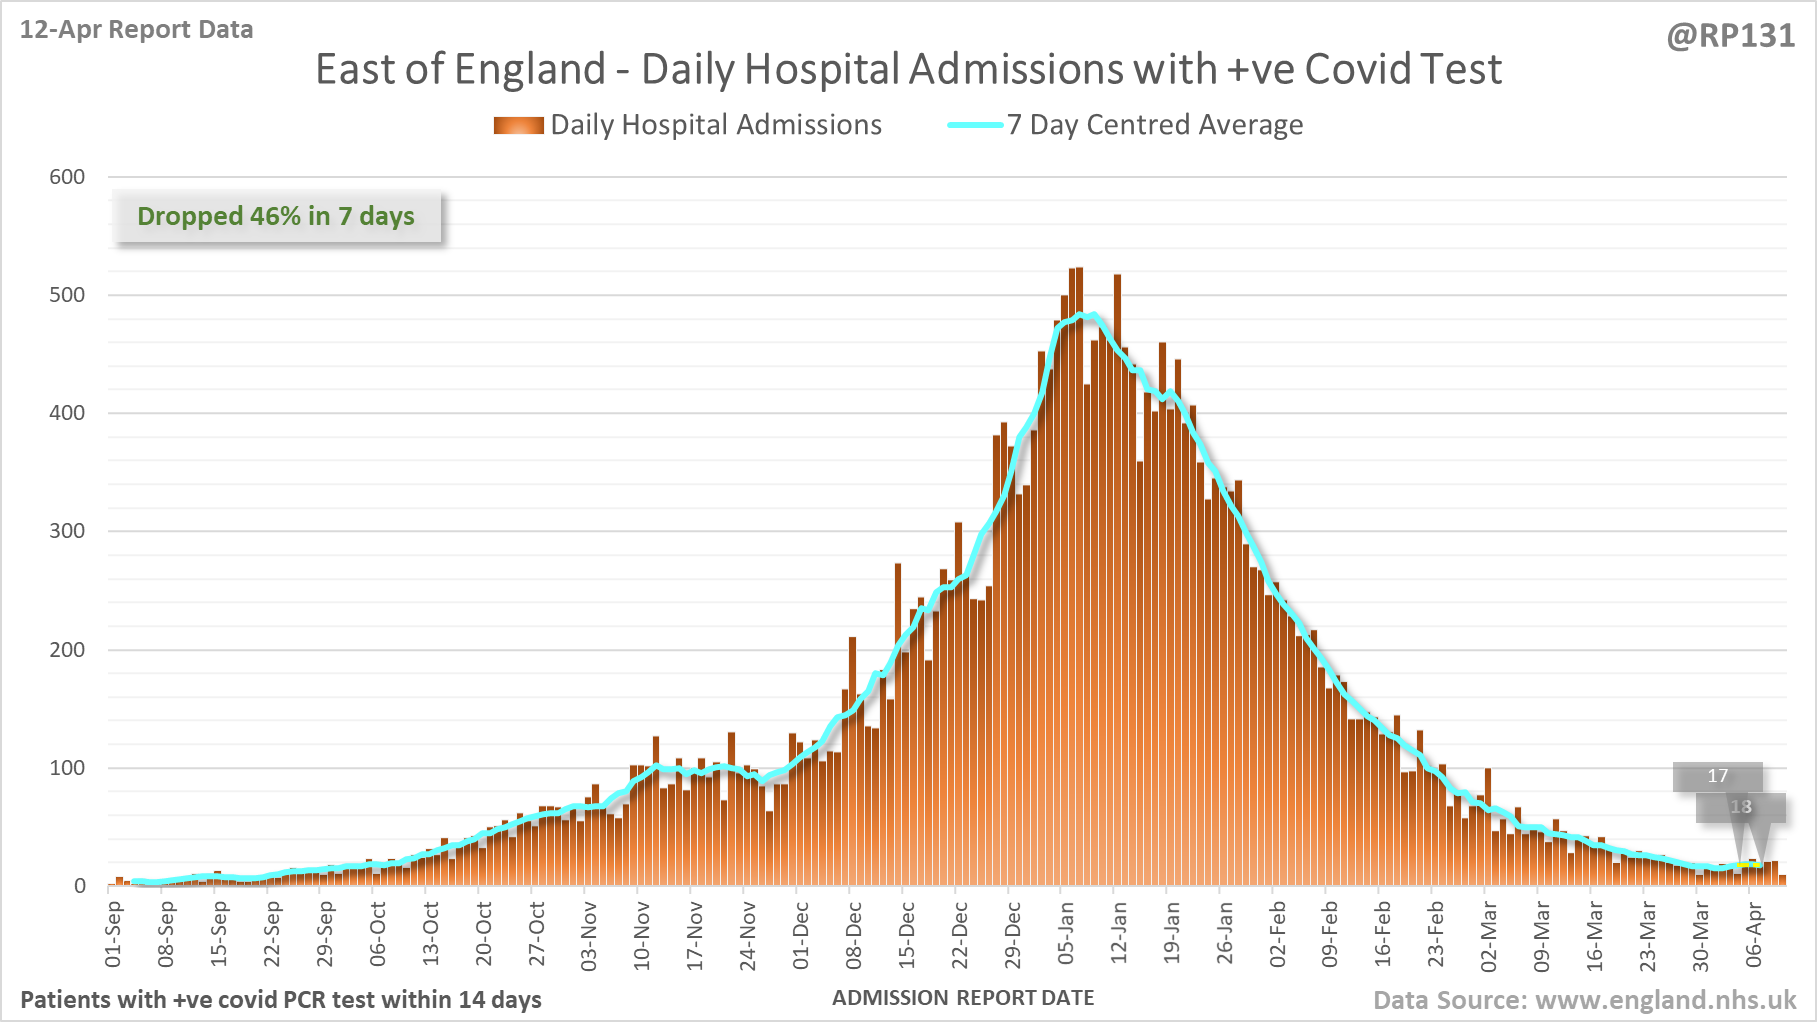
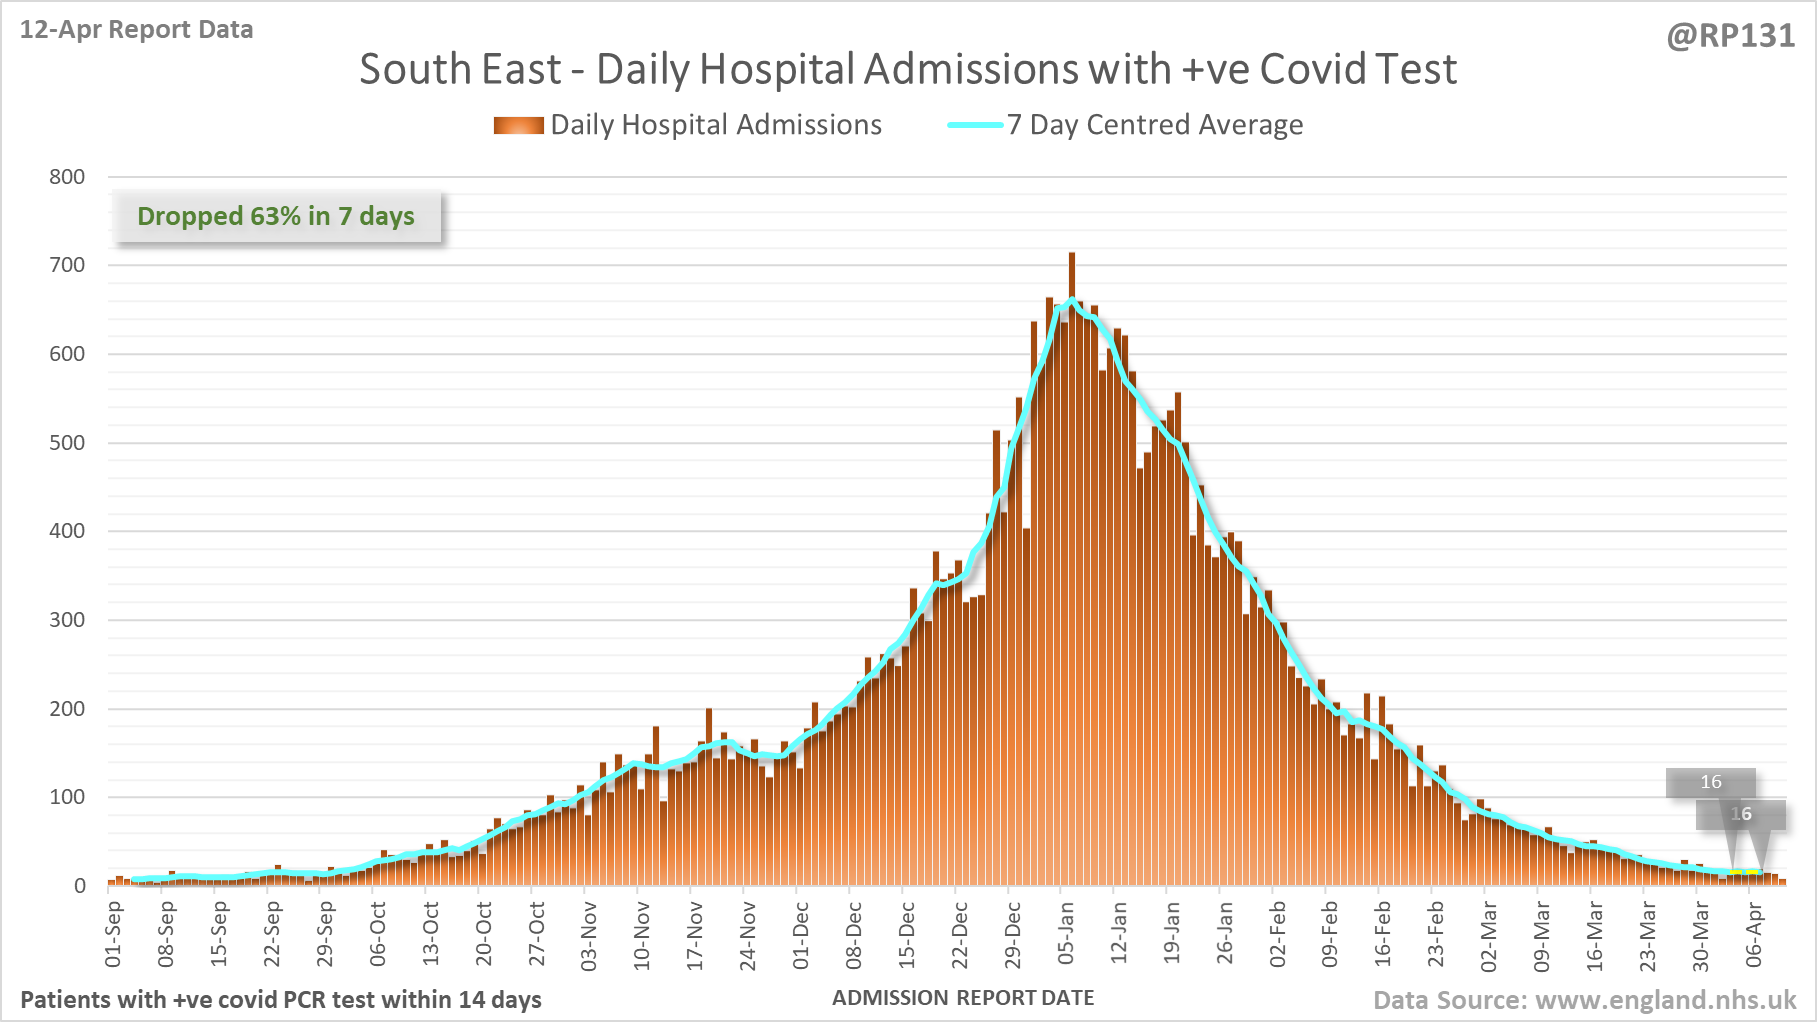
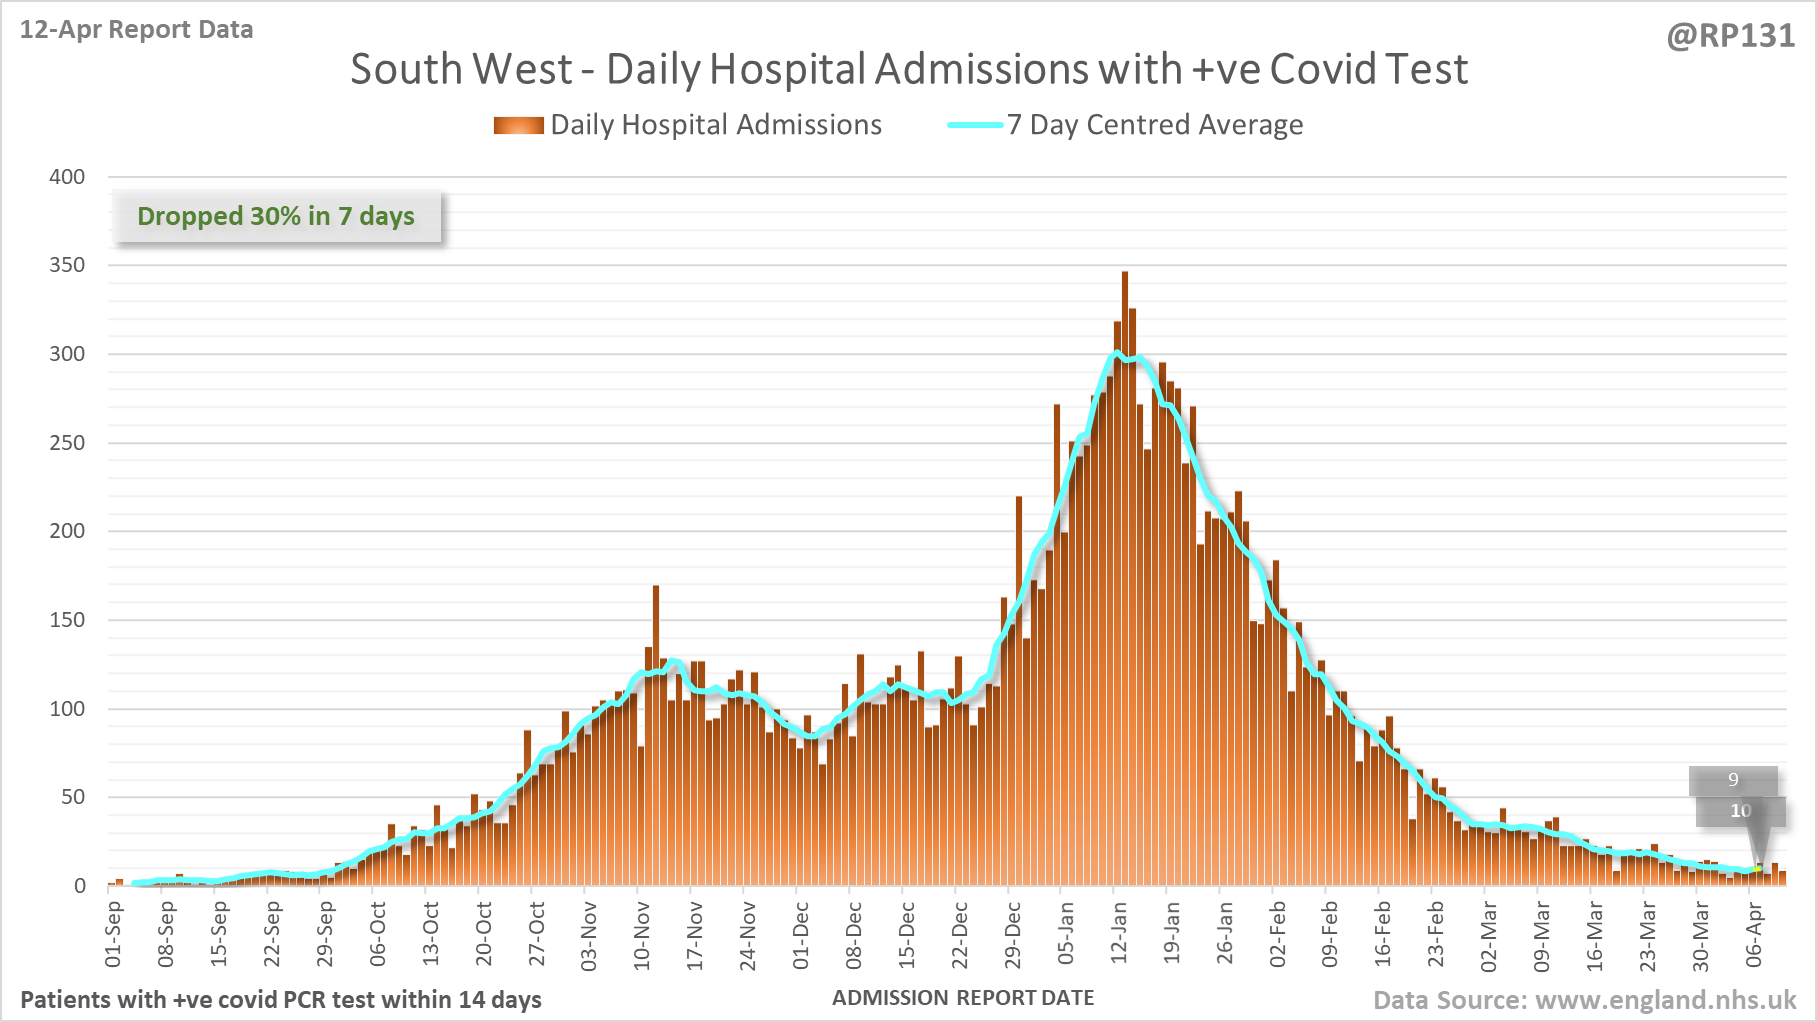
[2/20] Hospital admission charts for London, East of England, South East and South West. Note the different scales.
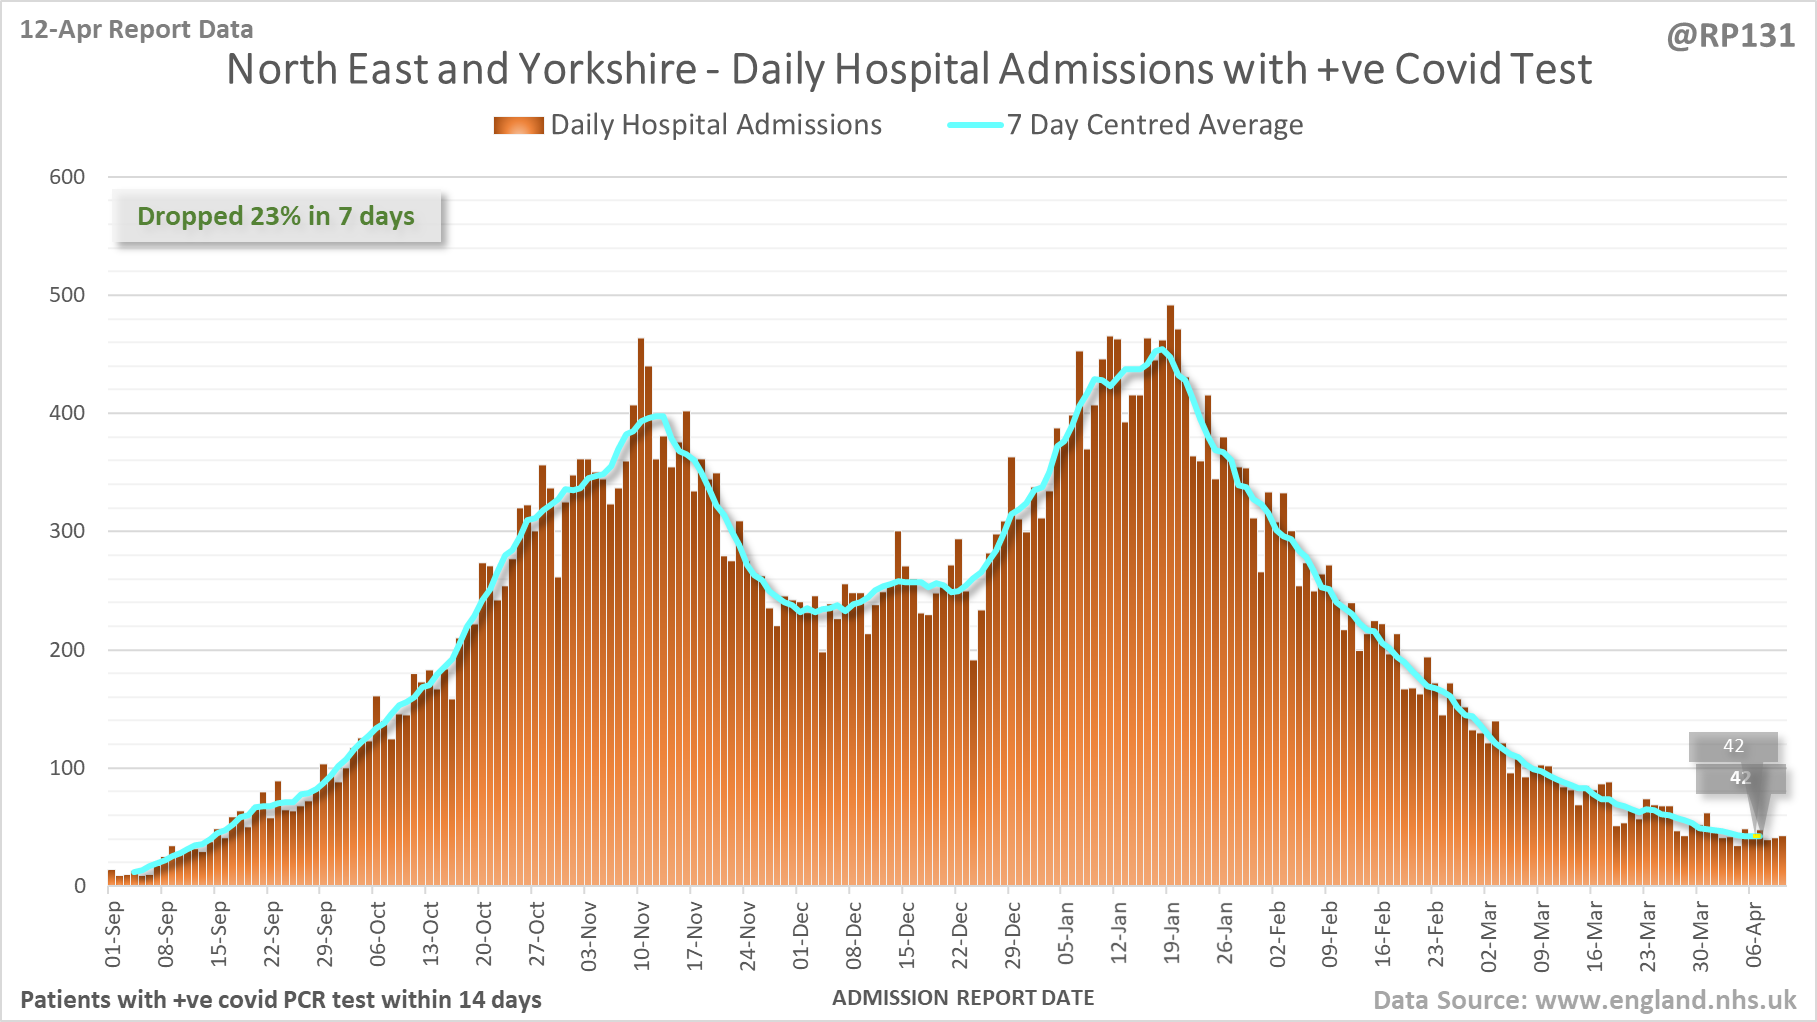
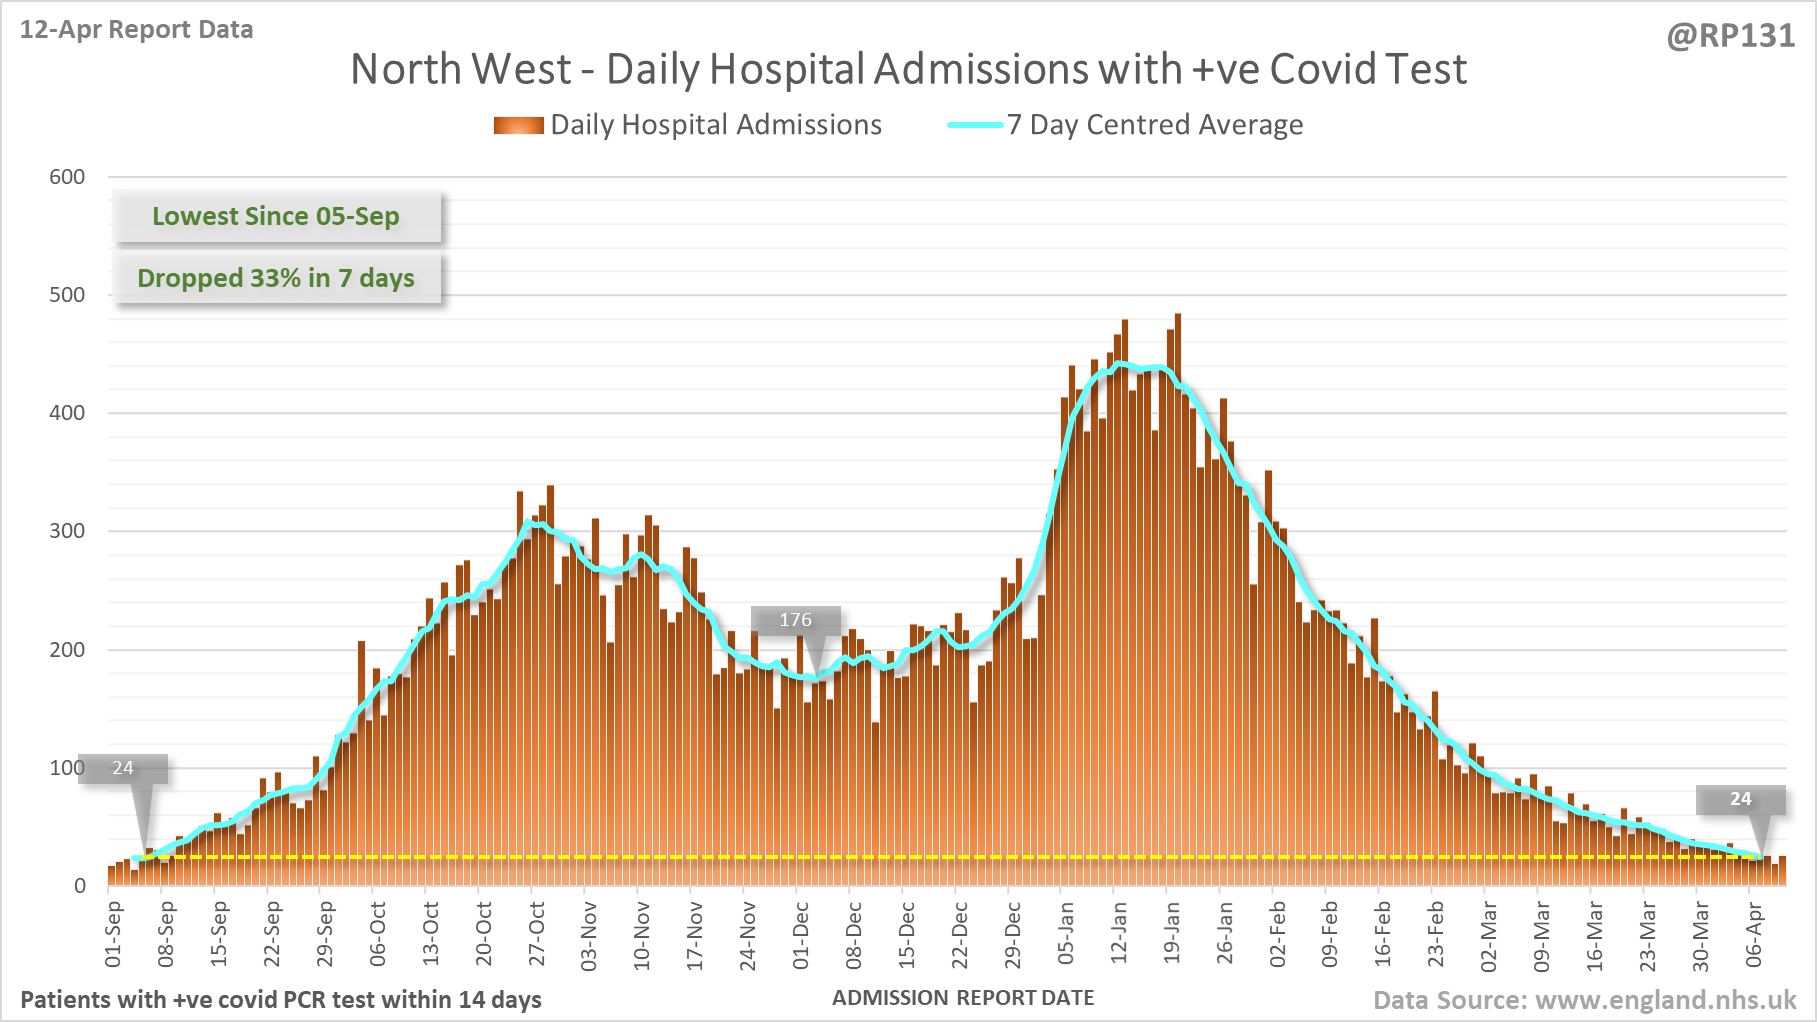
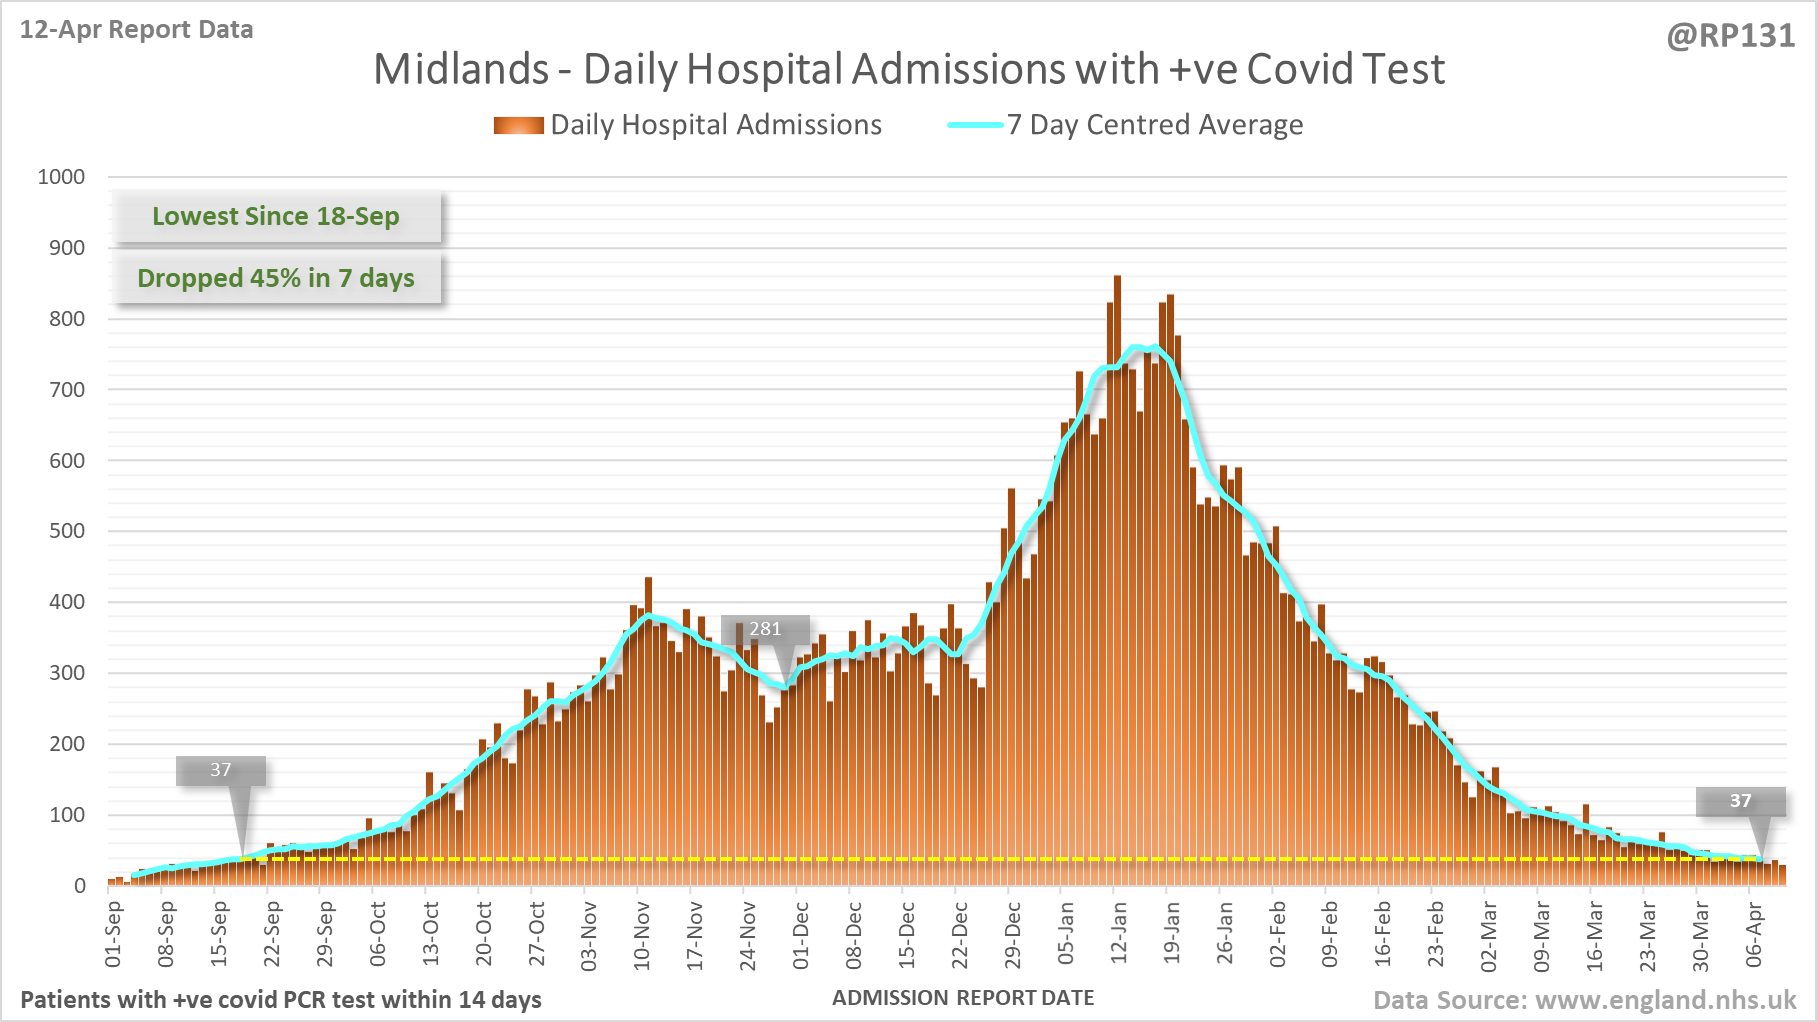
[3/20] Hospital admission charts for North East & Yorkshire, North West and Midlands. Note the different scales.
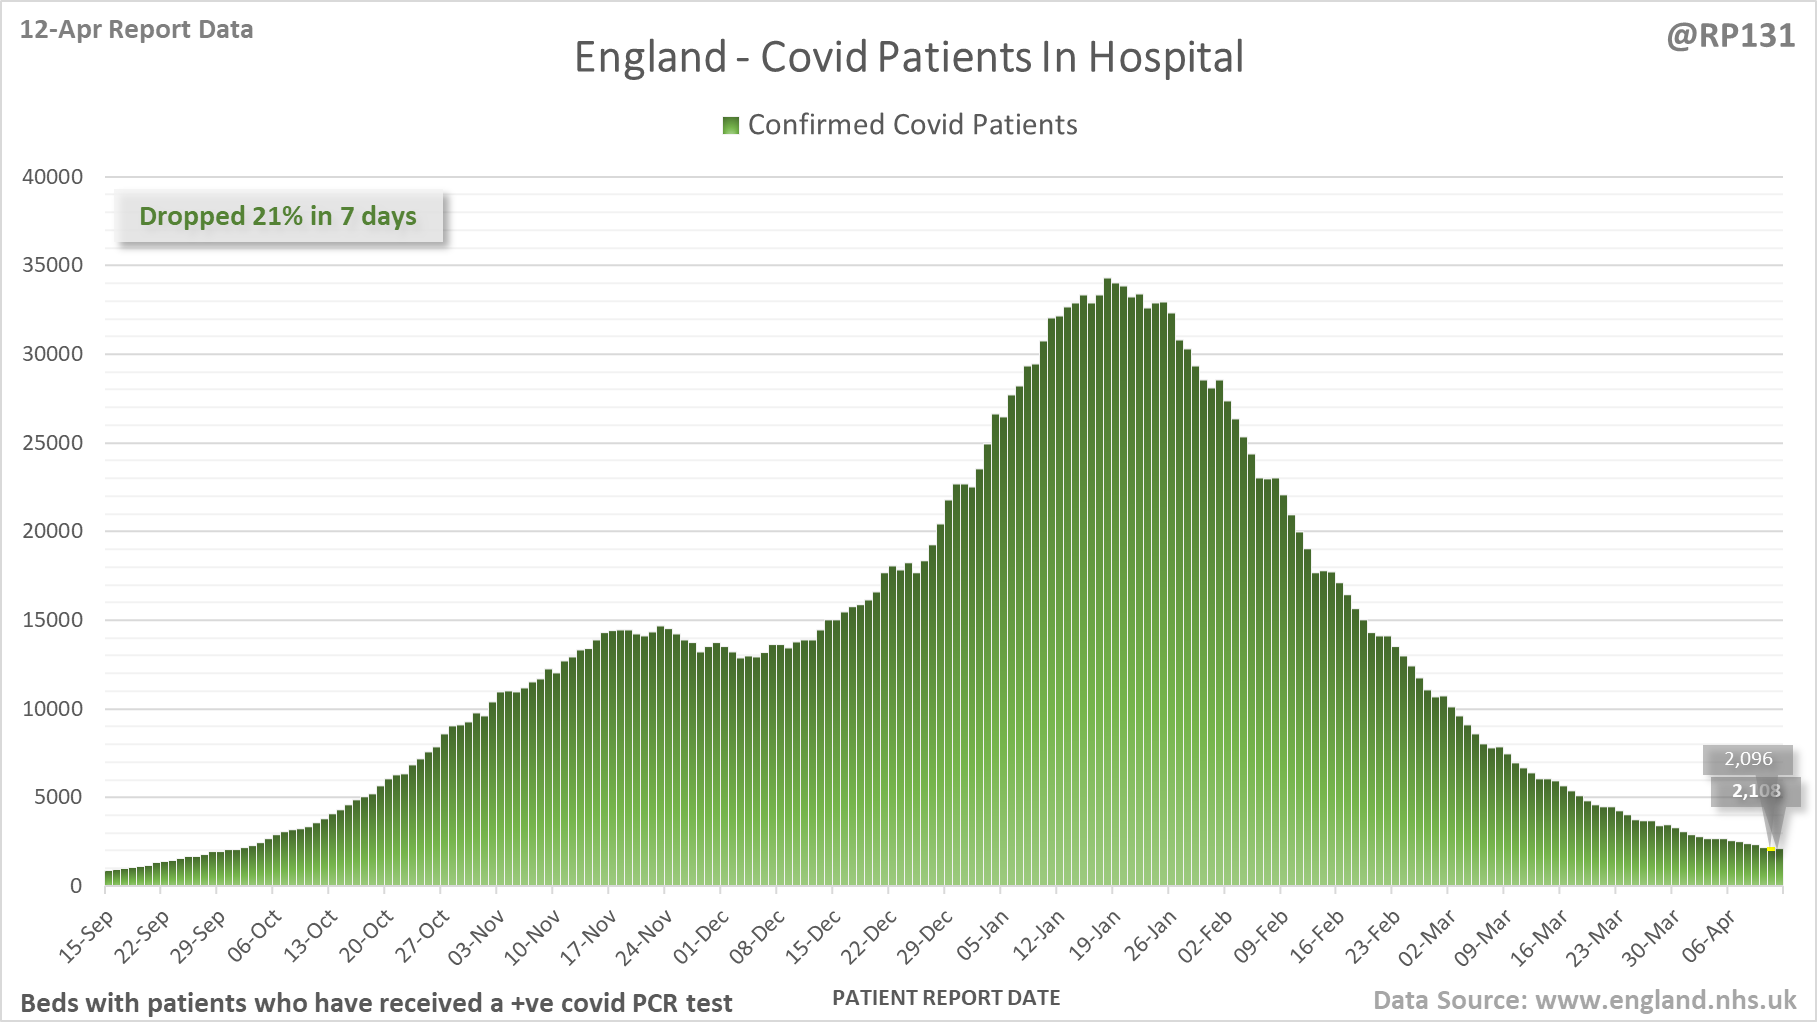
[4/20] Latest view on England confirmed covid patients currently in hospital, with 2,108 reported as of 8am on 12-Apr.
The count is now 2,108 and equivalent to around 11-Apr (i.e. 1 days ago).
The count is now 2,108 and equivalent to around 11-Apr (i.e. 1 days ago).
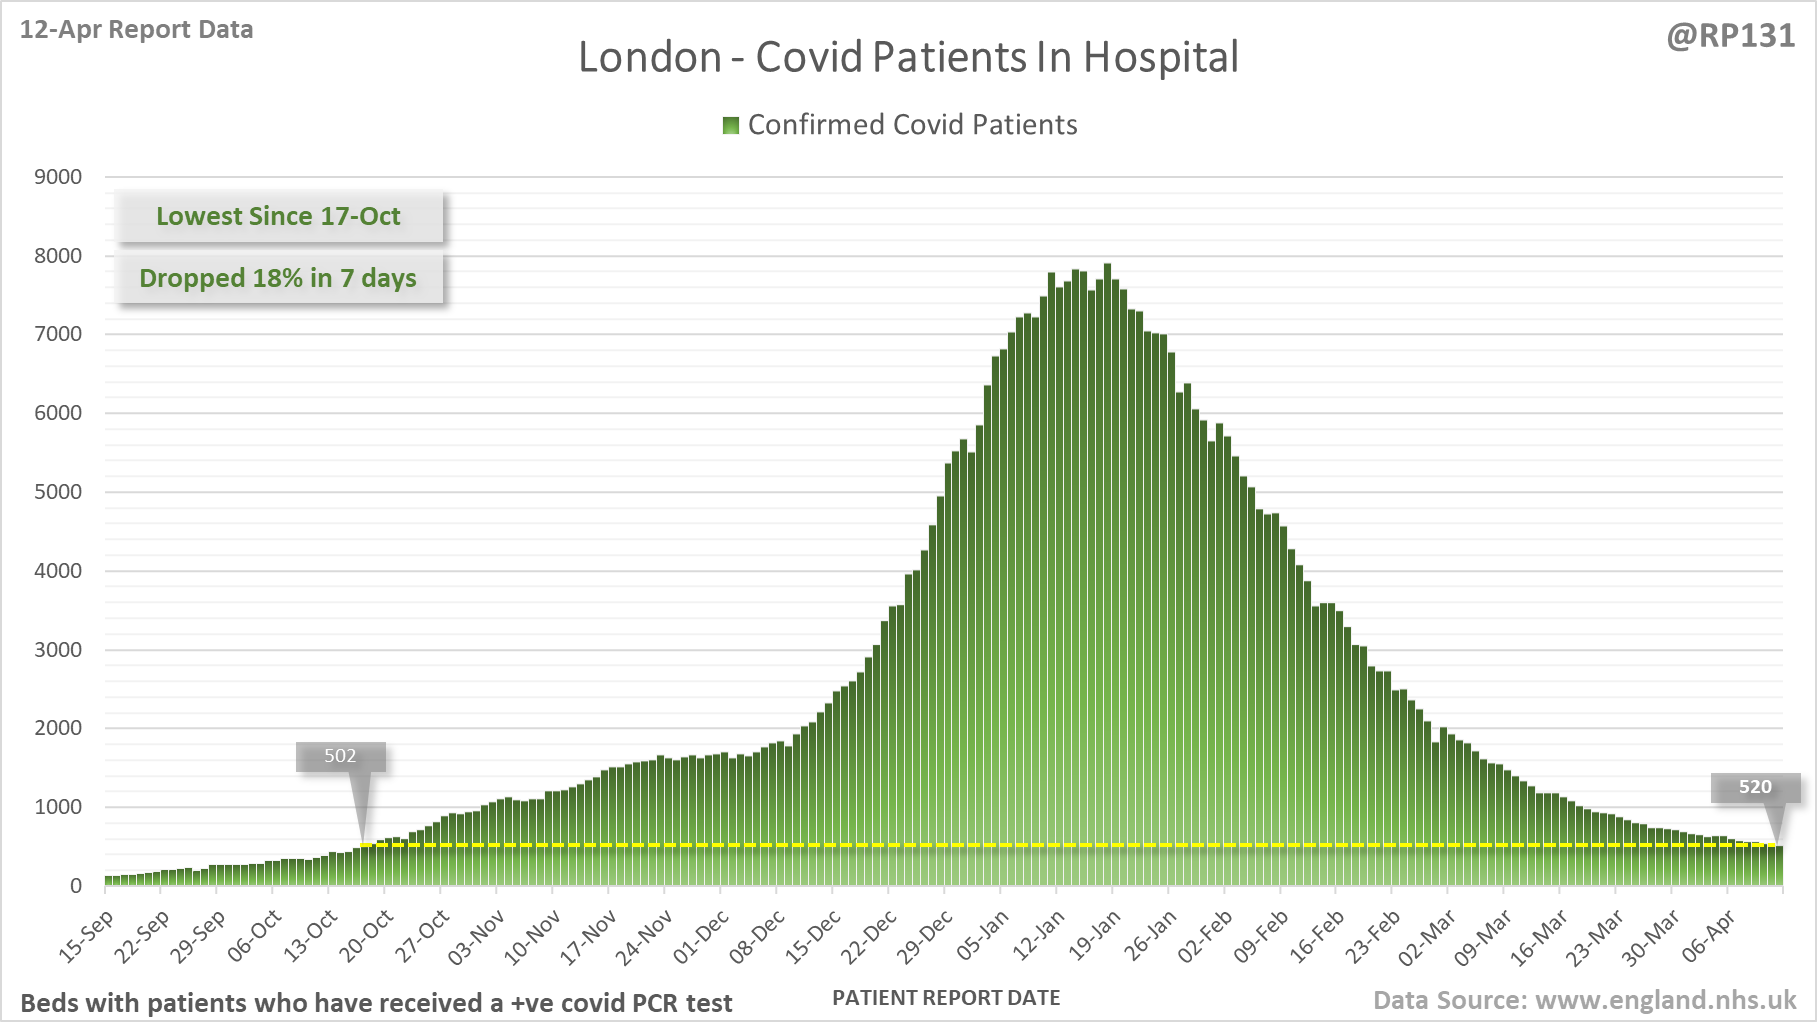
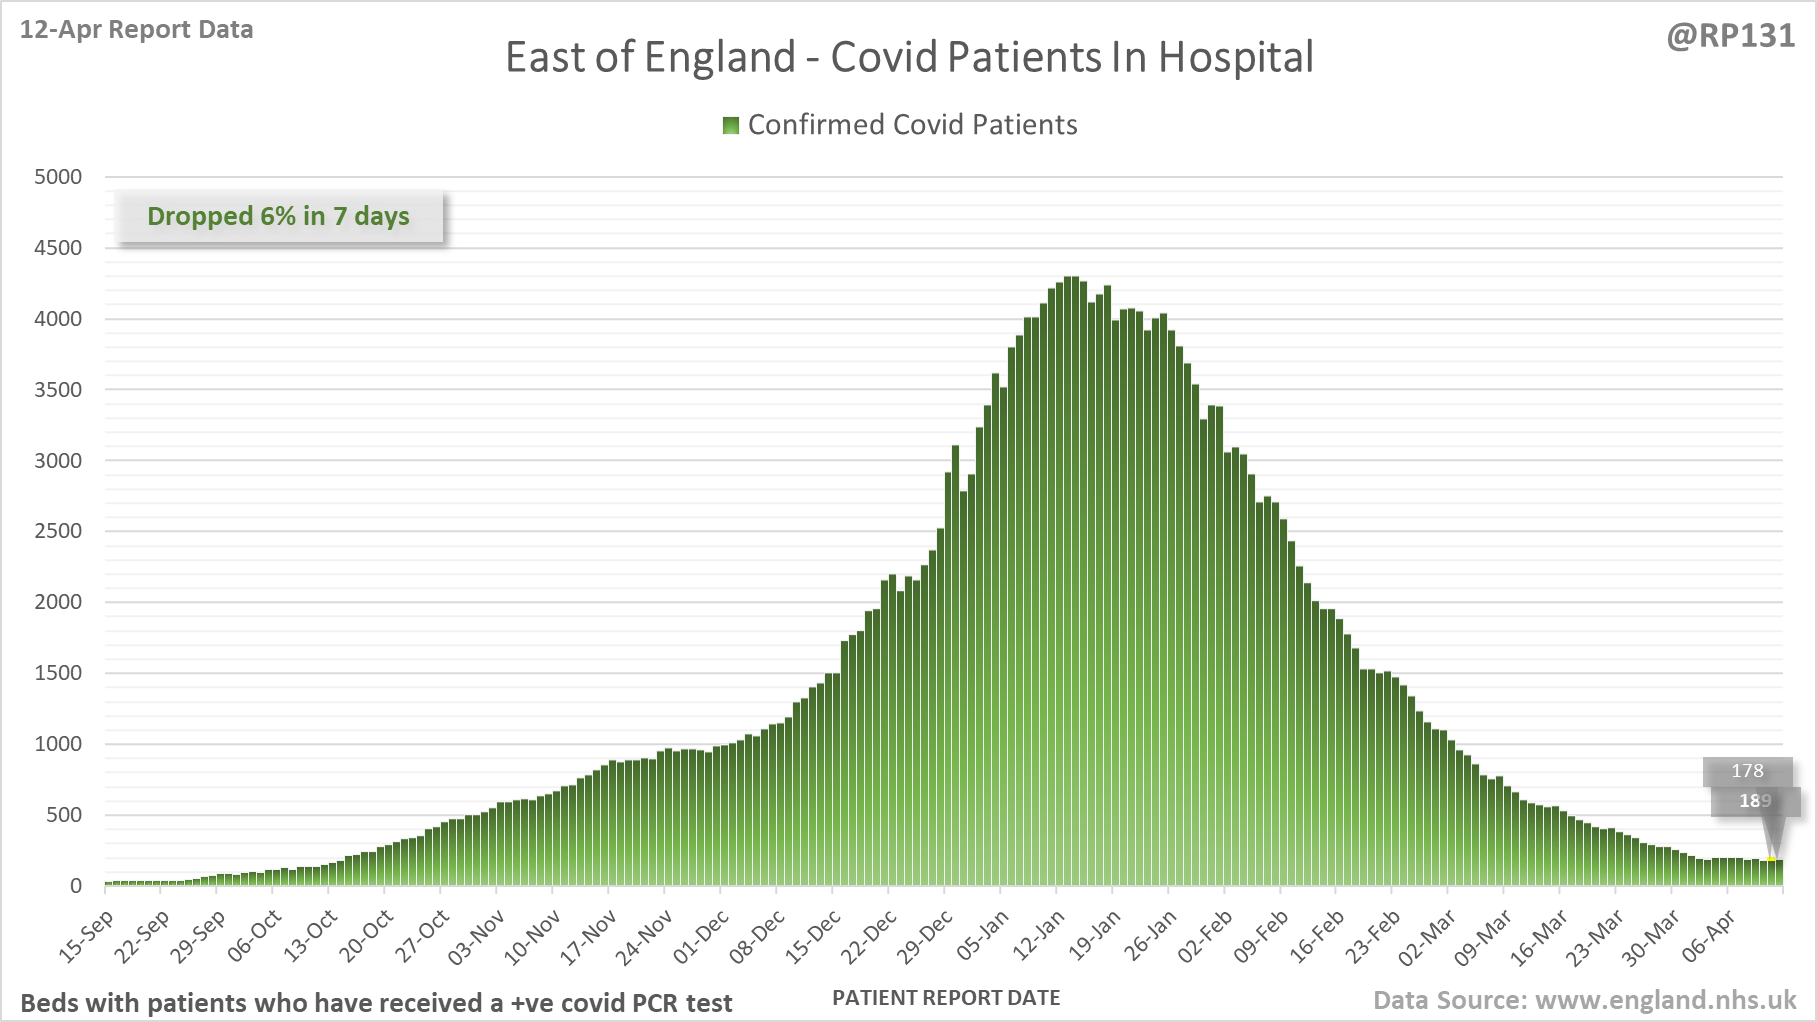
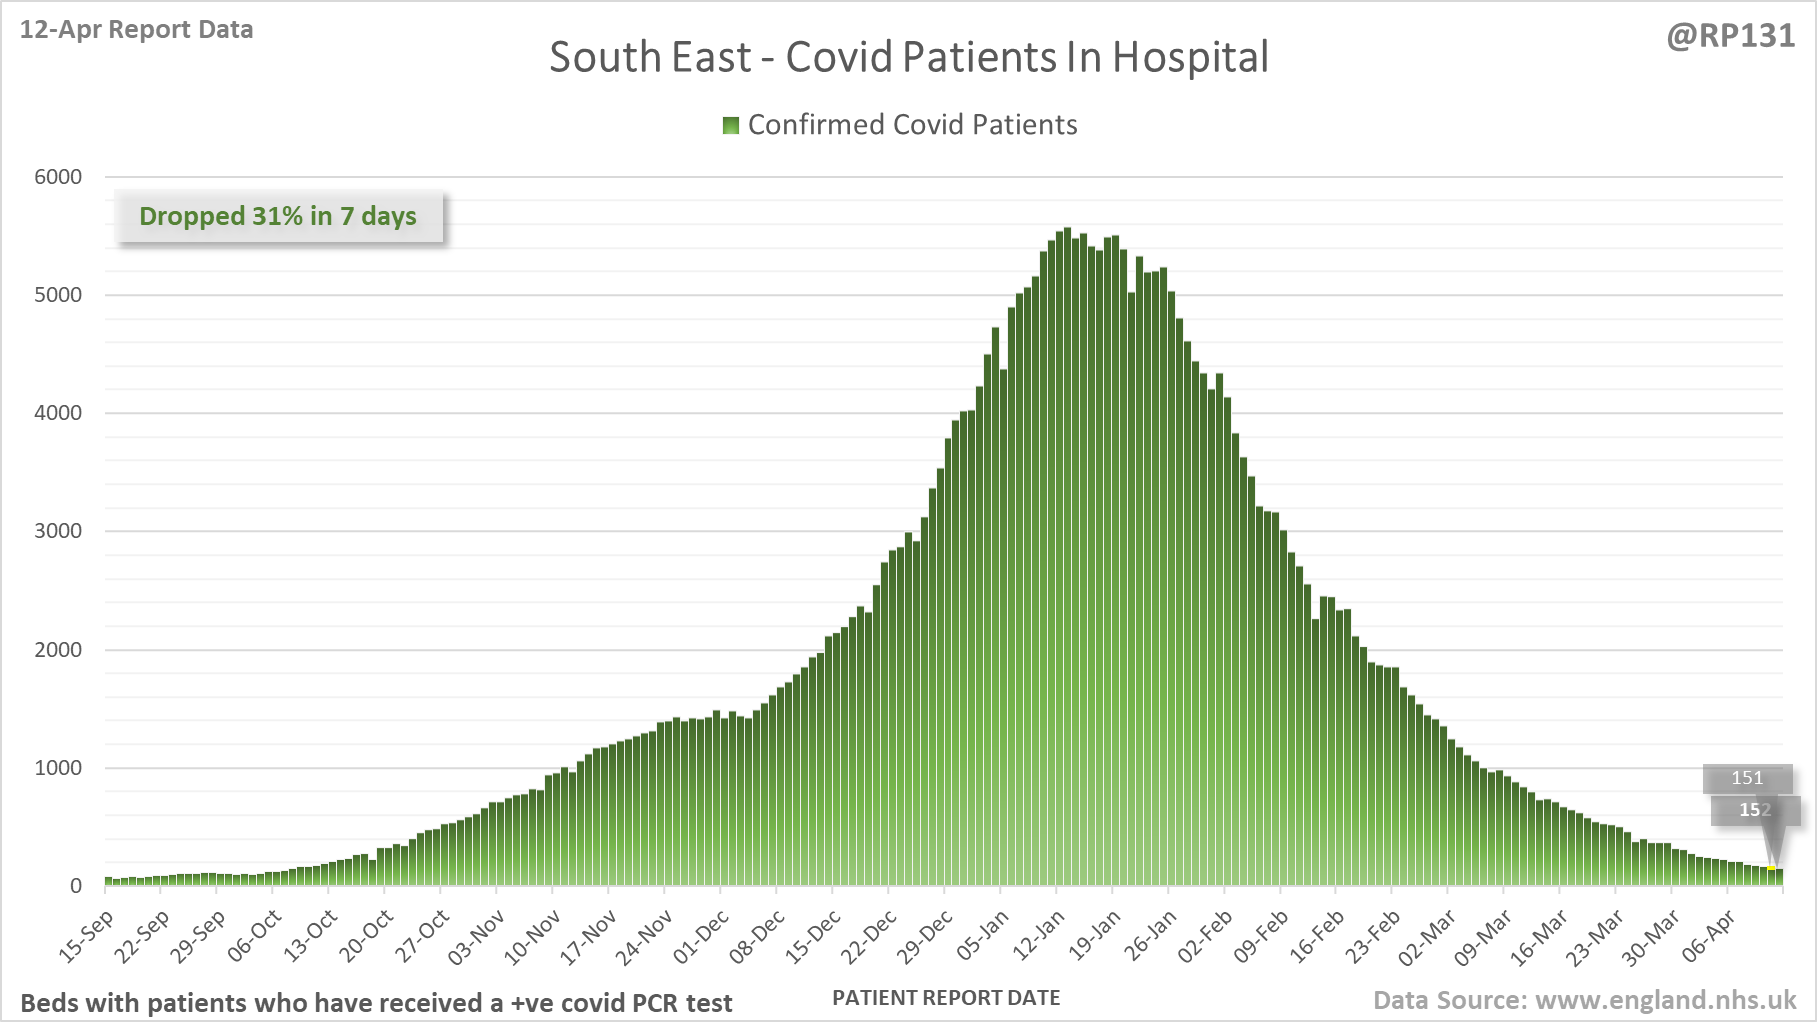
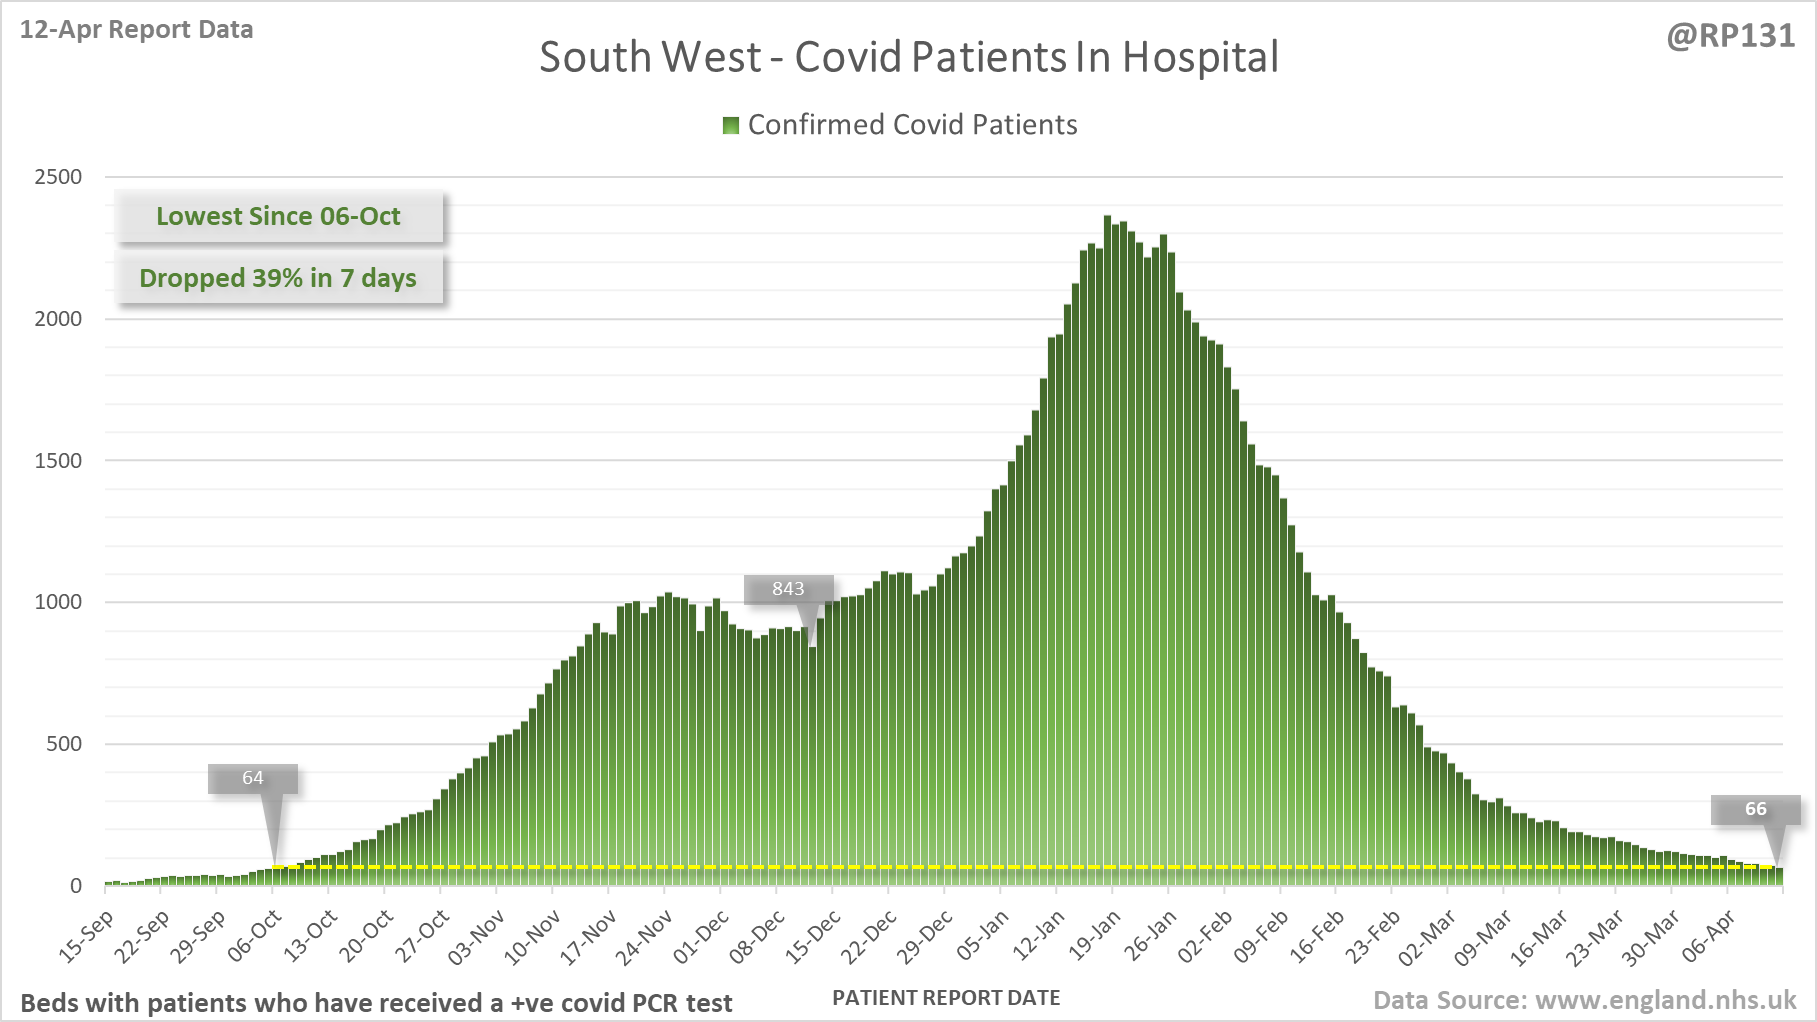
[5/20] Hospital current patient charts for London, East of England, South East and South West. Note the different scales.
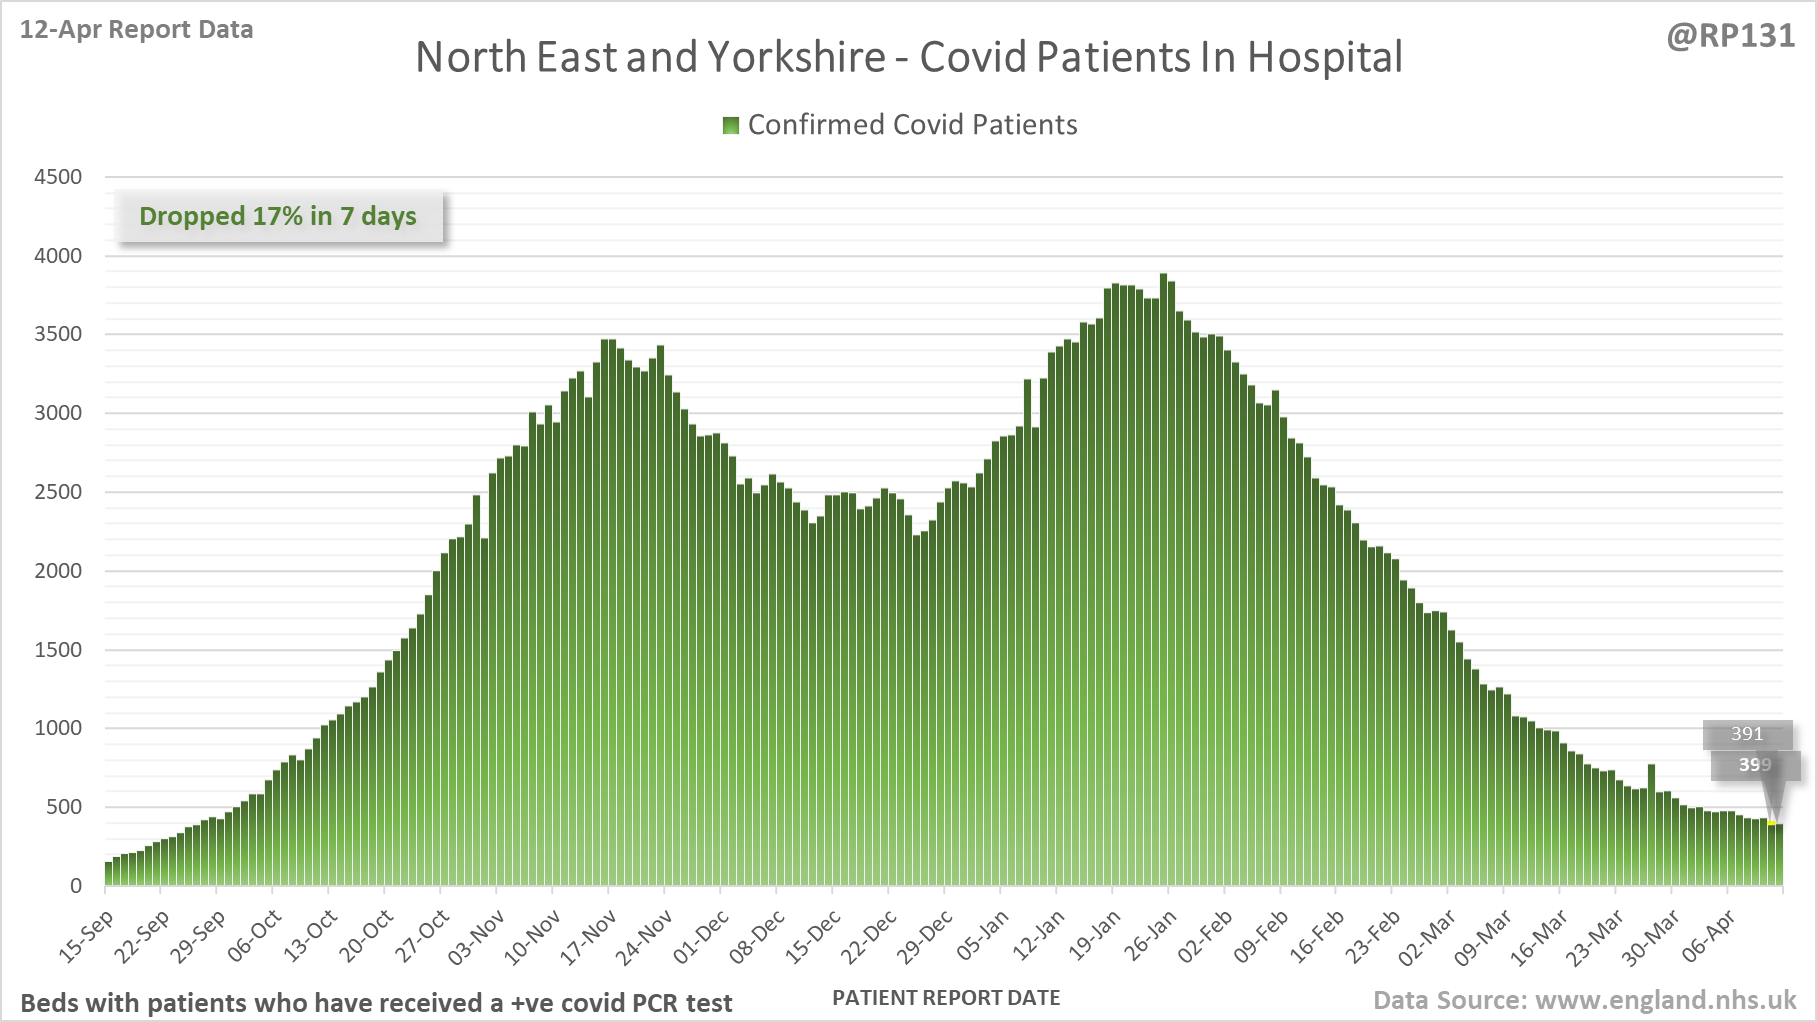
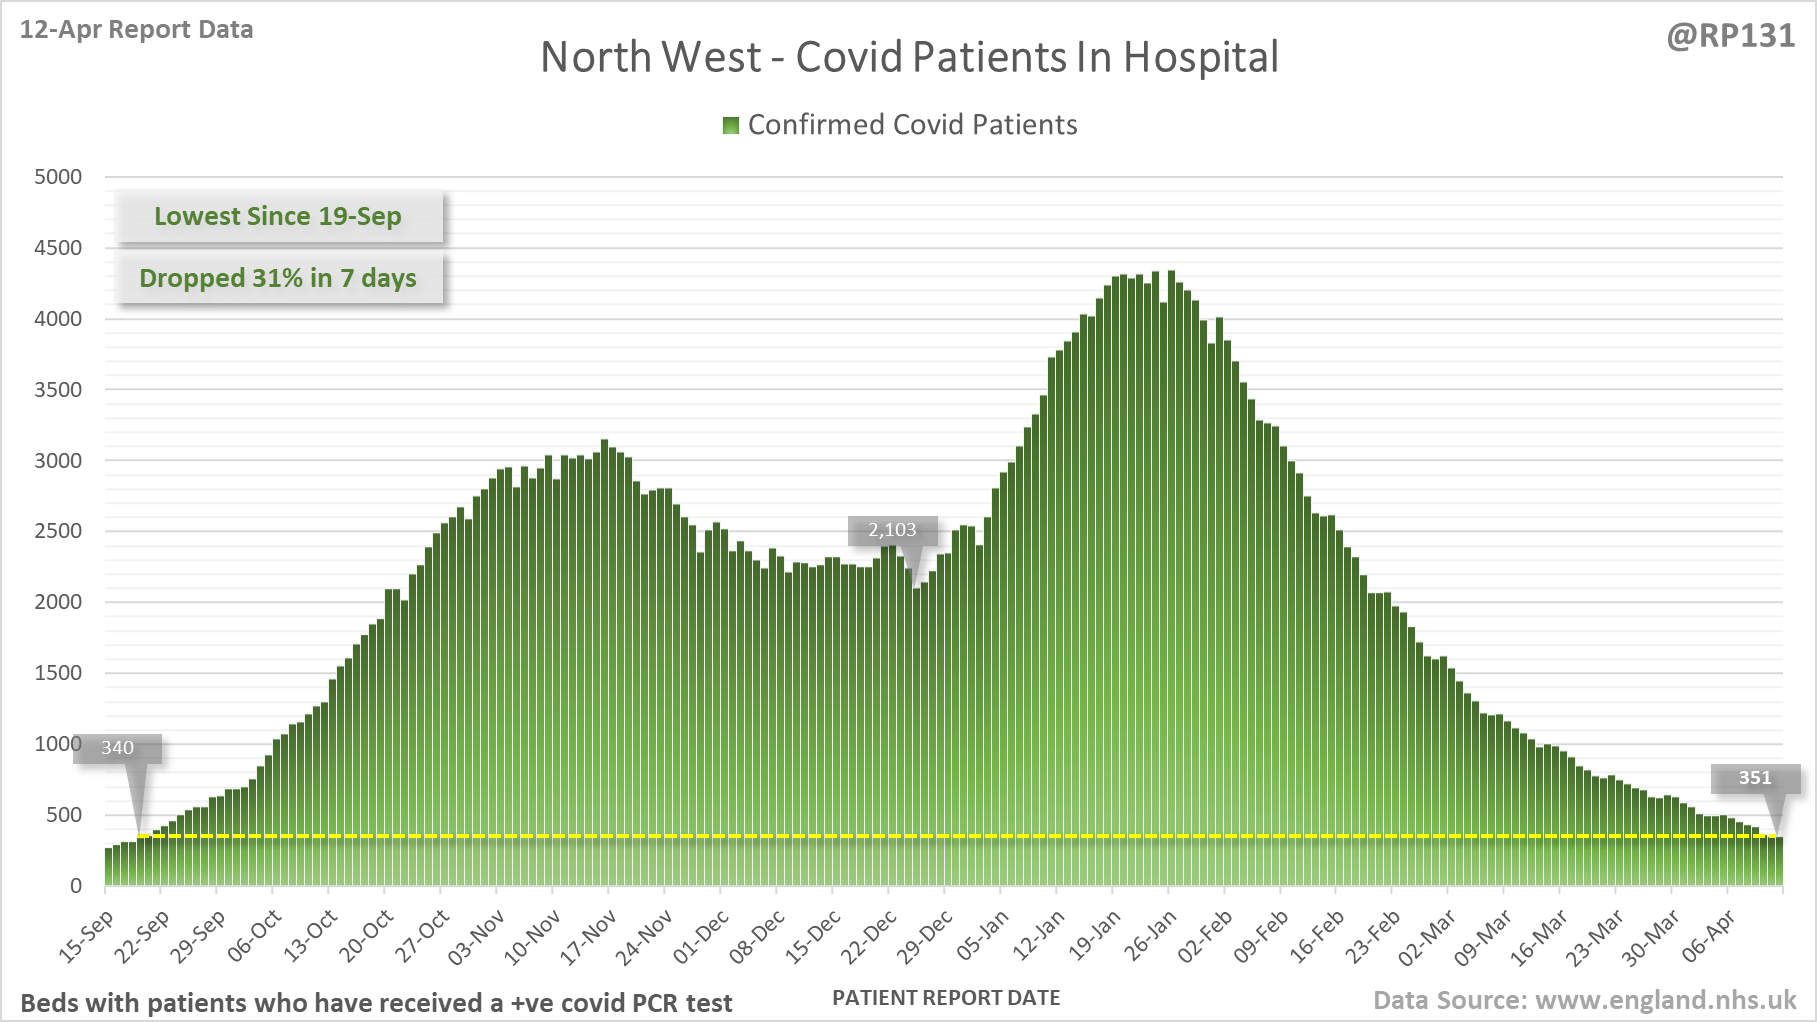
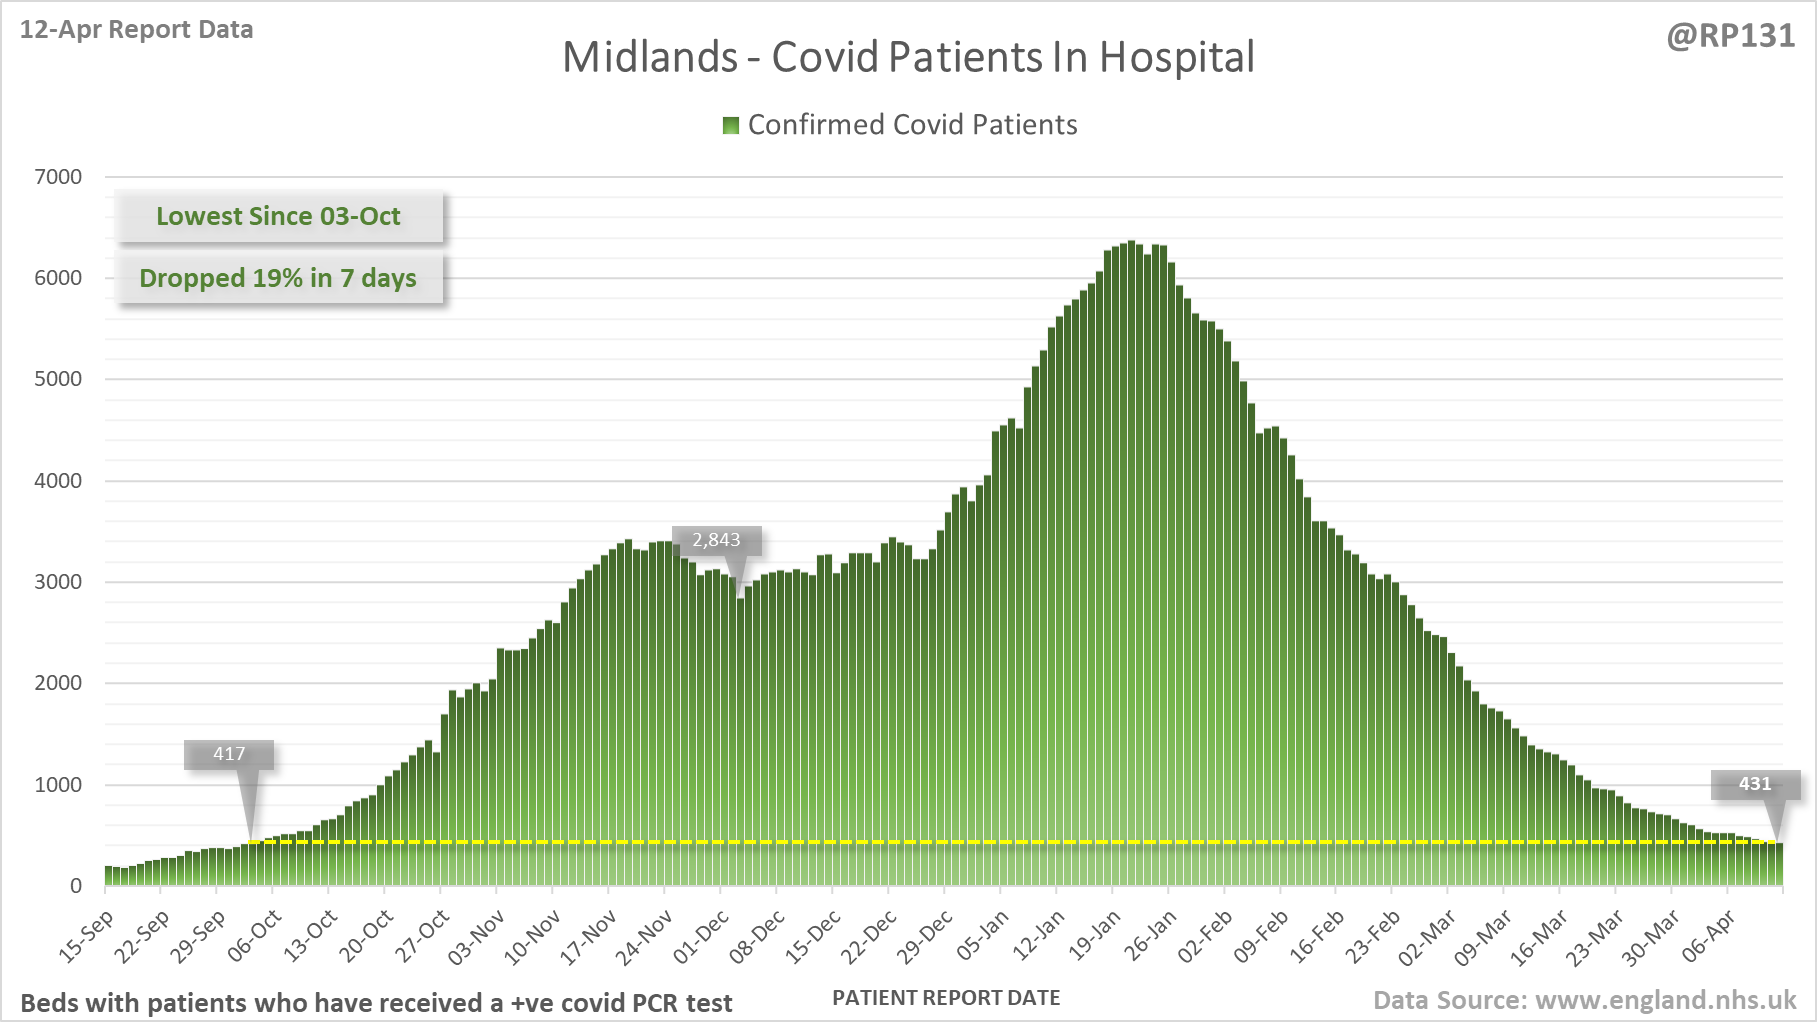
[6/20] Hospital current patient charts for North East & Yorkshire, North West and Midlands. Note the different scales.
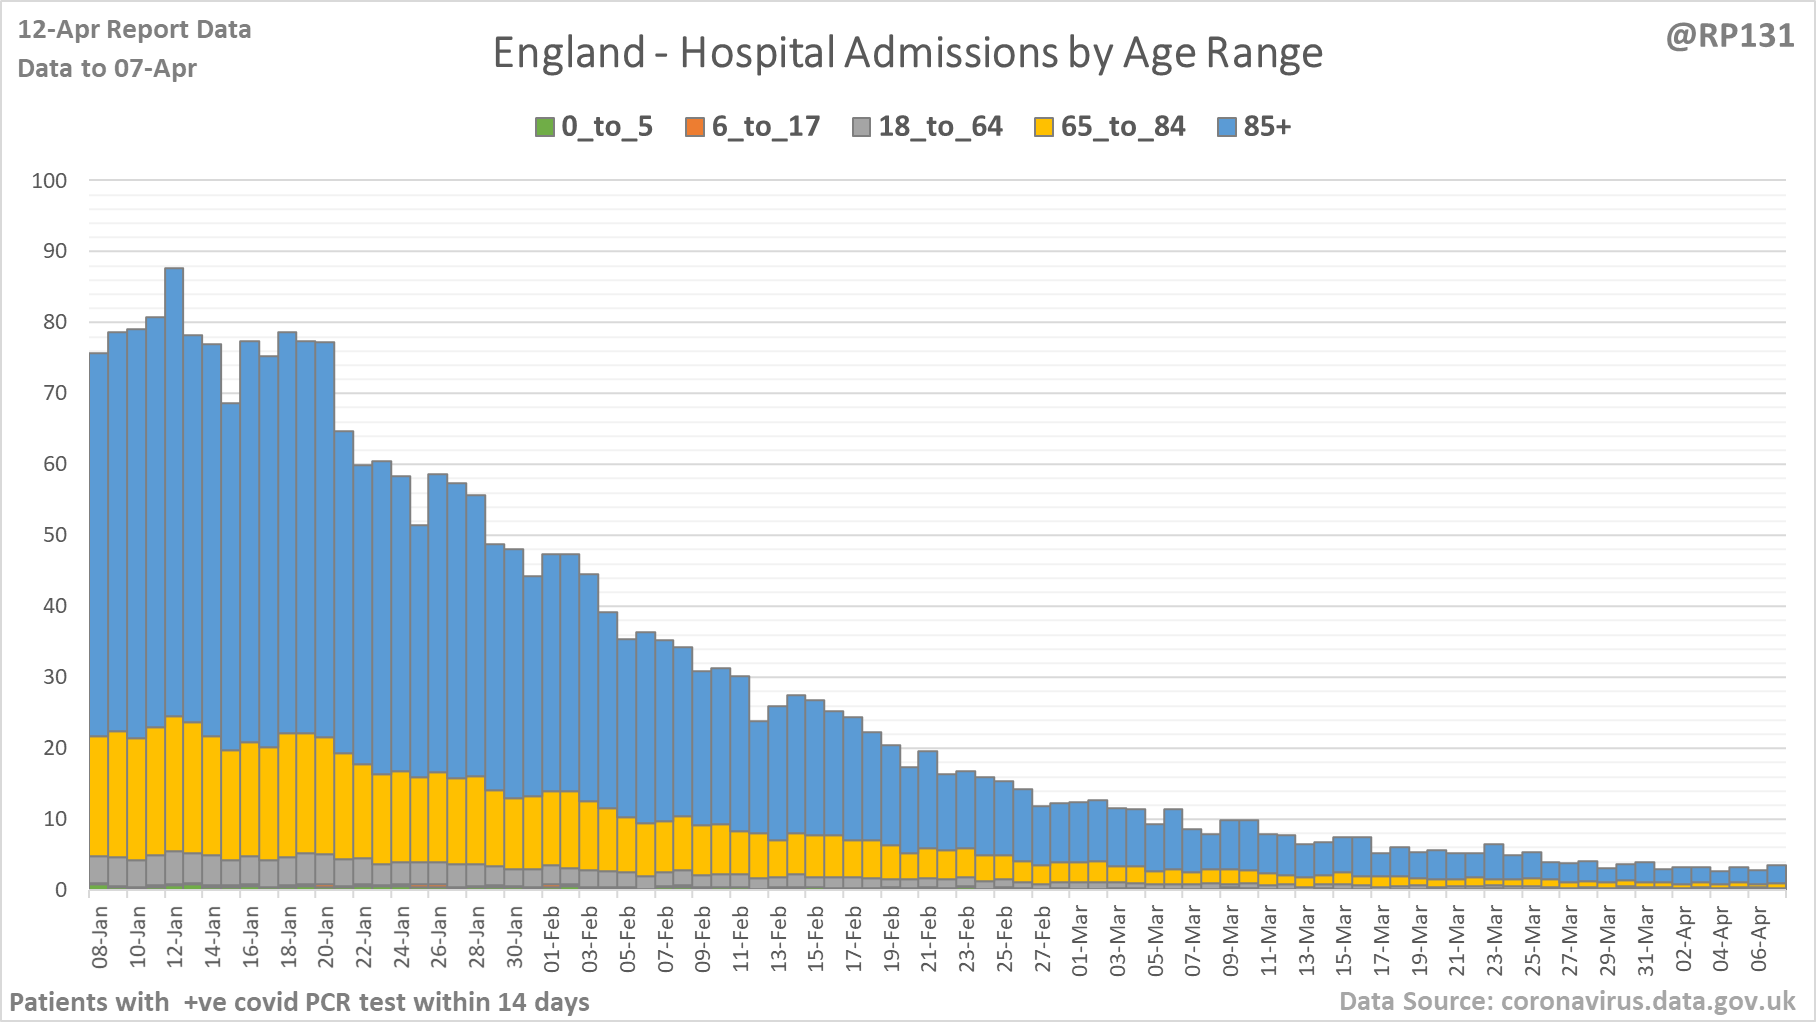
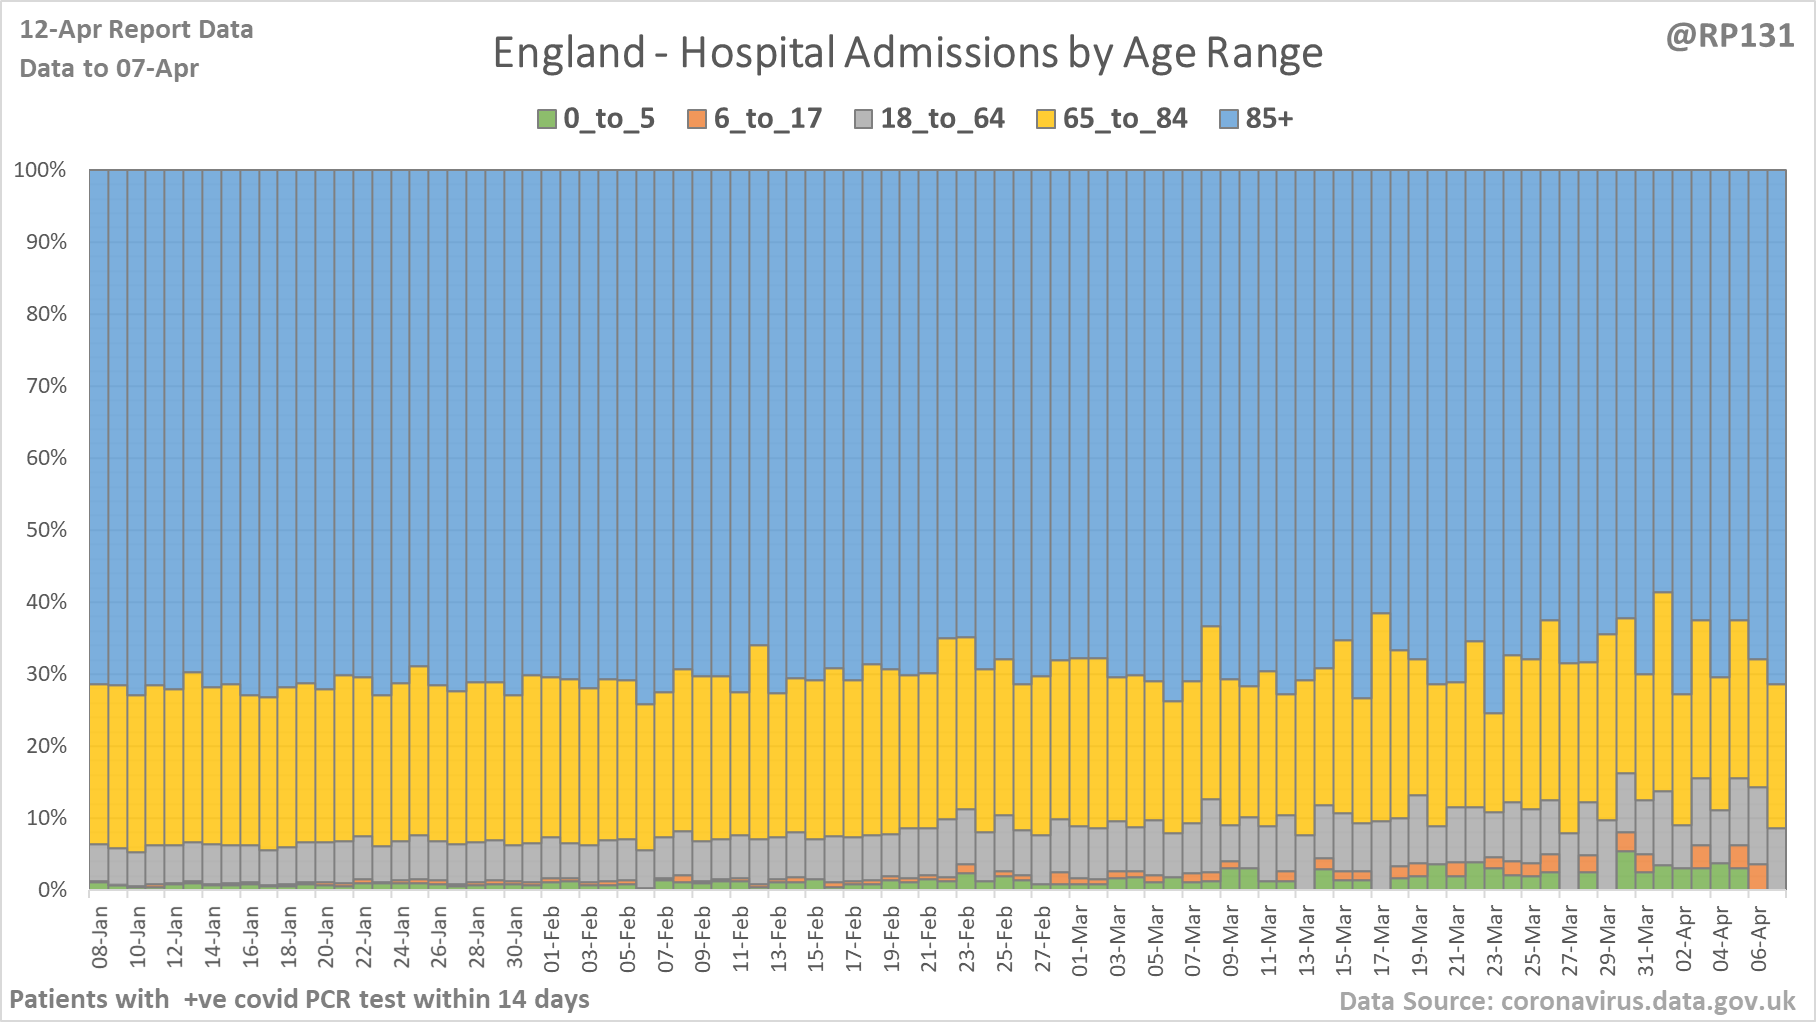
[7/20] Age ranges of England hospital admissions. Note this age-range data lags a day or so behind the above totals data.
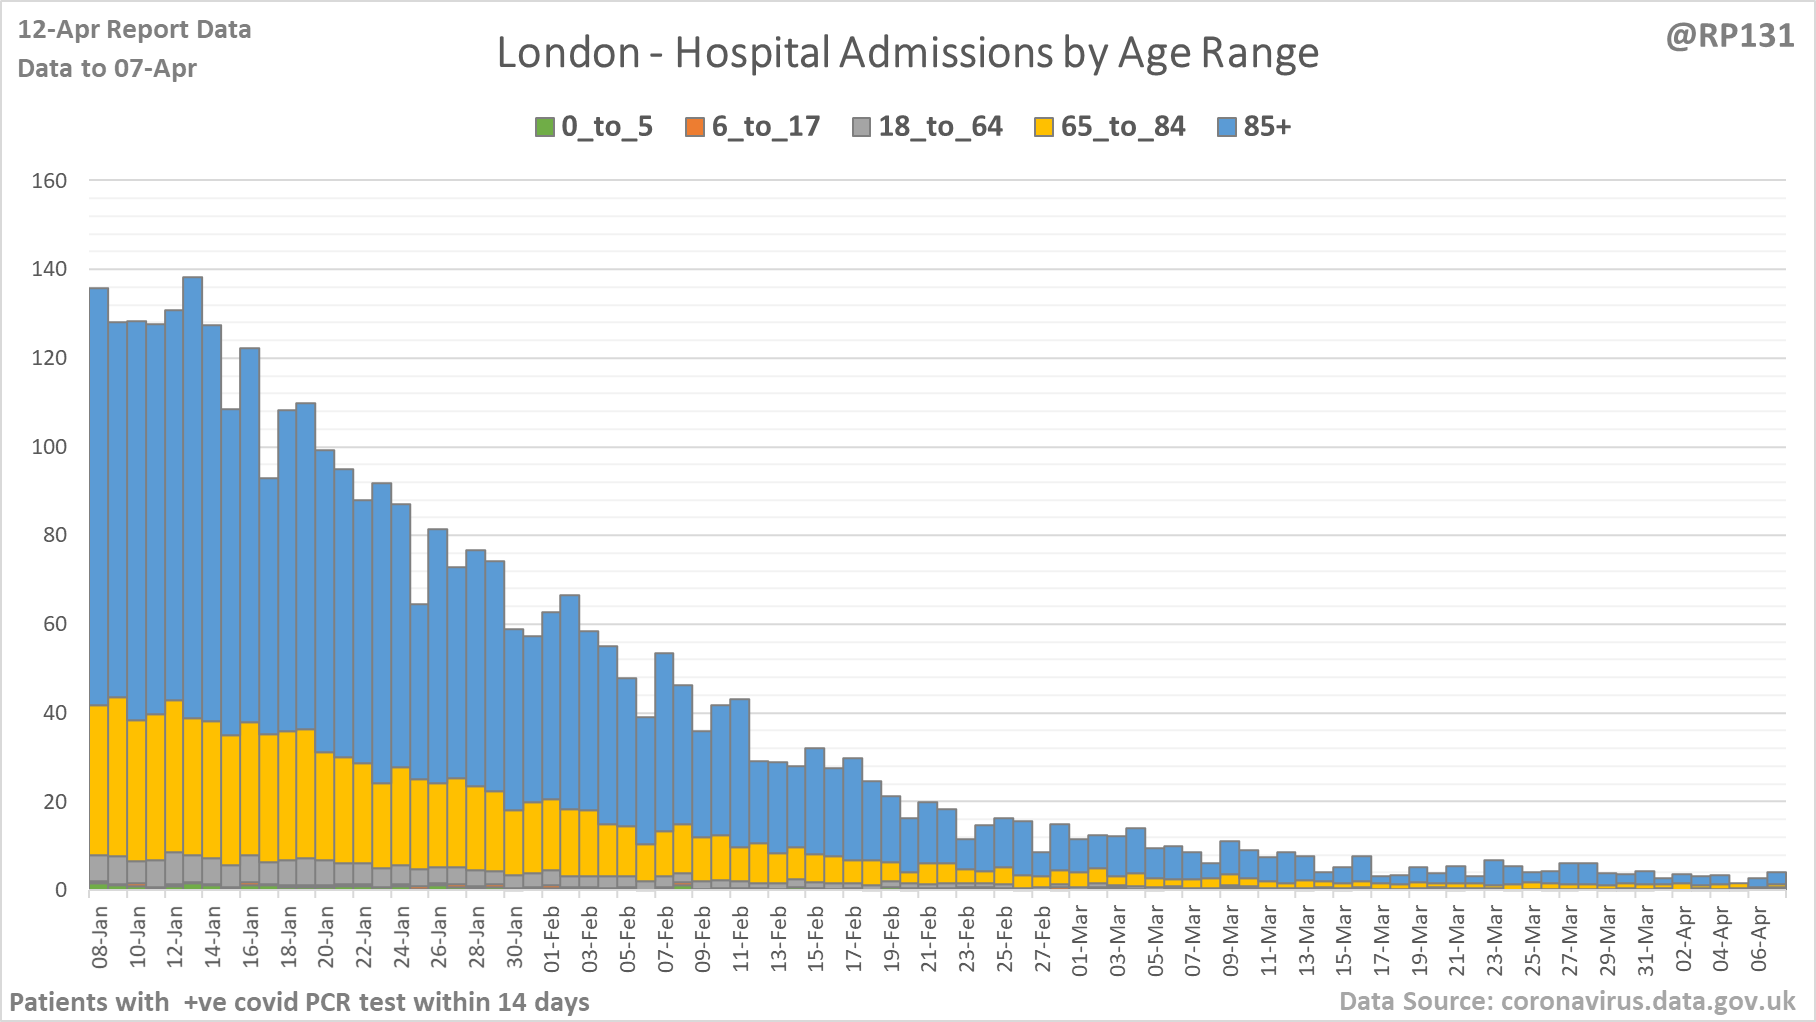
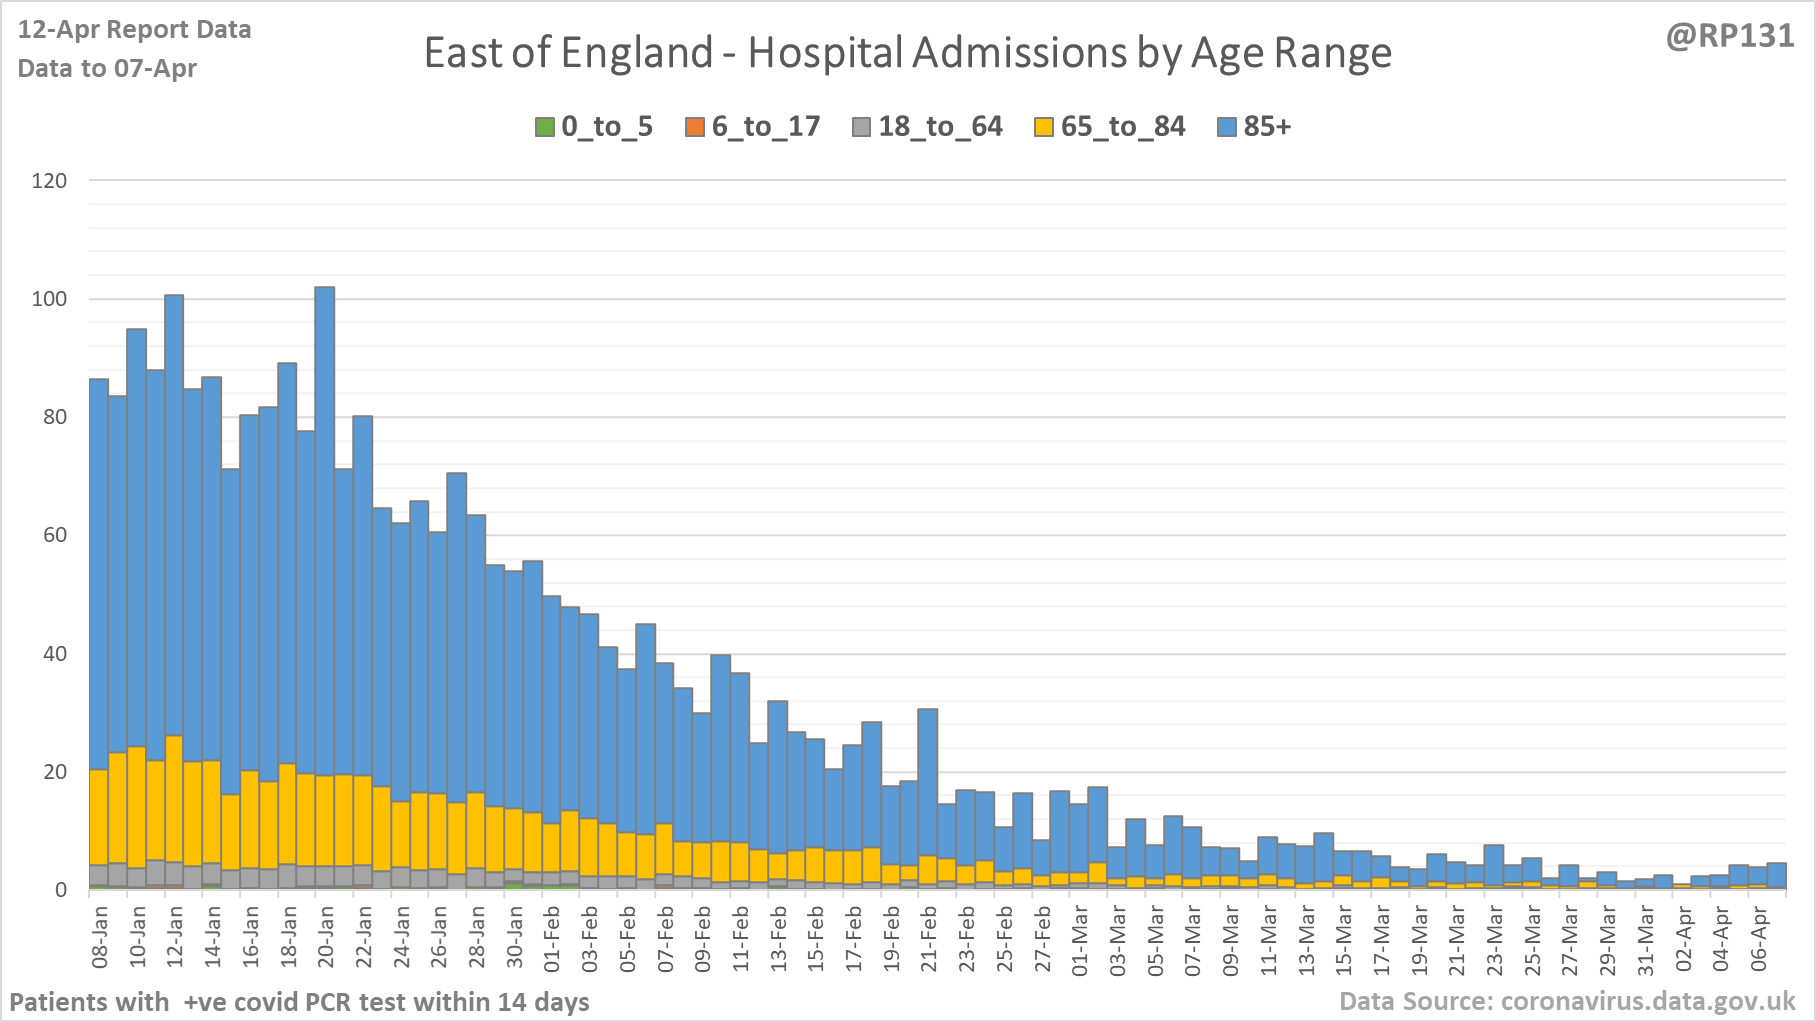
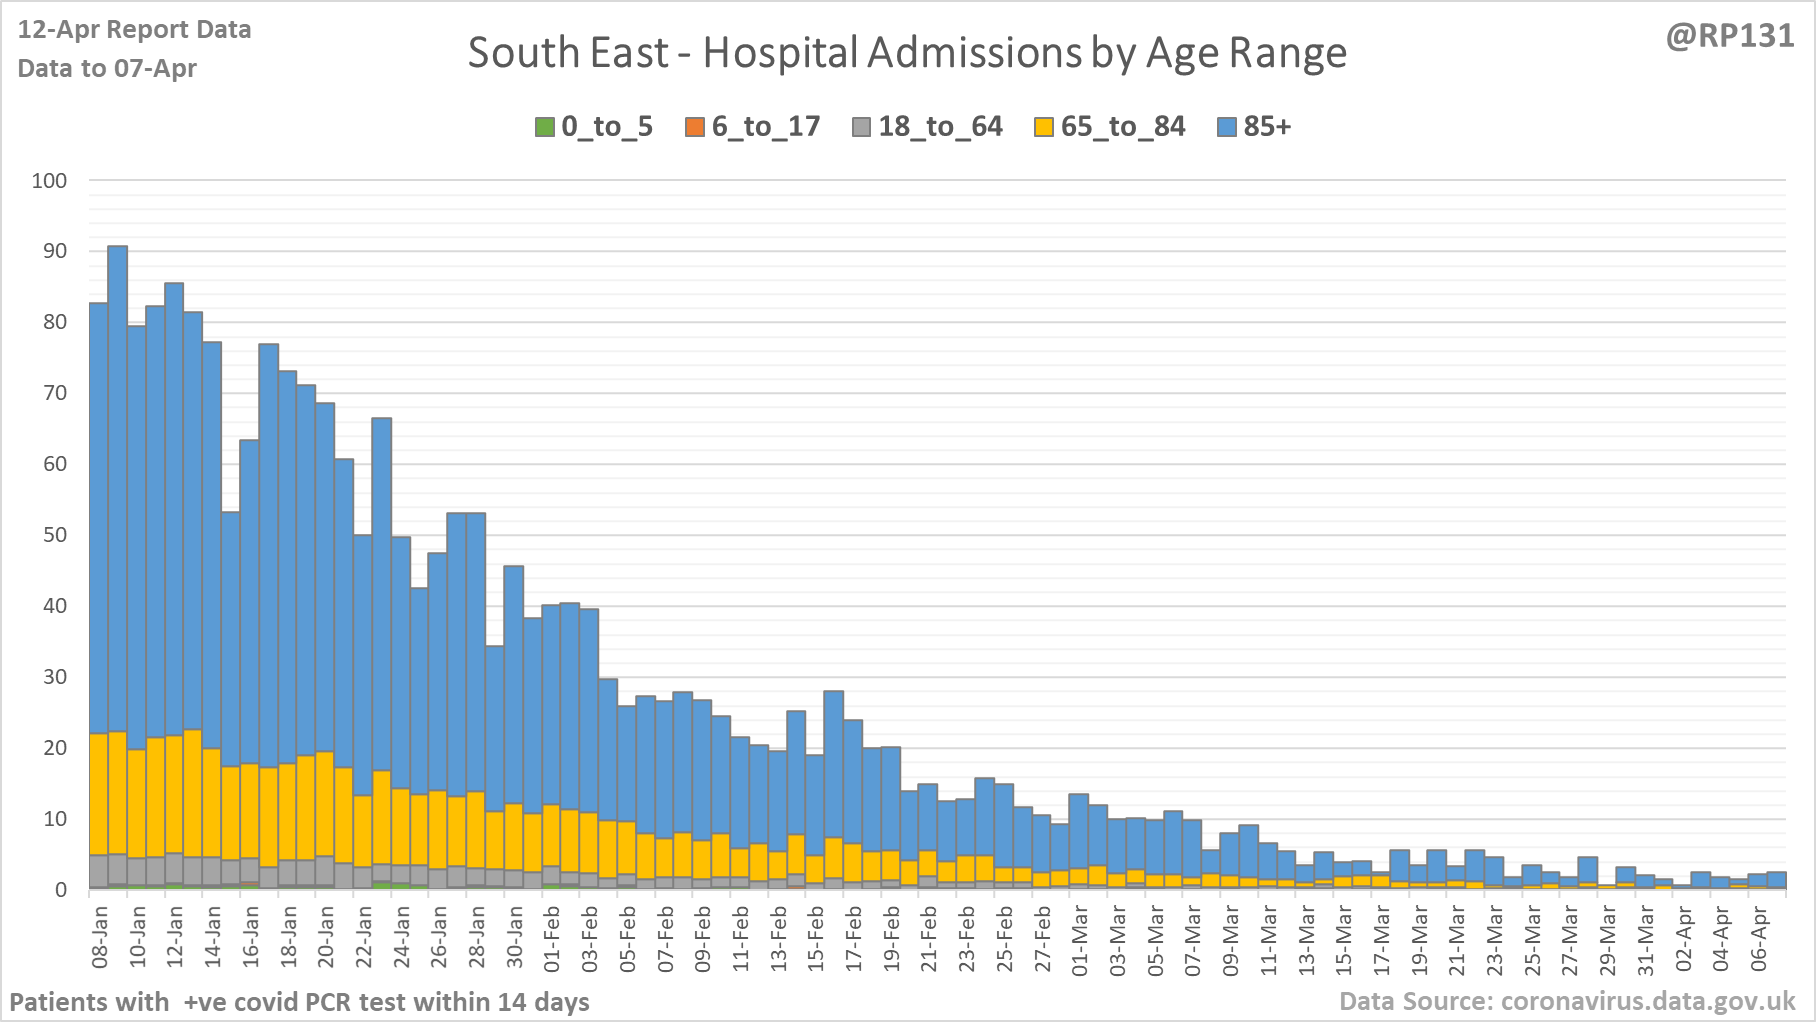
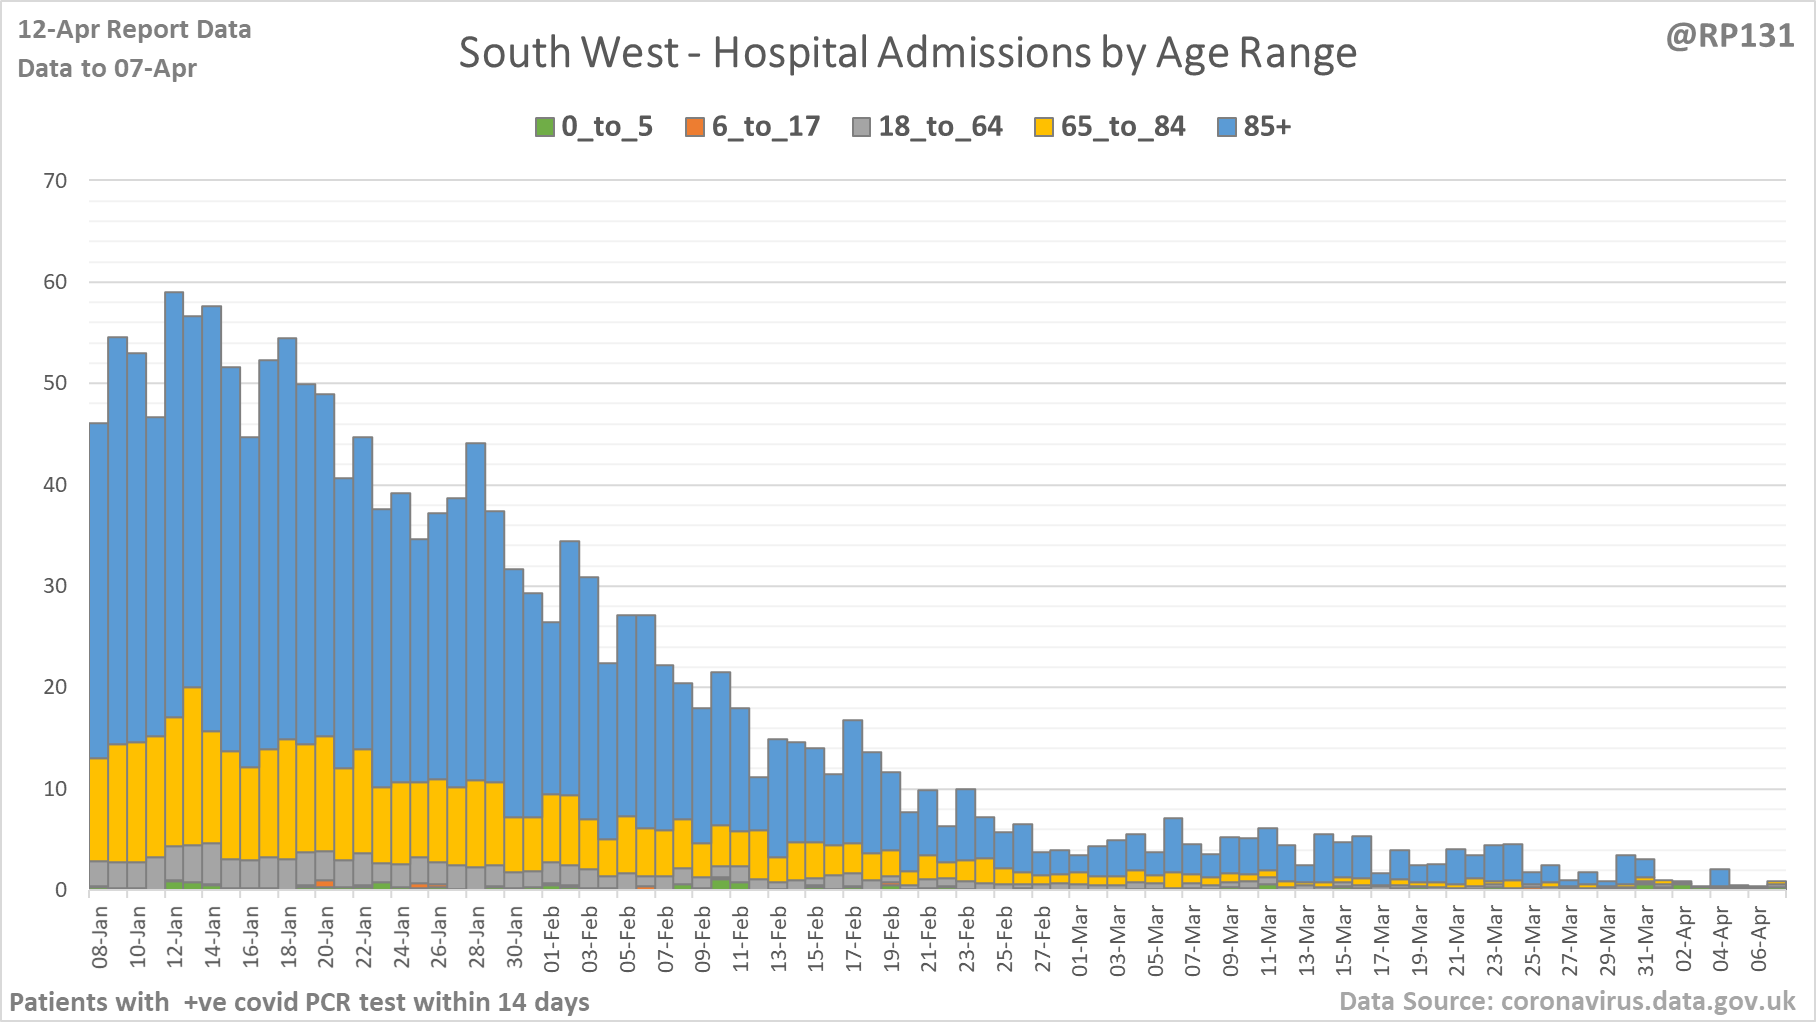
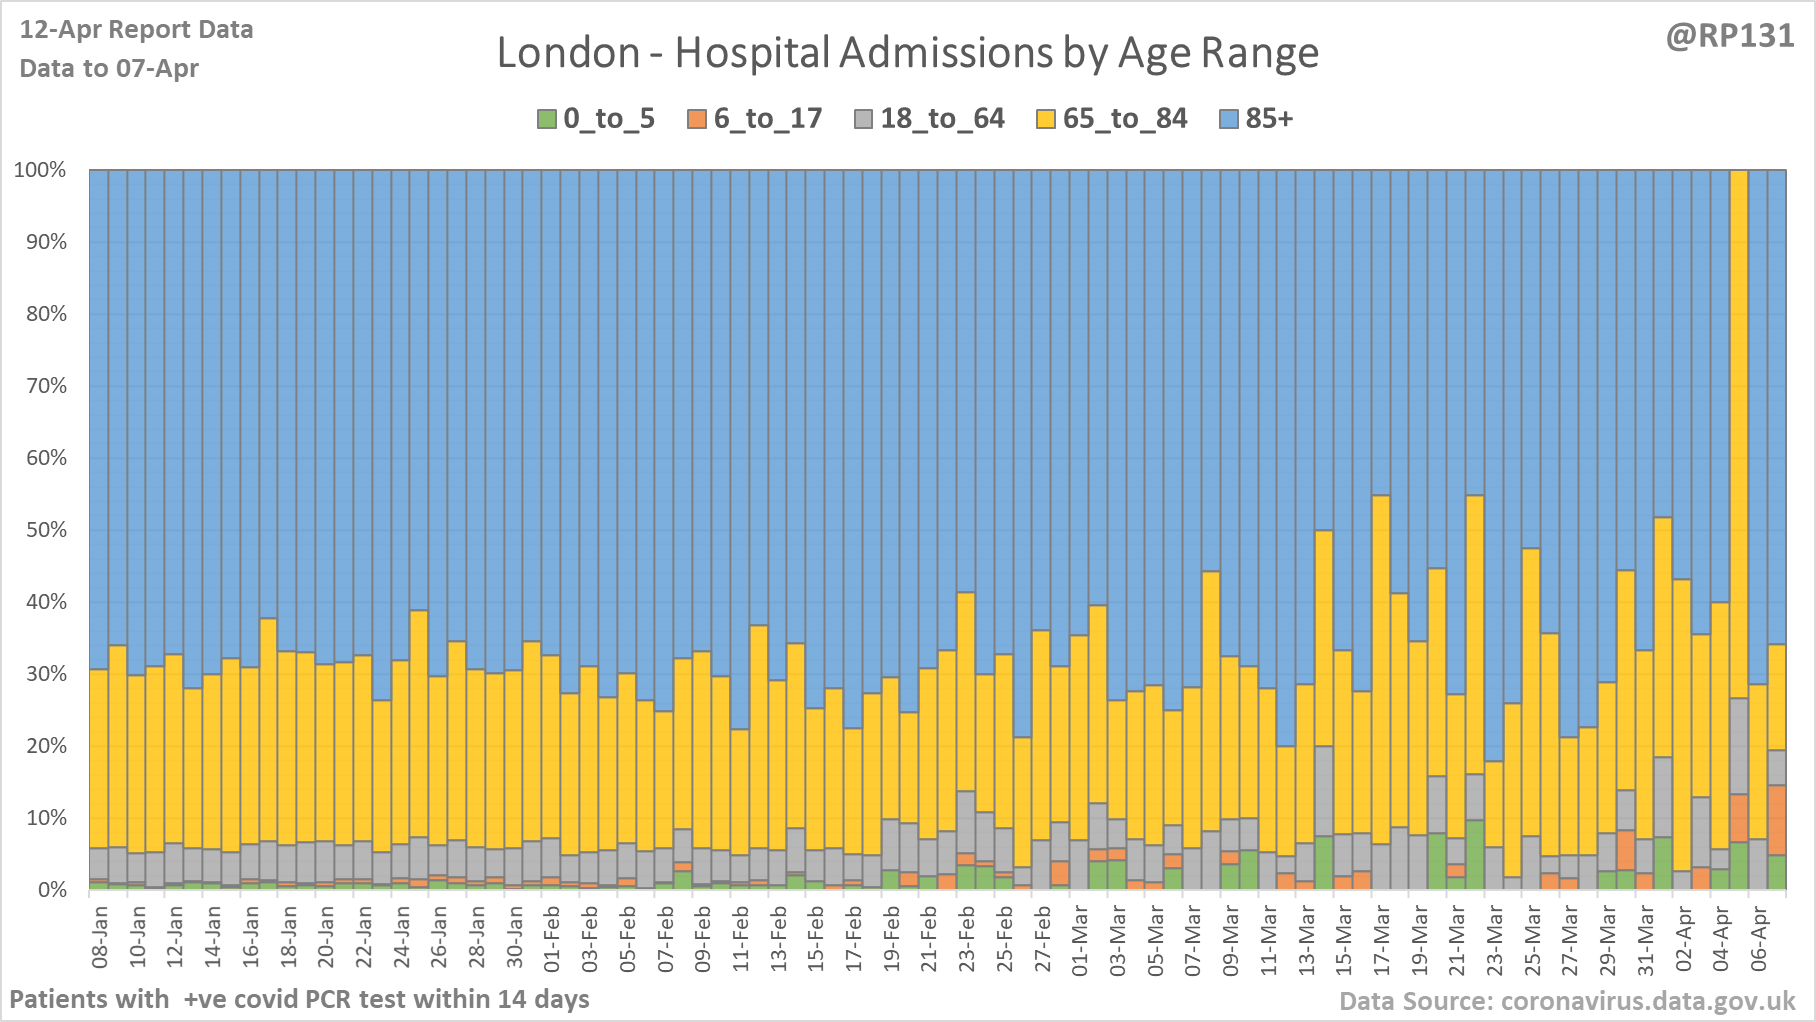
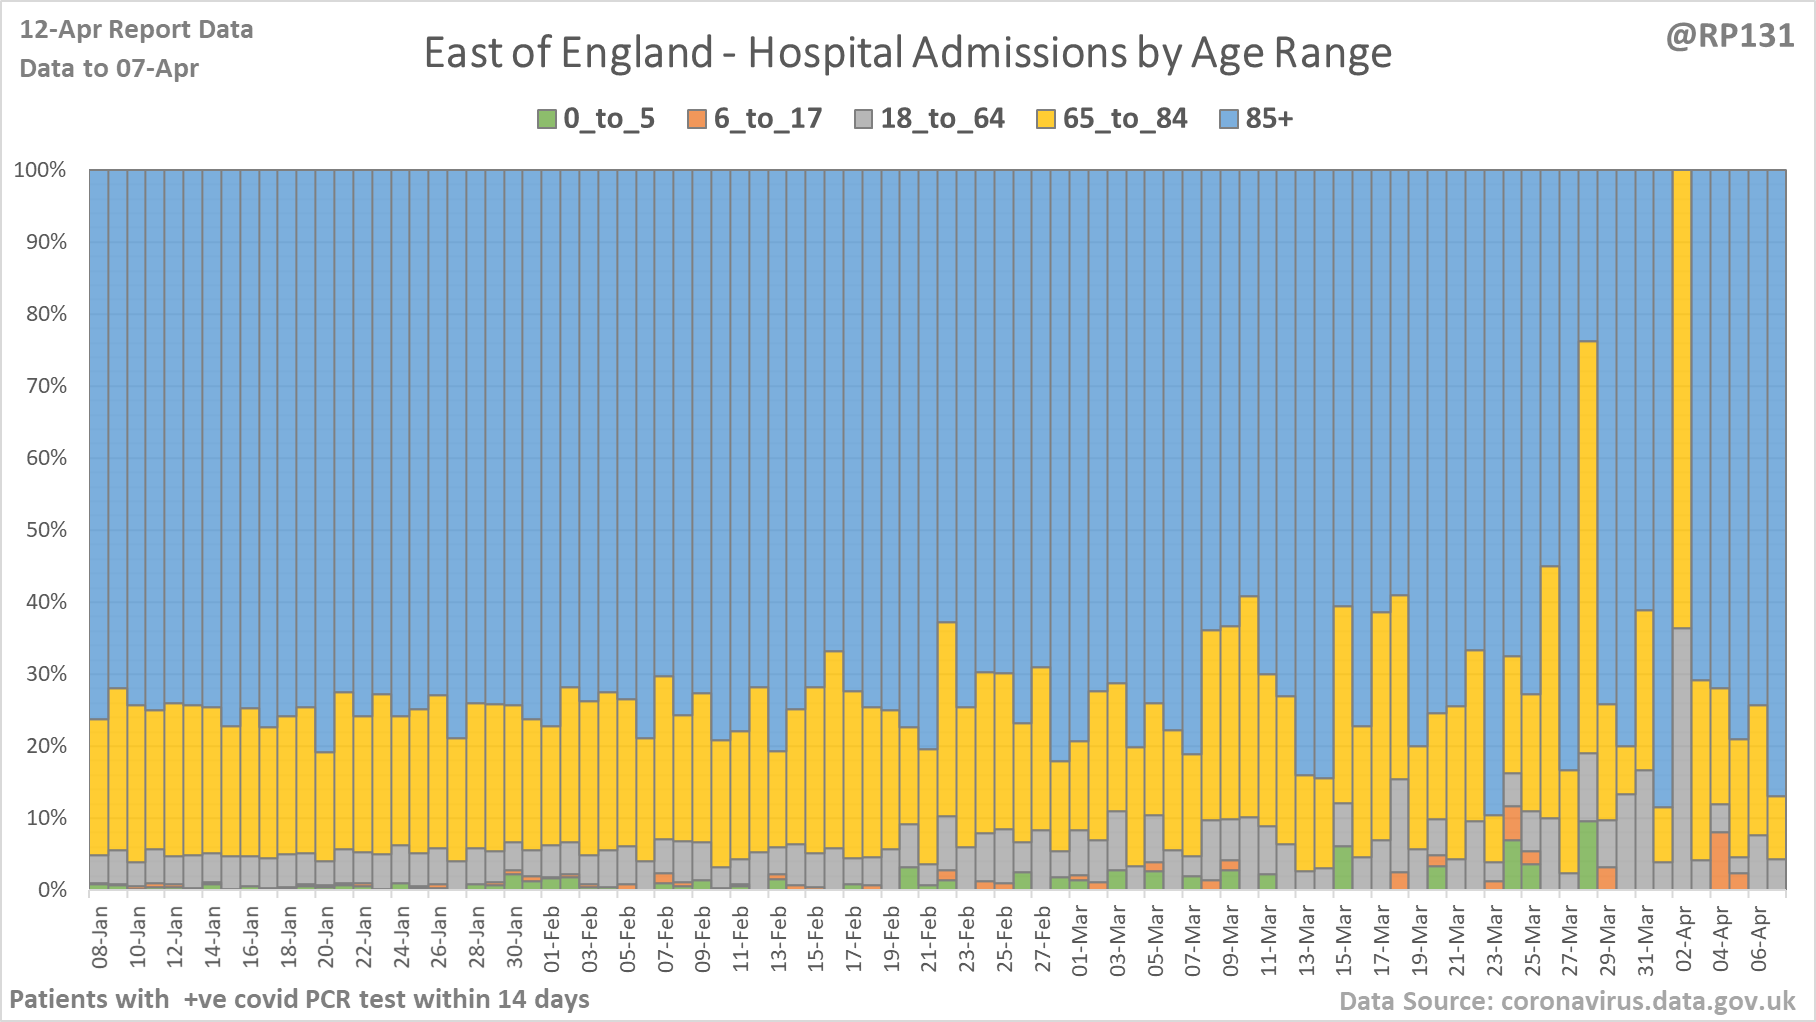
[9/20] Hospital age ranges of admissions for NHS regions London, East of England, South East and South West.
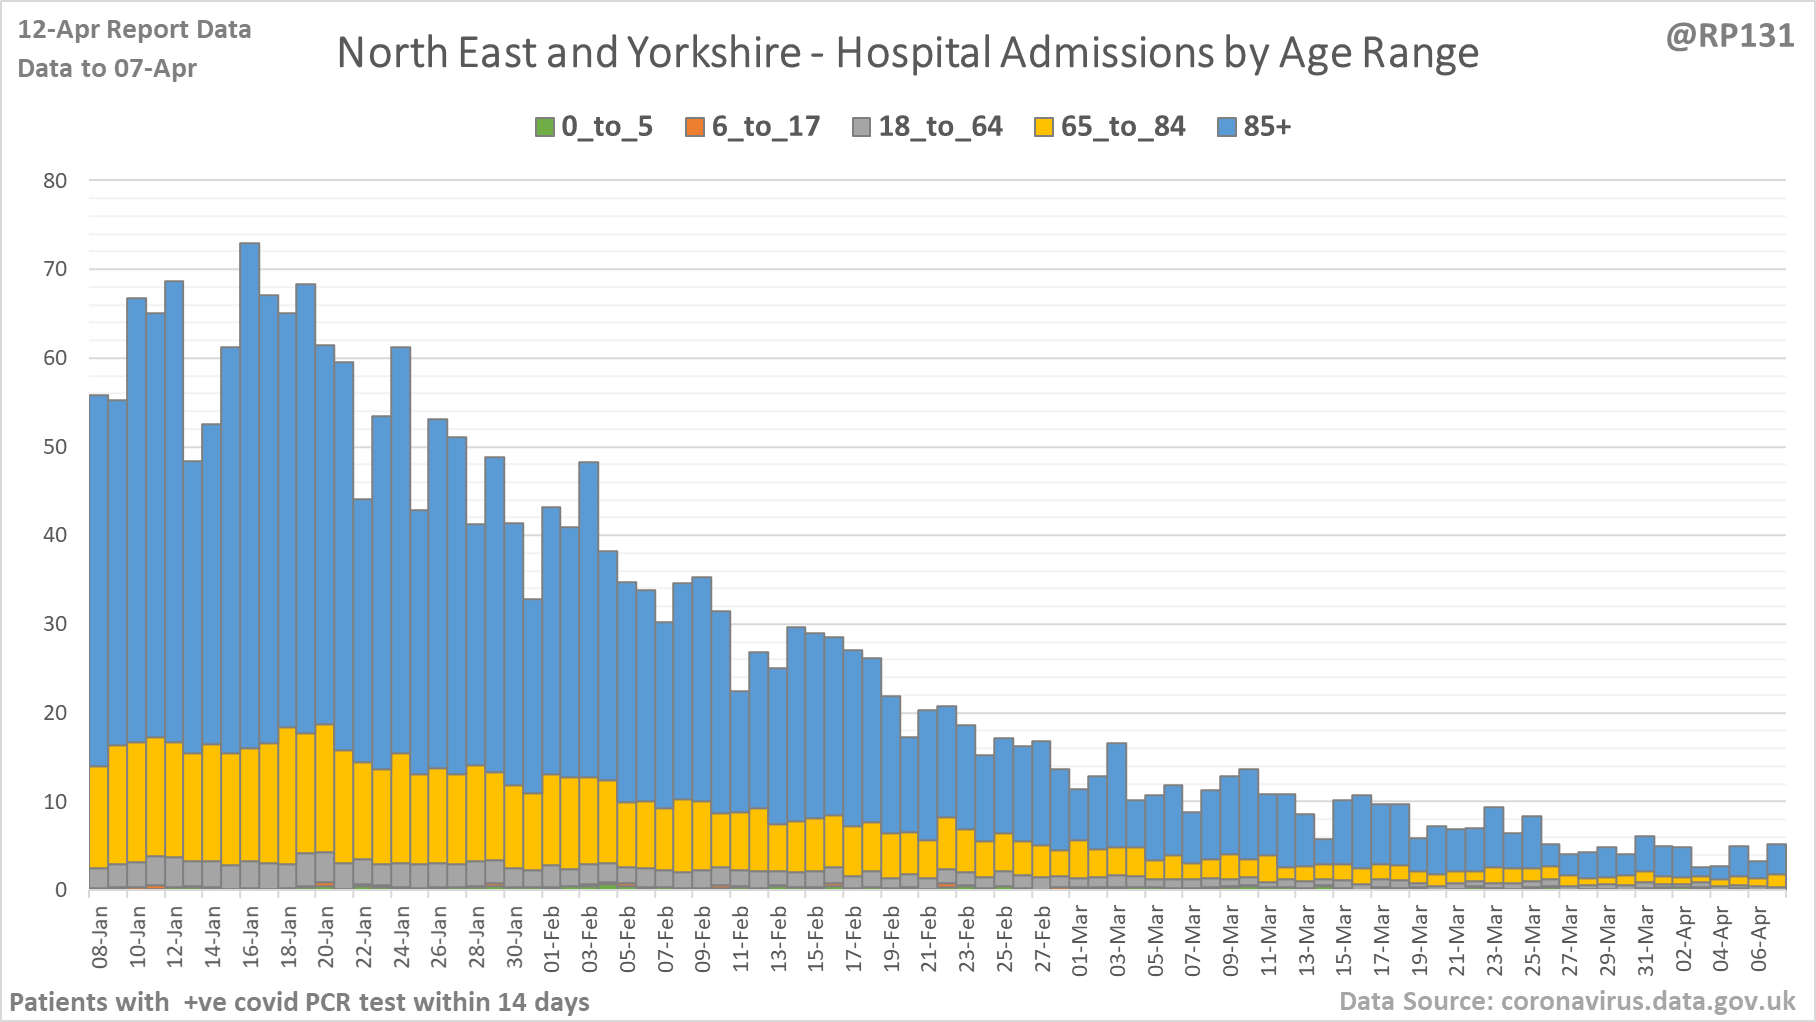
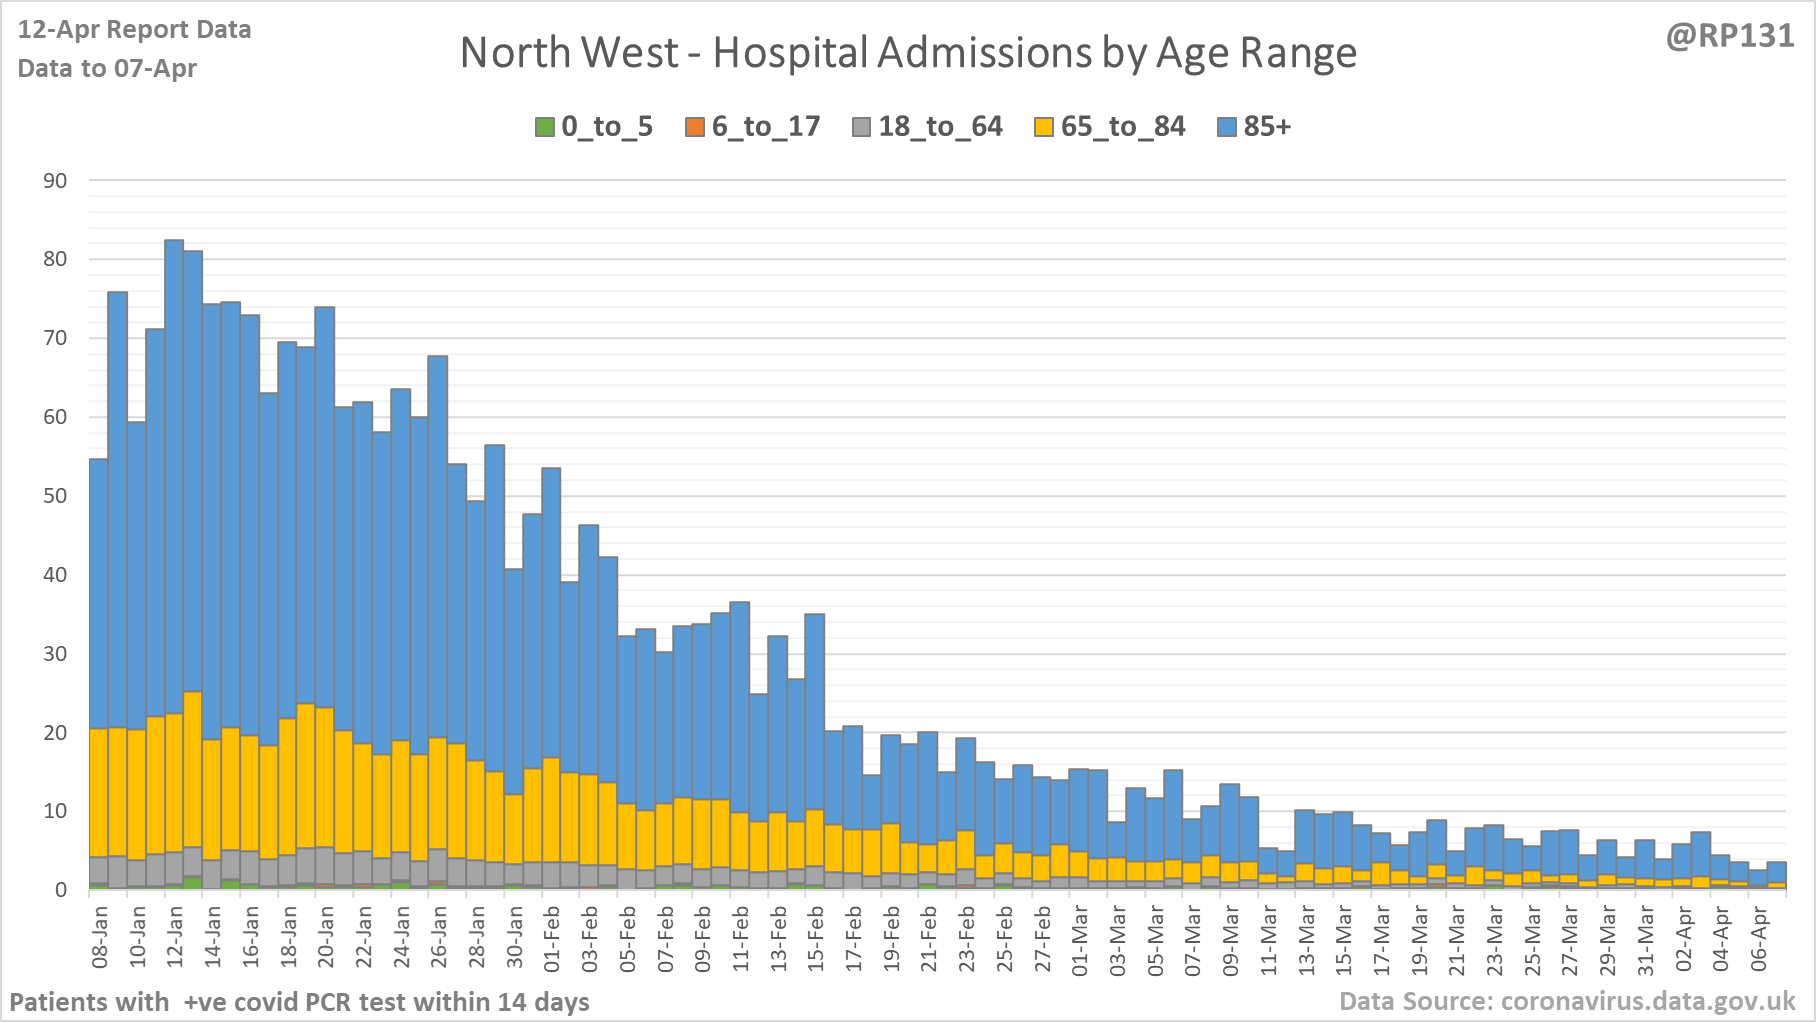
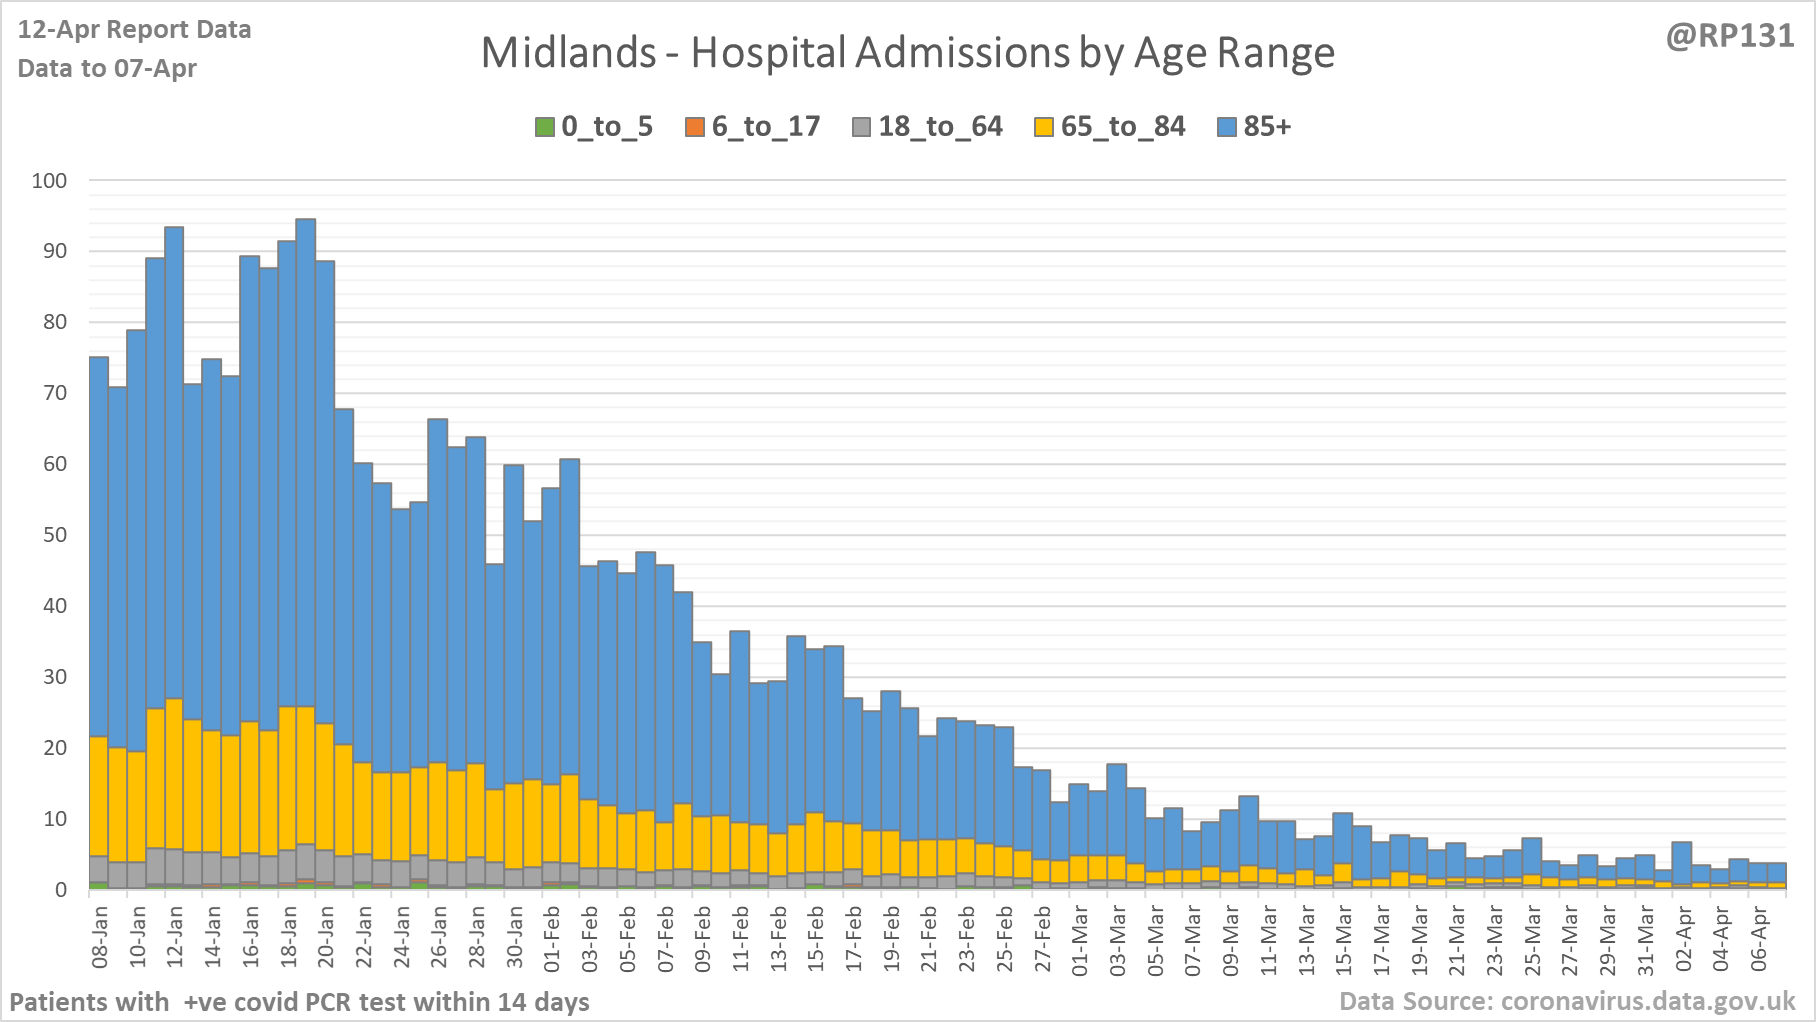
[10/20] Hospital age ranges of admissions for NHS regions North East & Yorkshire, North West and Midlands.
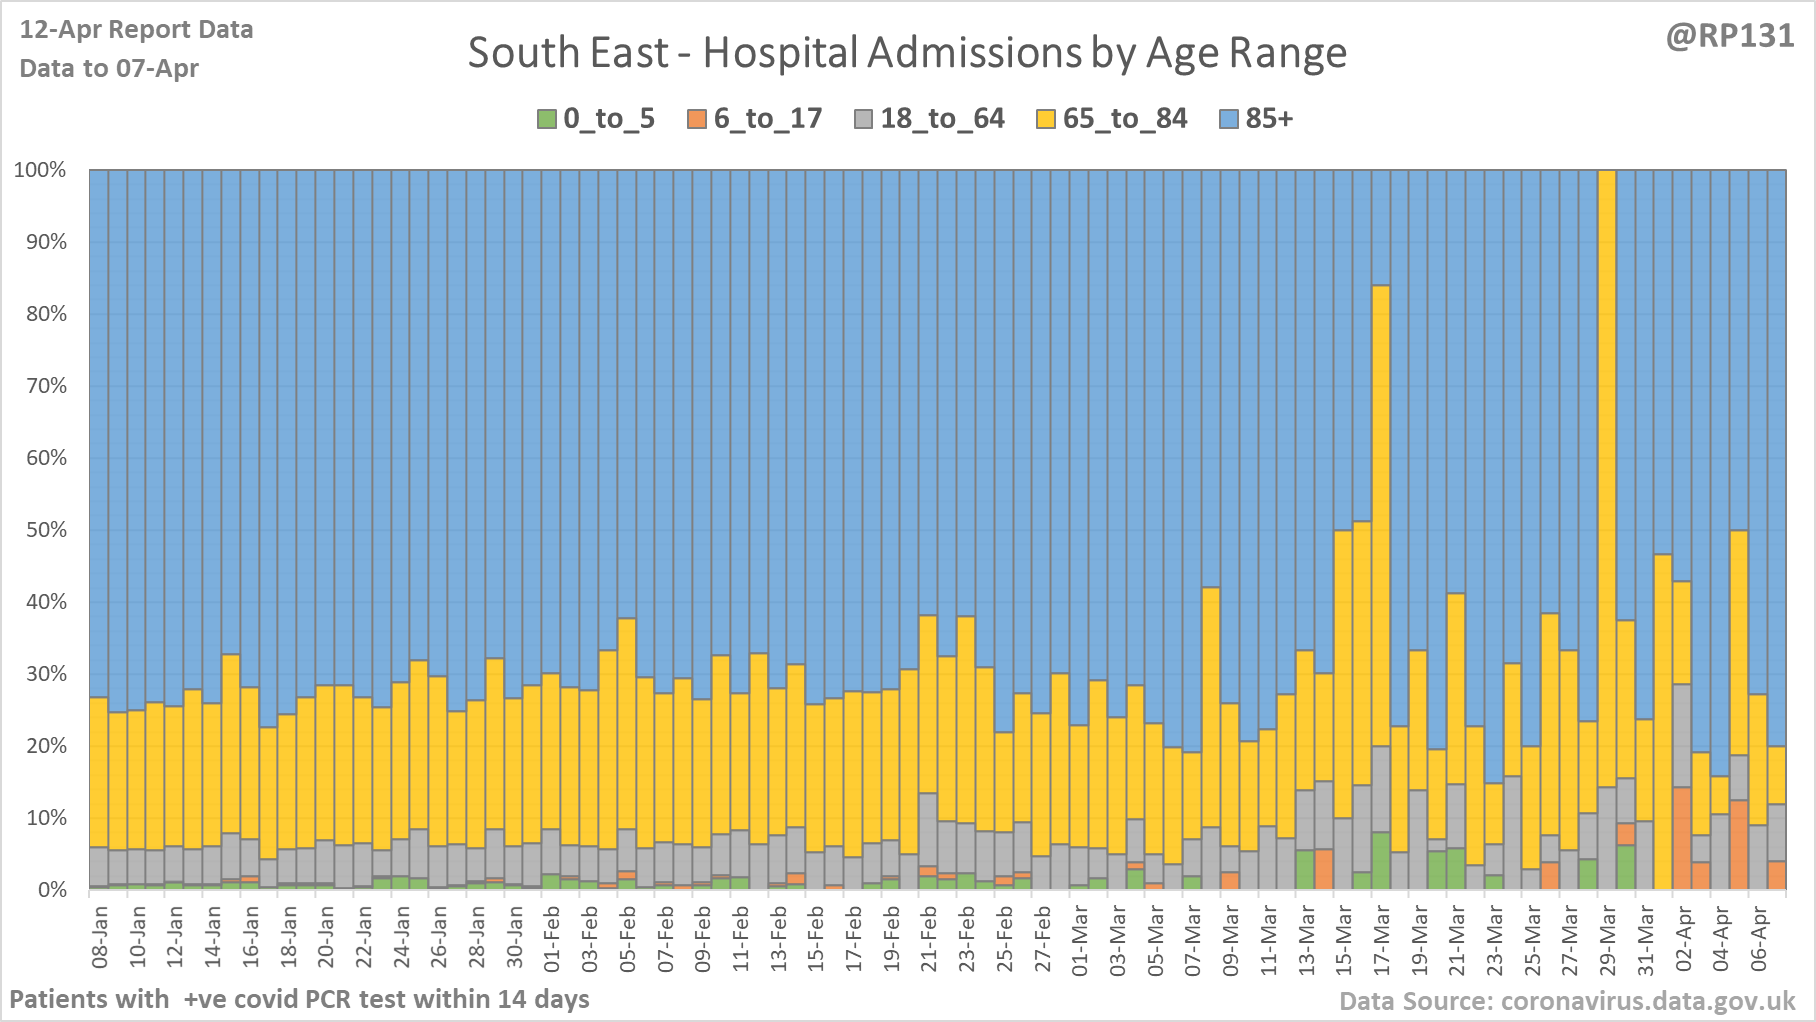
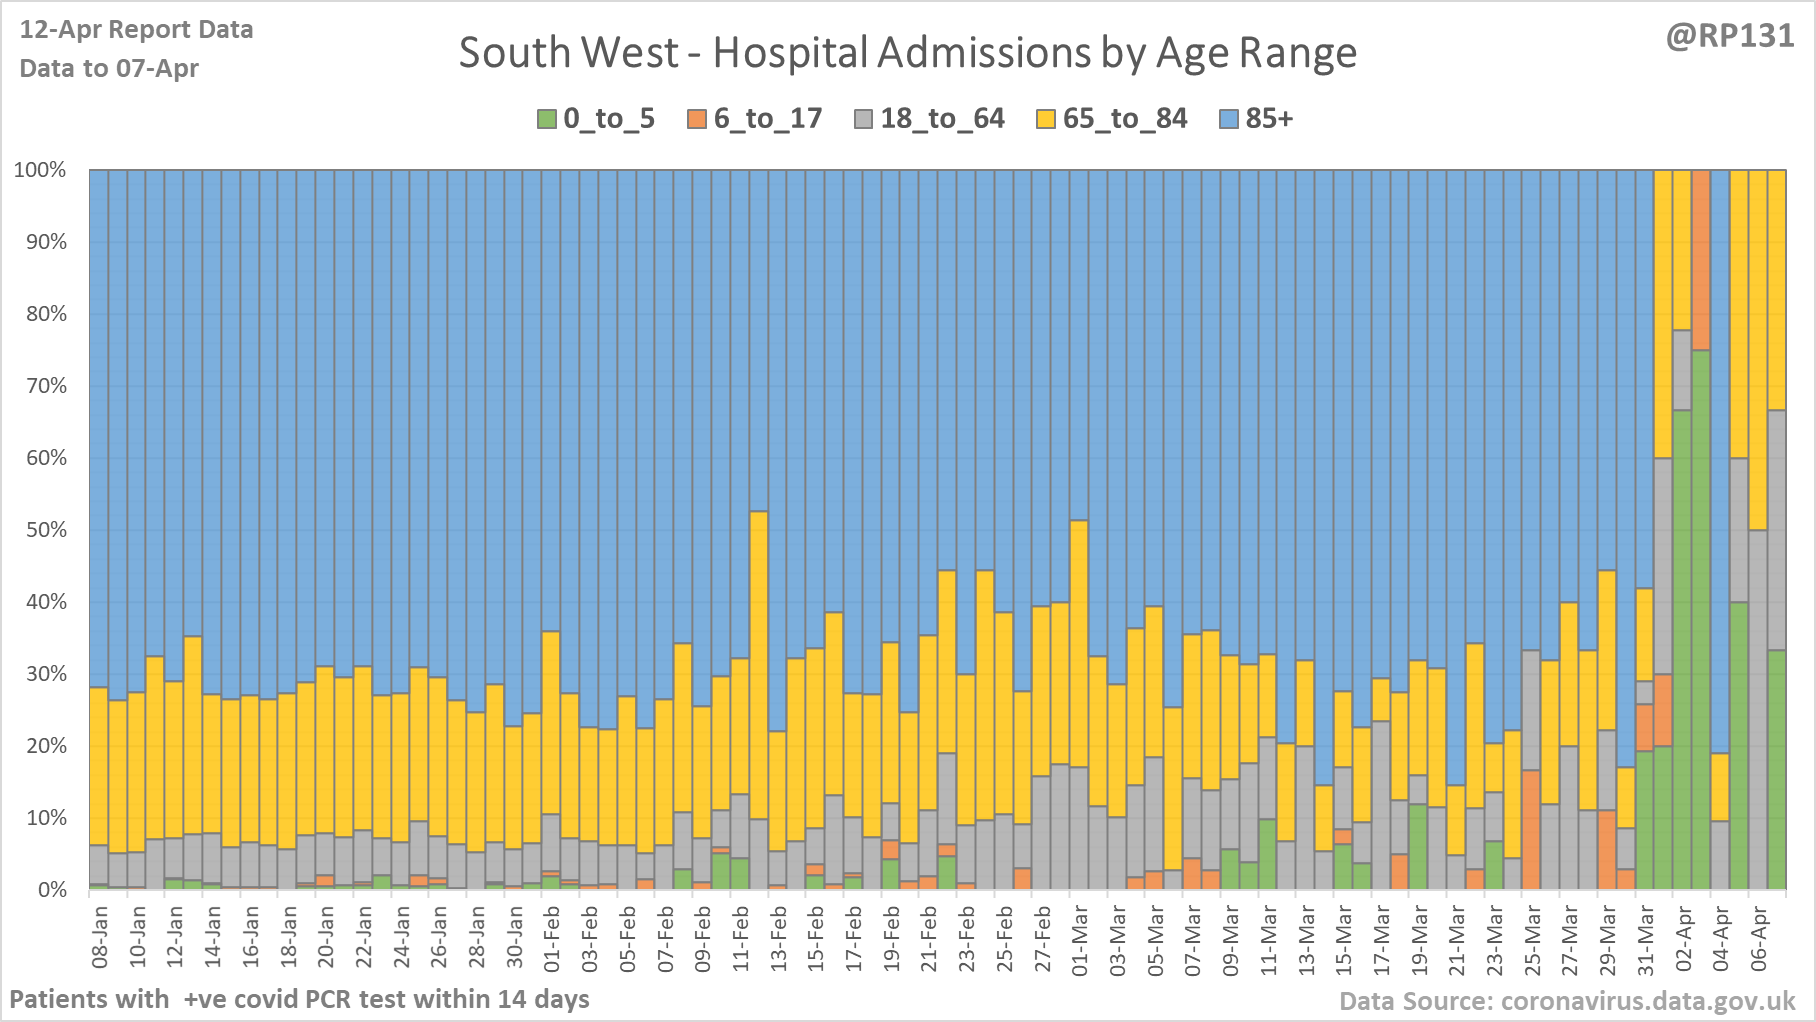
[11/20] Percentage view of hospital age ranges of admissions for NHS regions London, East of England, South East and South West.
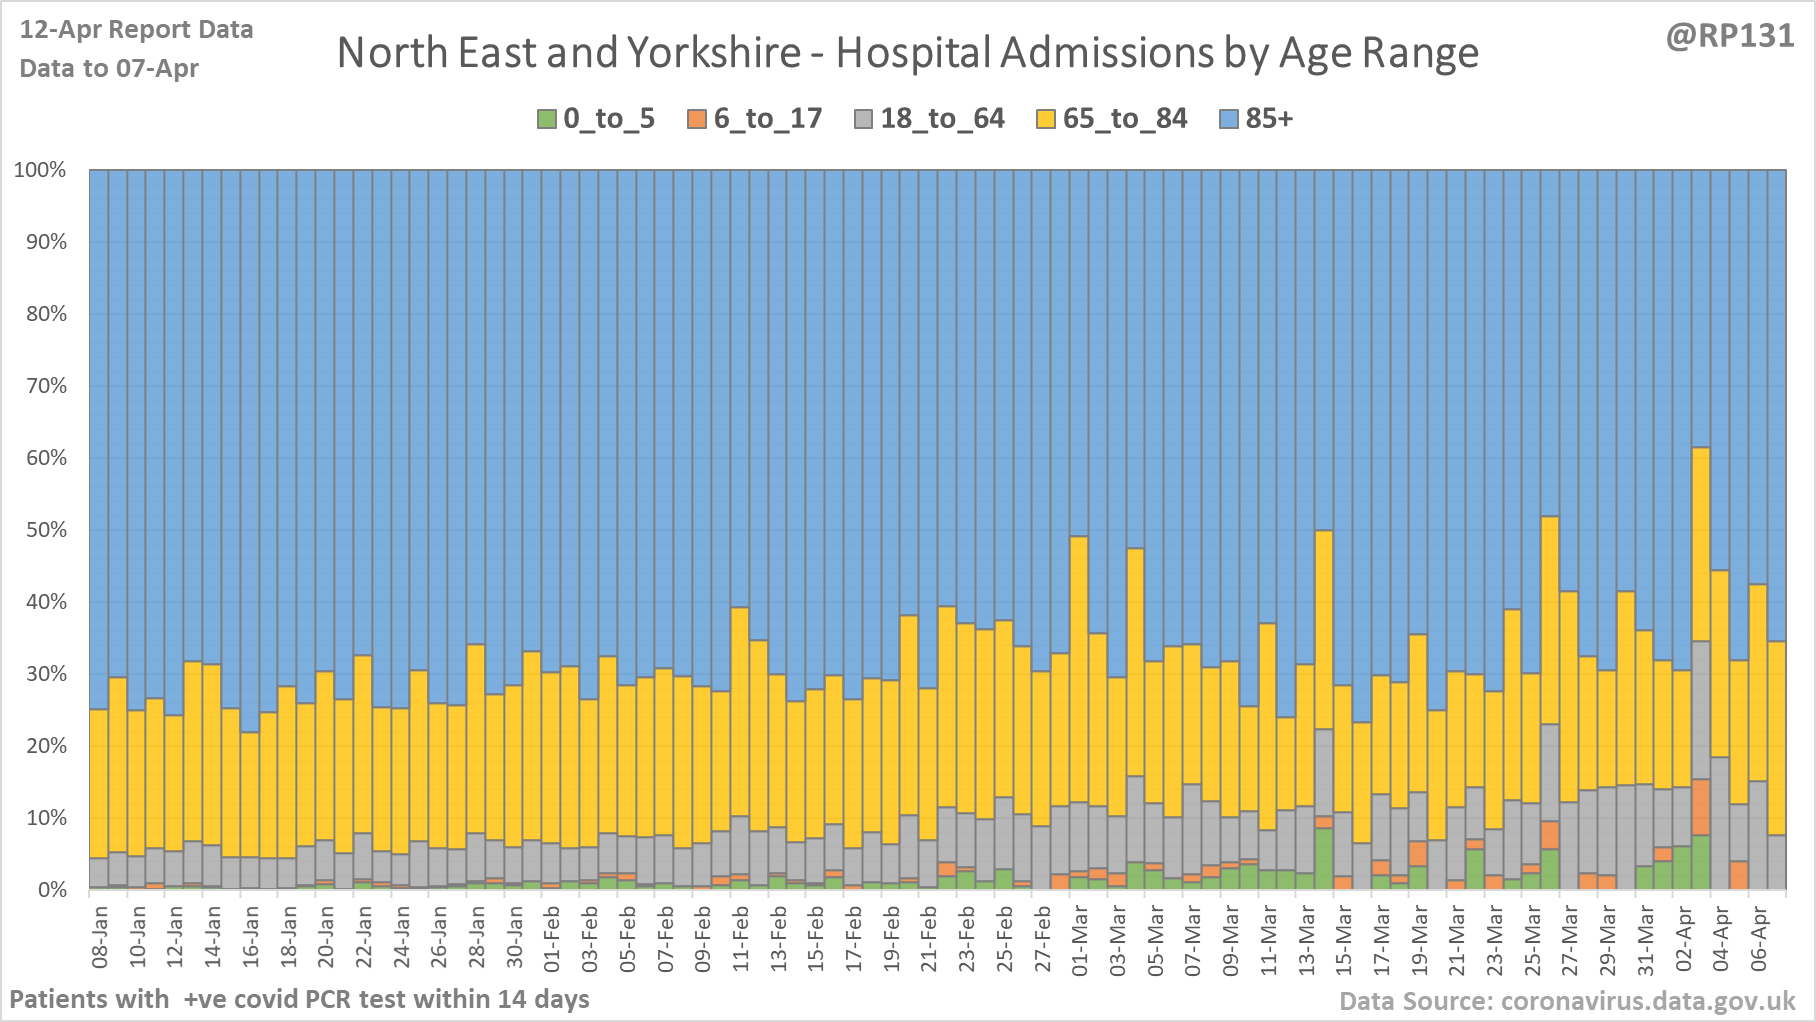
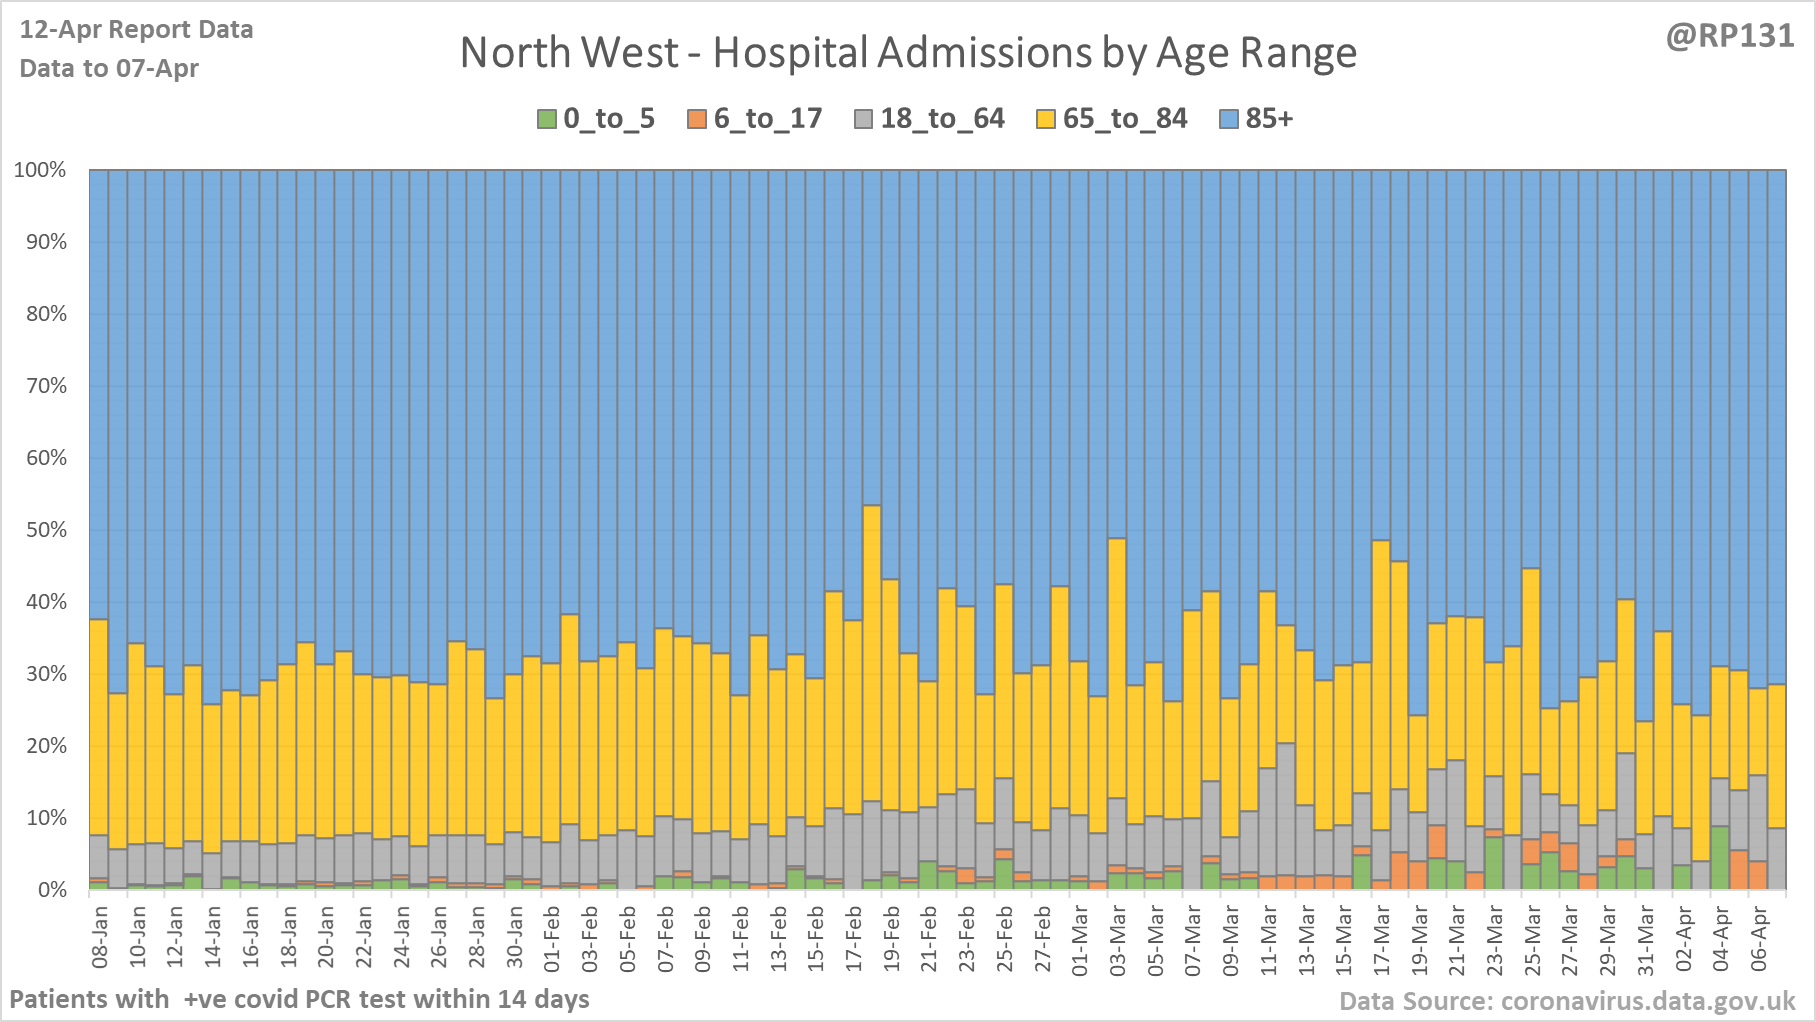
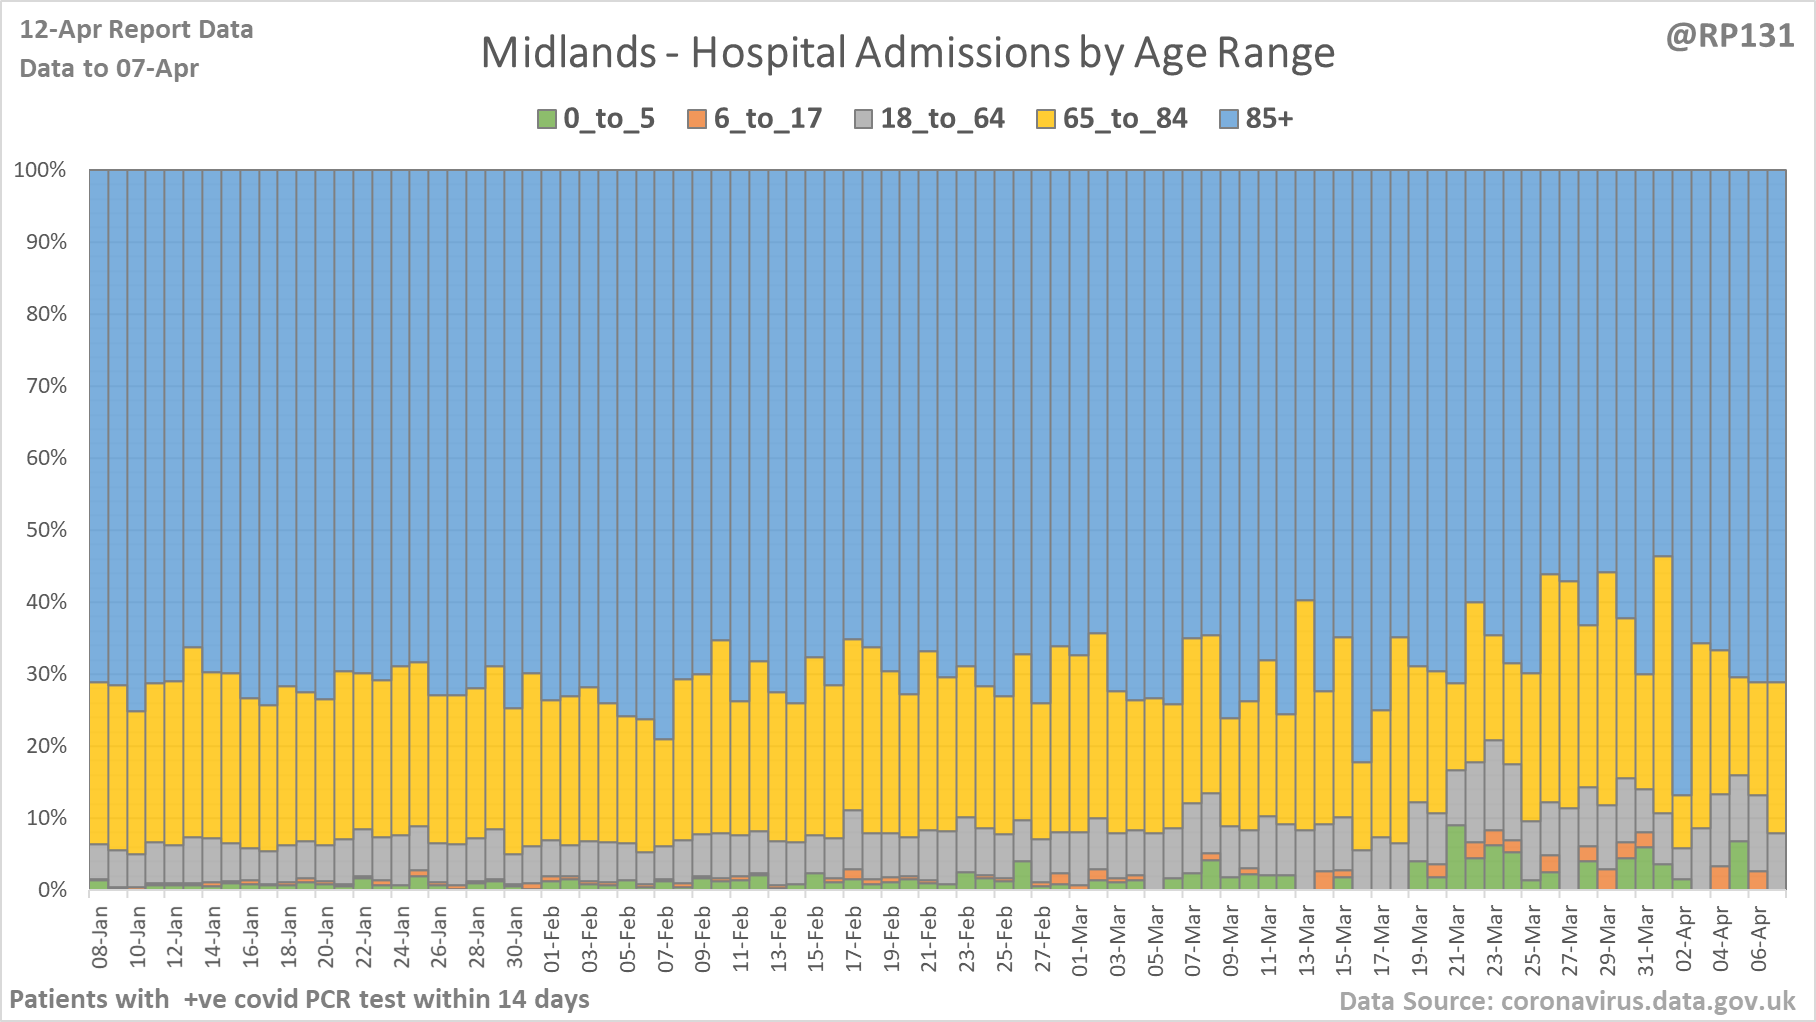
[12/20] Percentage view of hospital age ranges of admissions for NHS regions North East & Yorkshire, North West and Midlands.
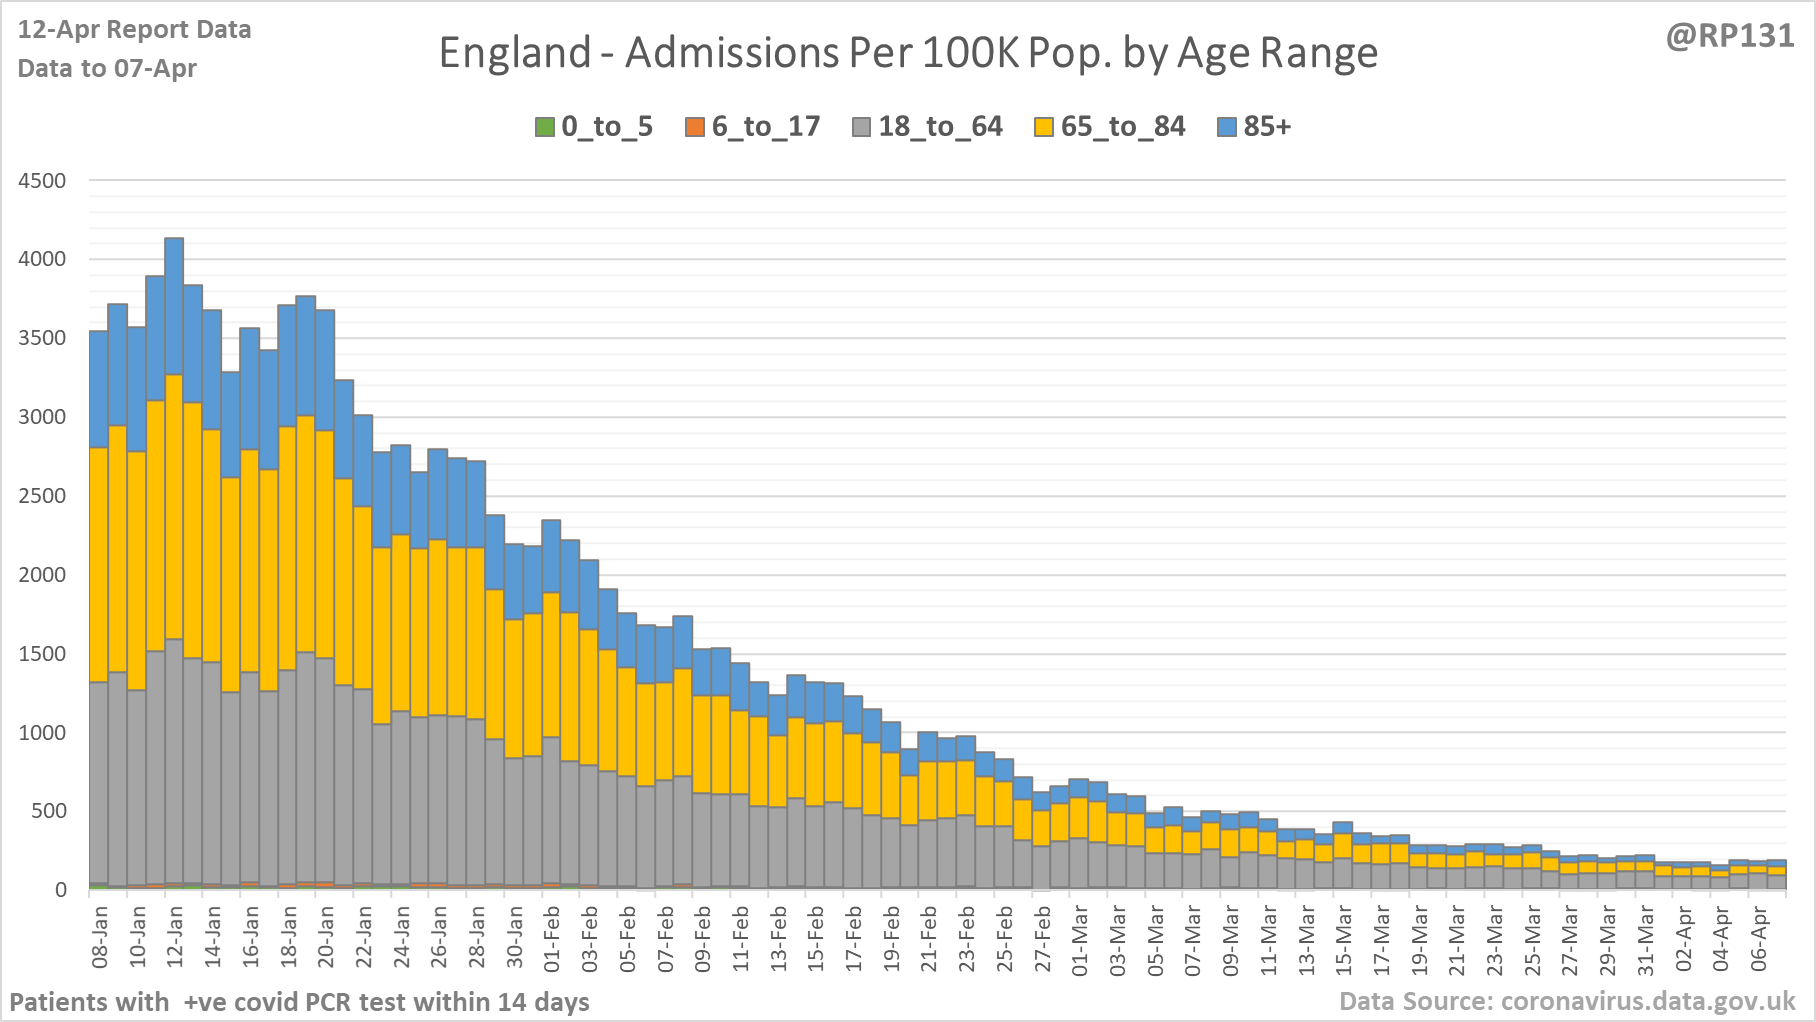
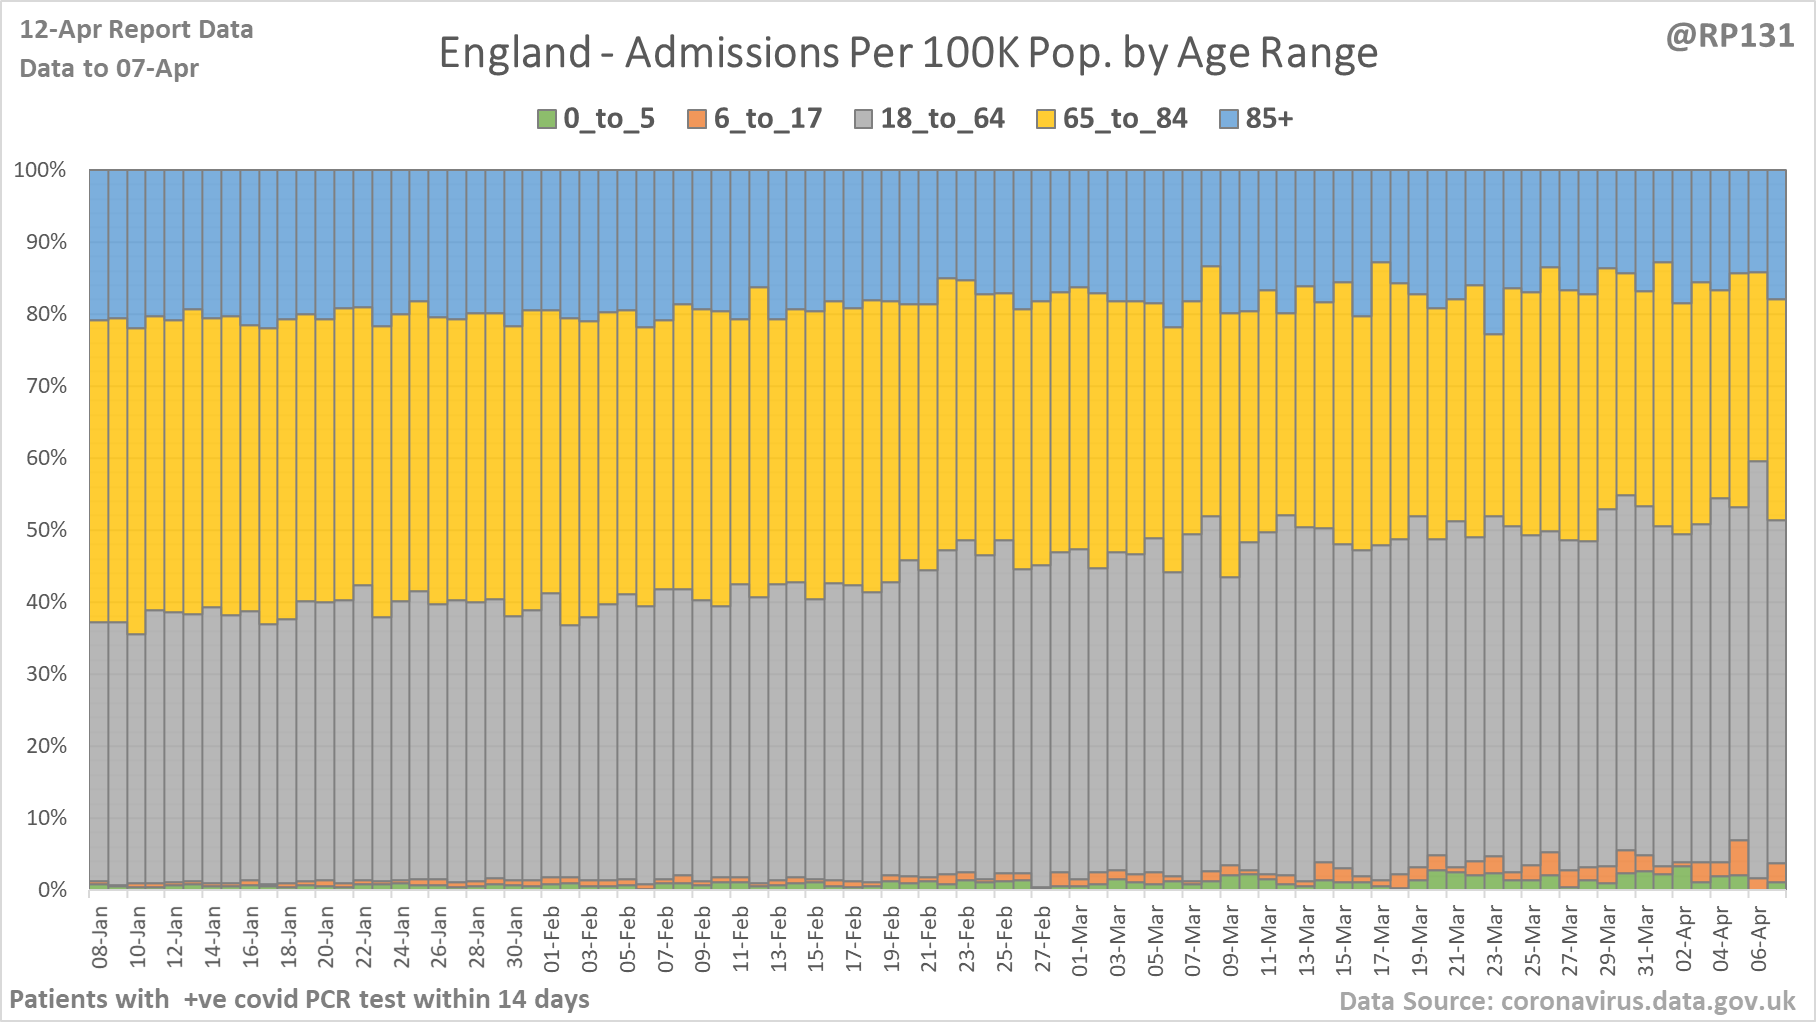
[13/20] Age ranges of England hospital admissions, per 100K of population. Note this age-range data lags a day or so behind the above totals data.
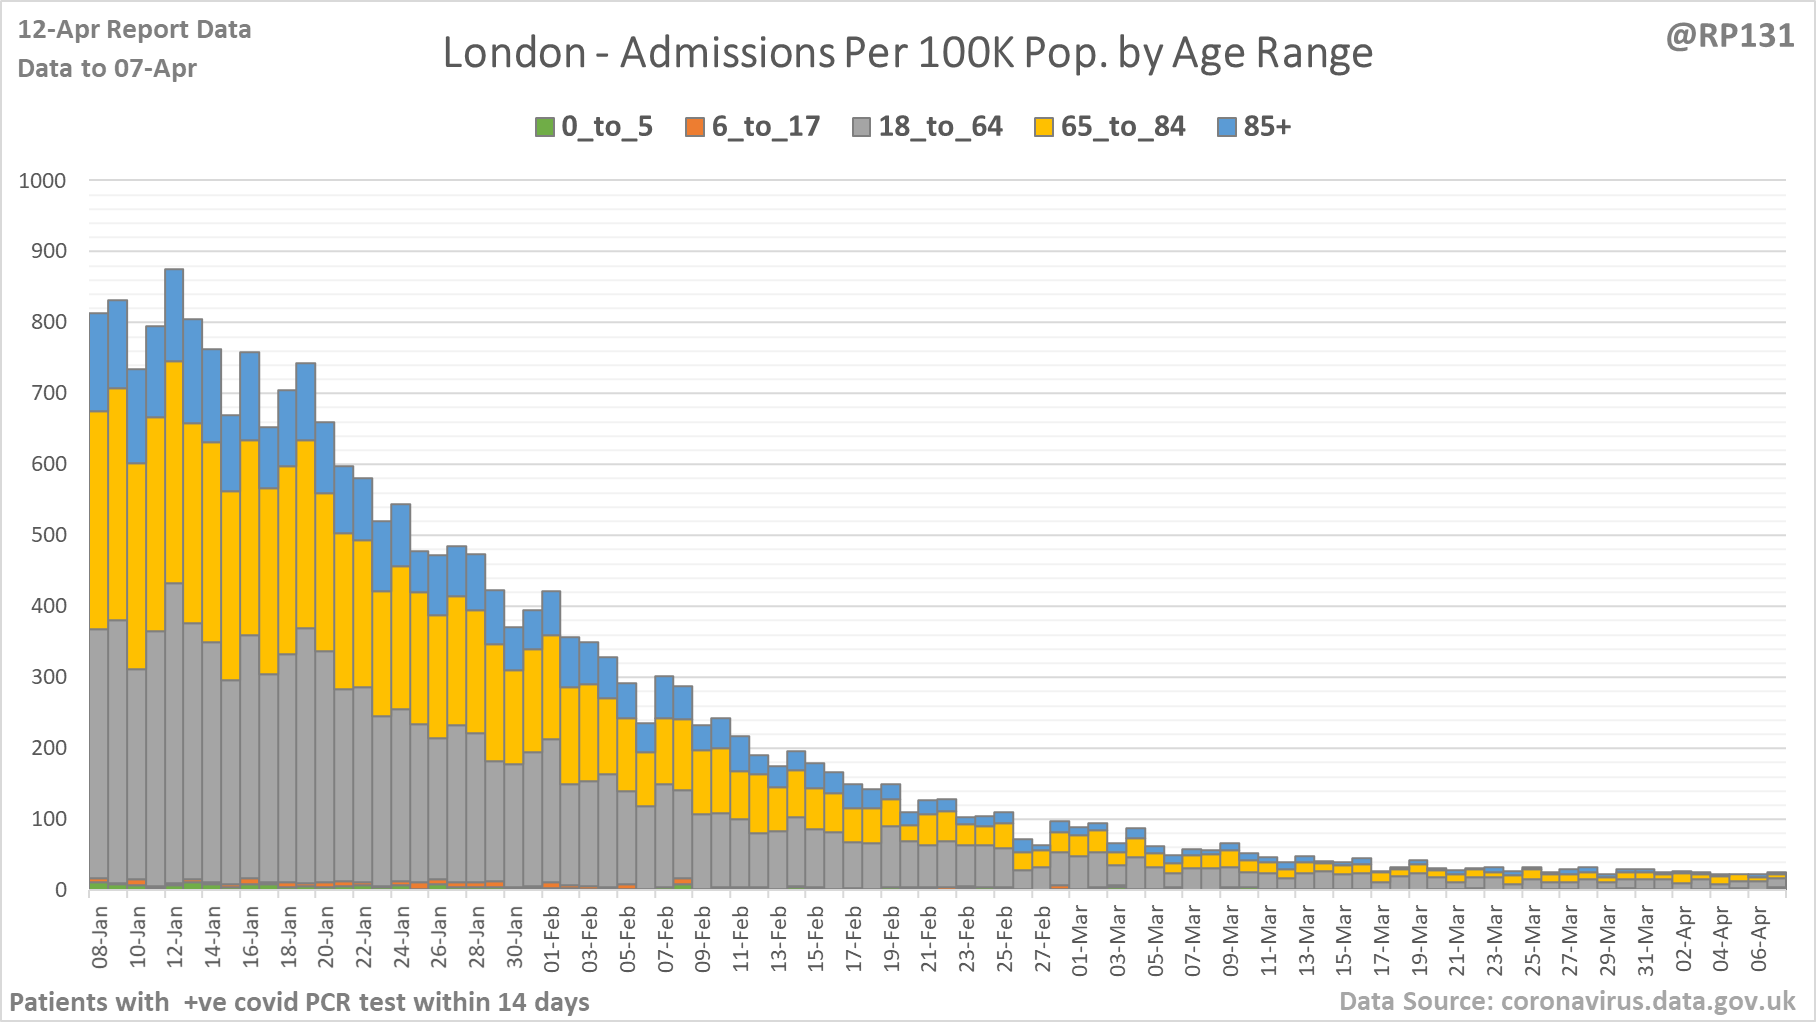
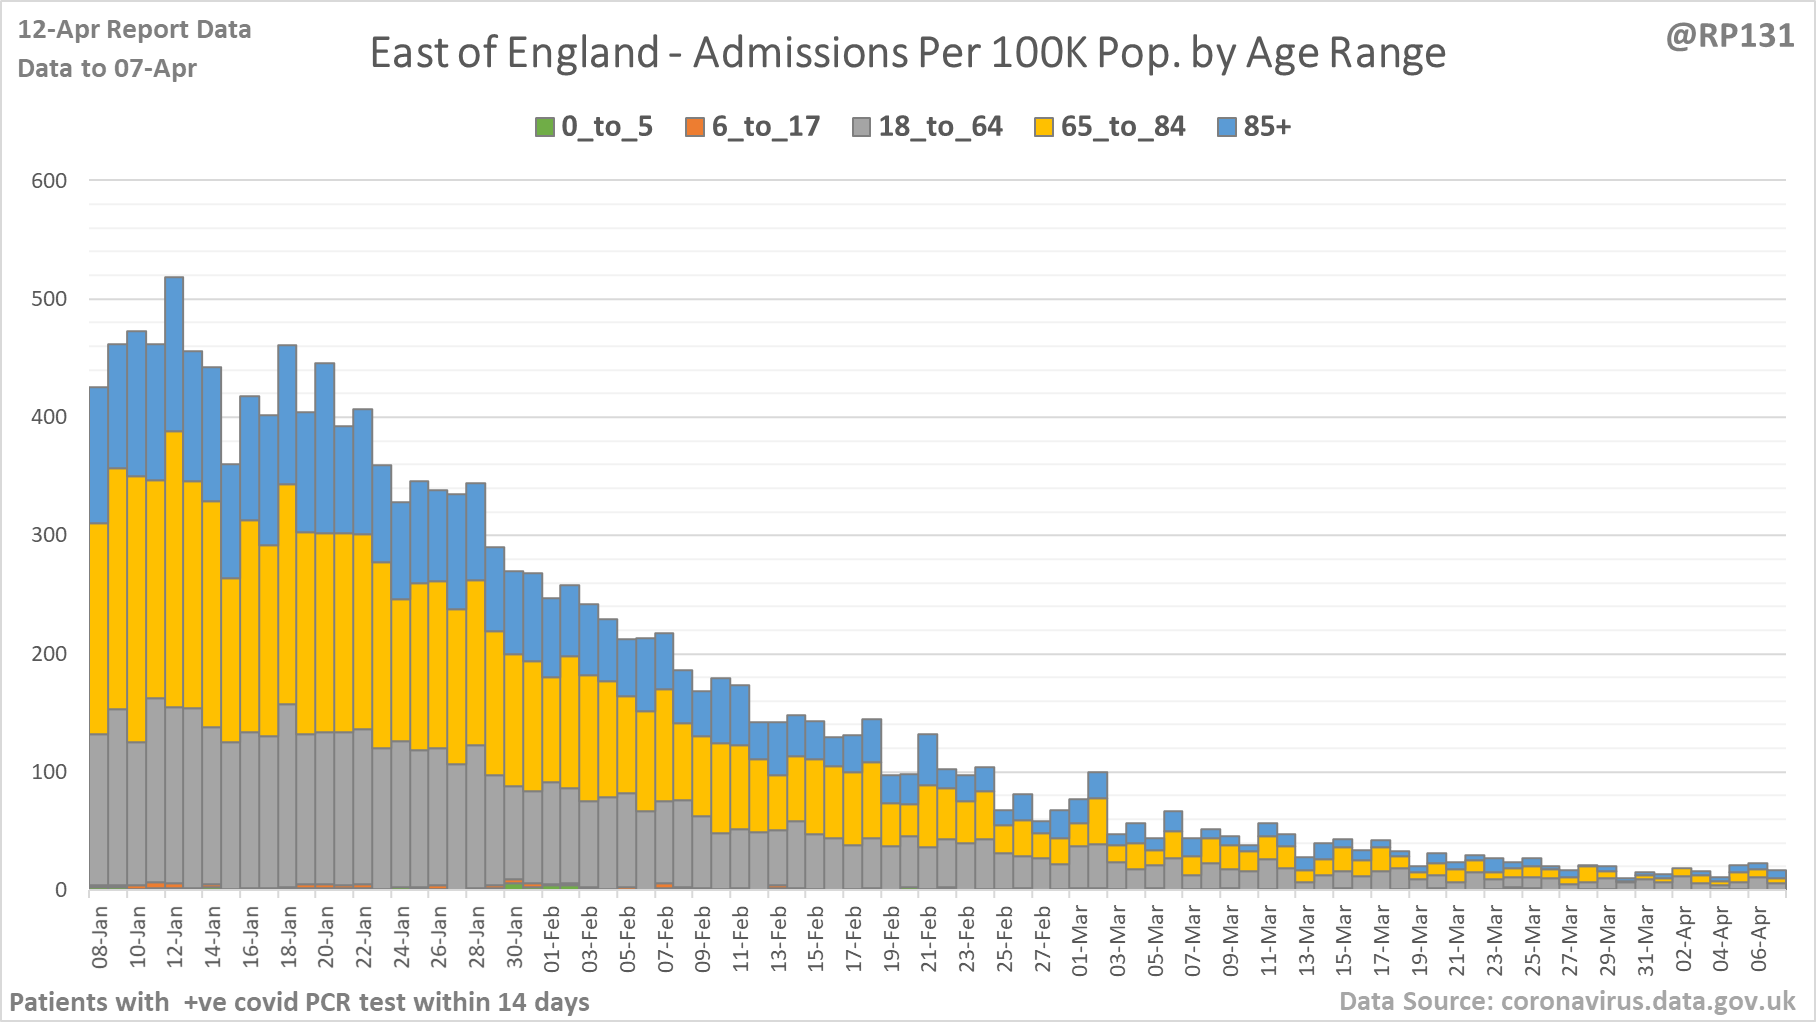
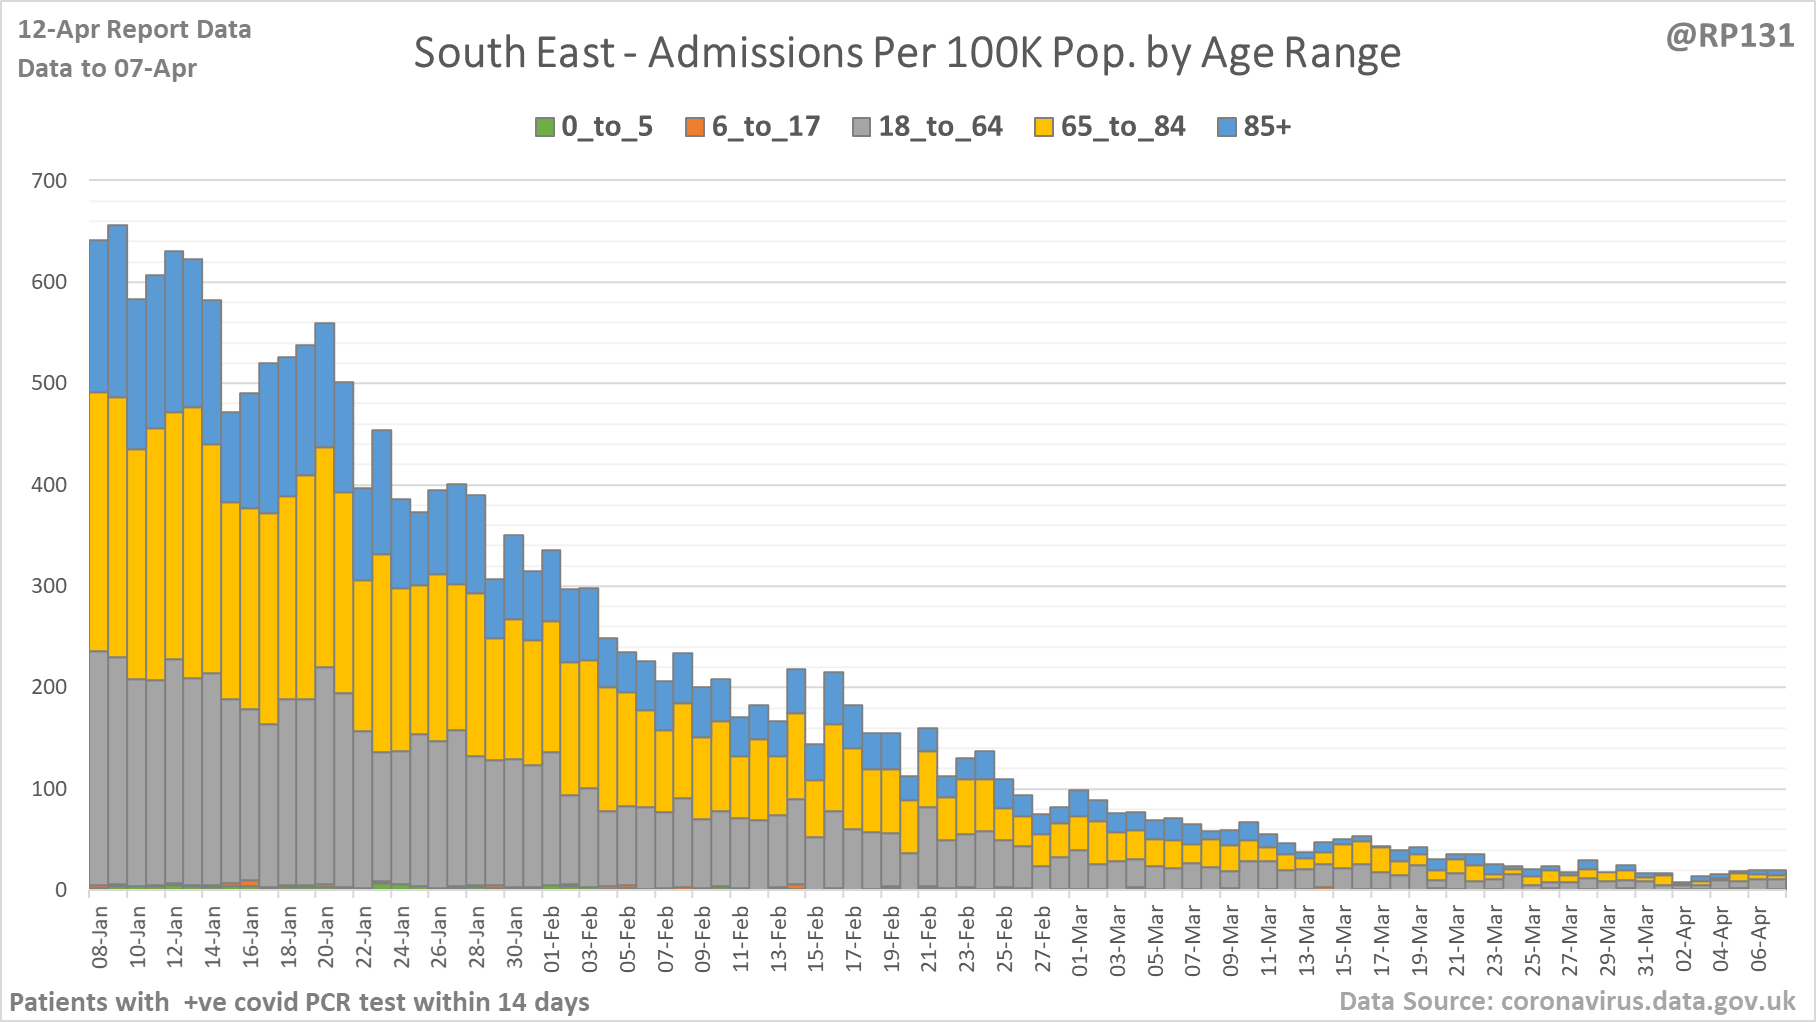
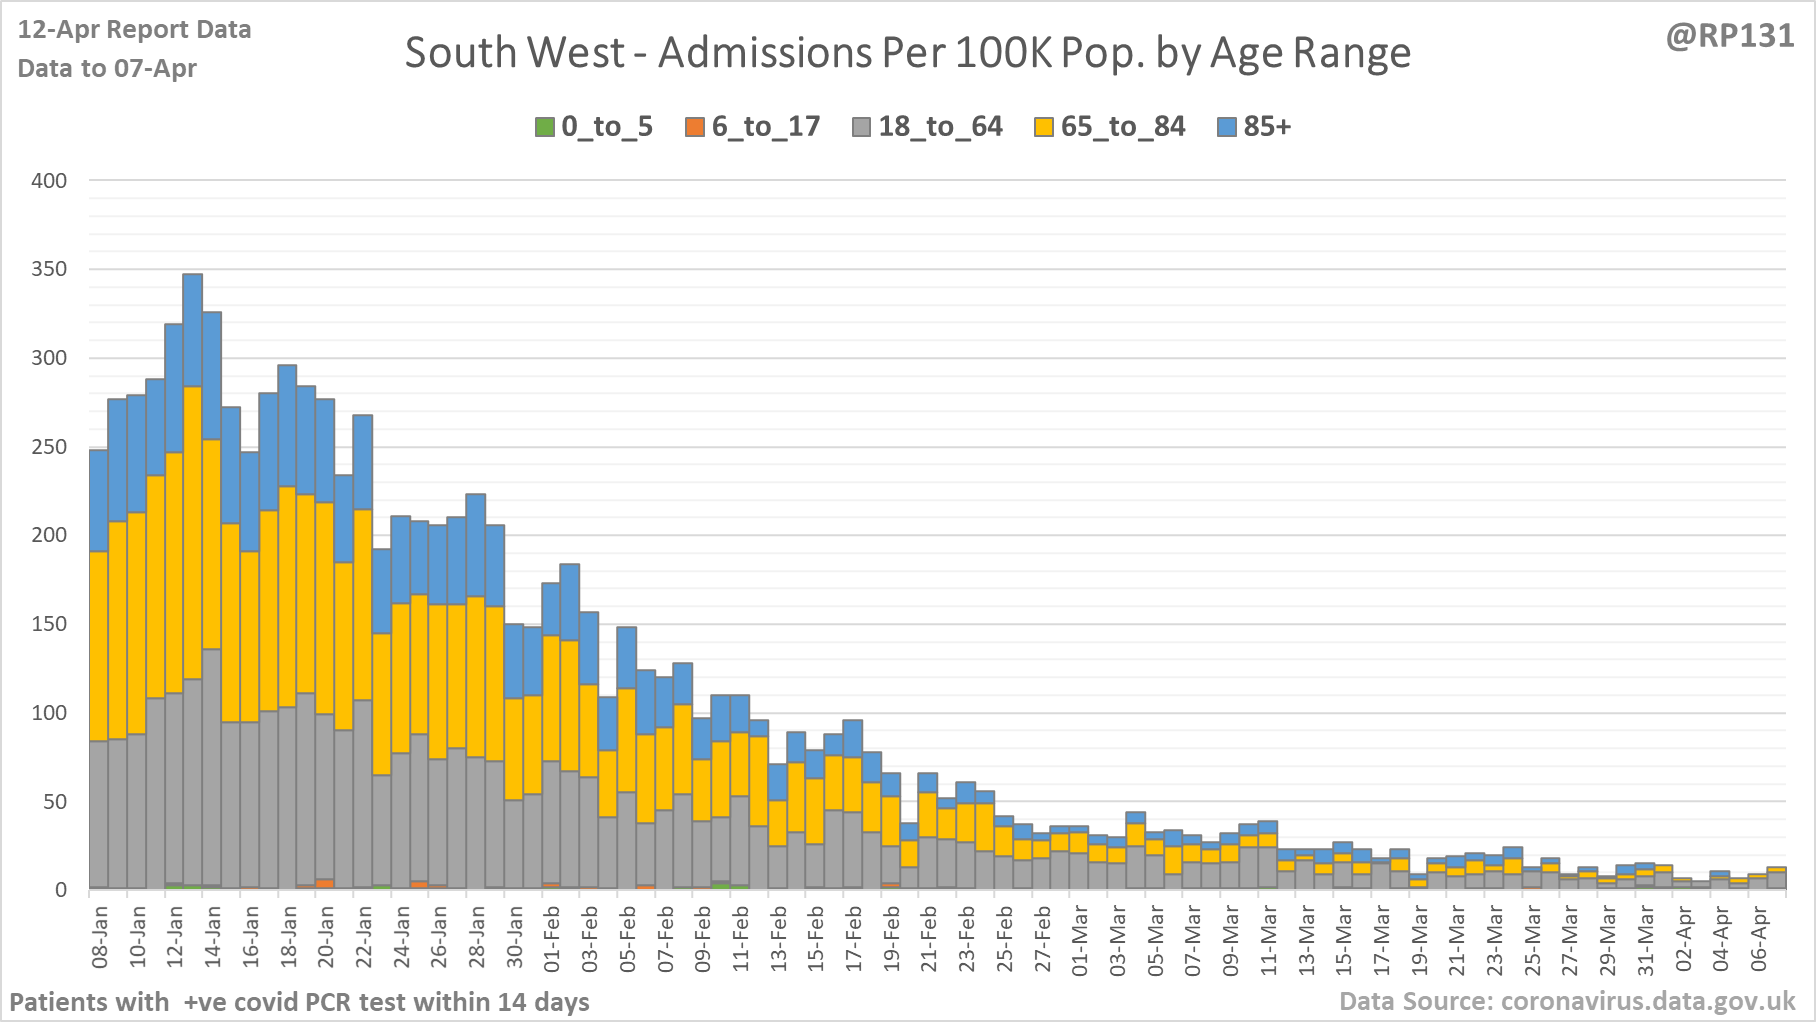
[15/20] Hospital age ranges of admissions (per 100K population) for NHS regions London, East of England, South East and South West.
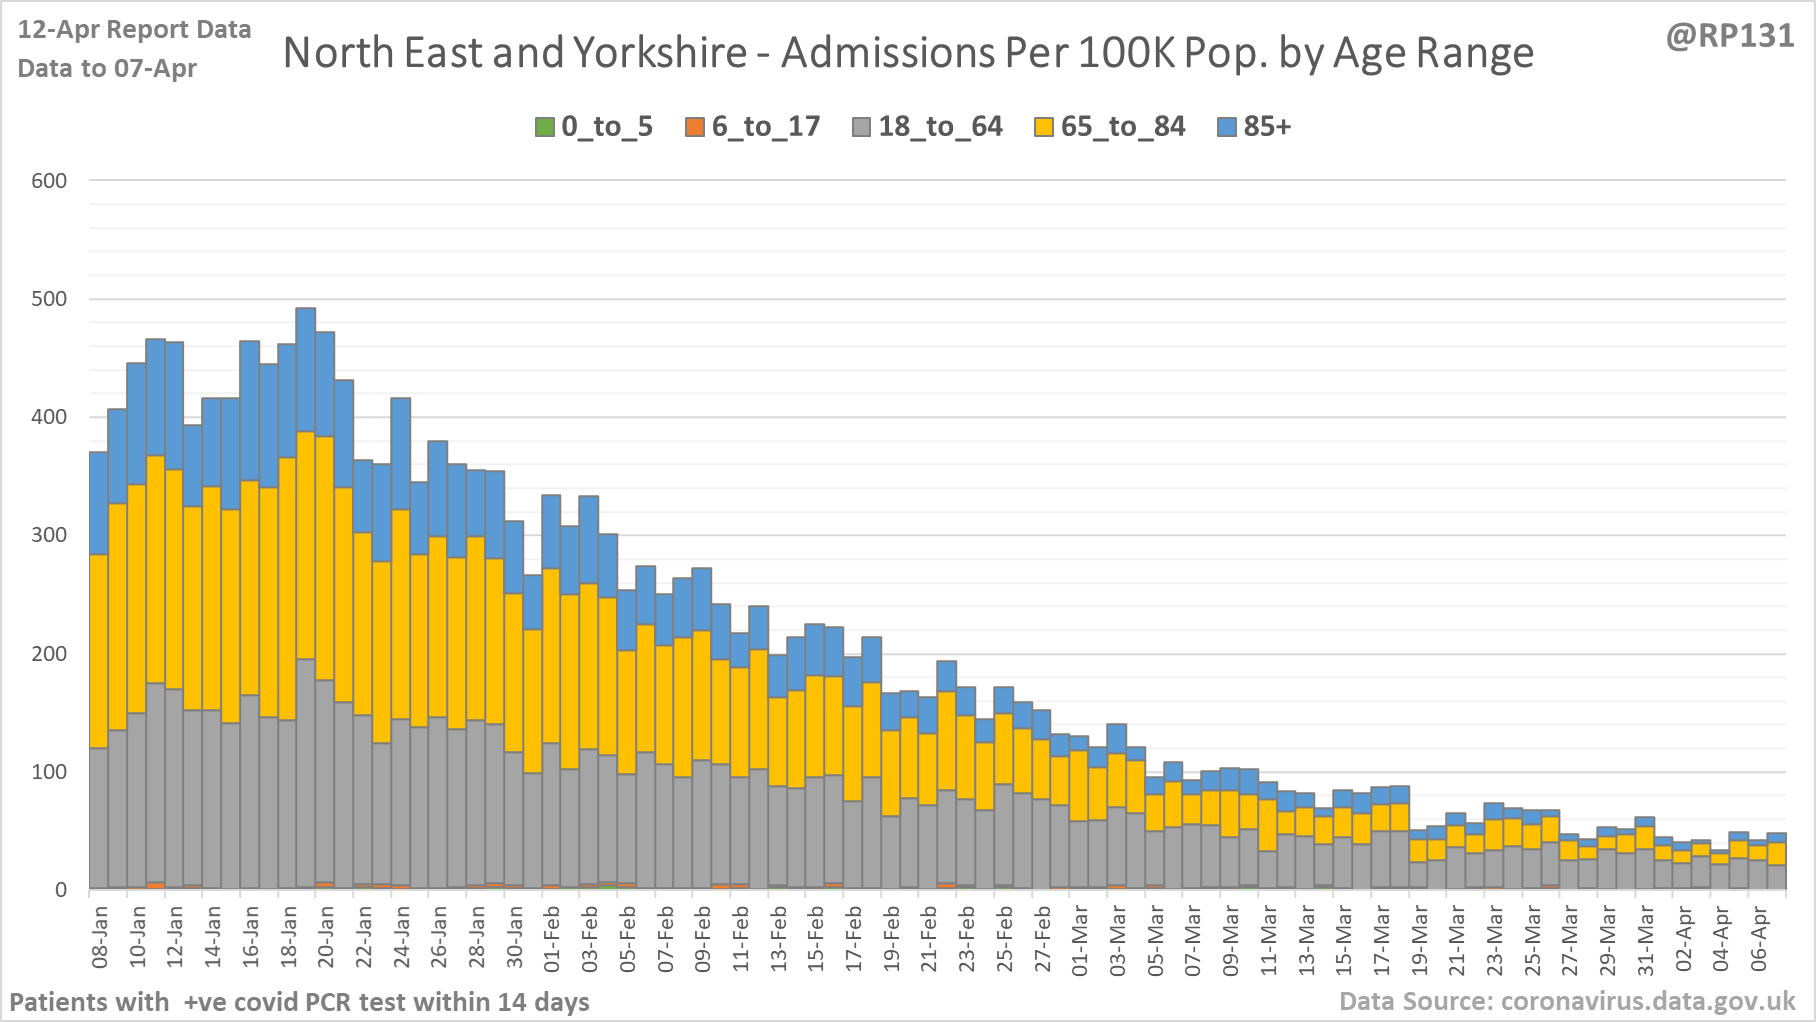
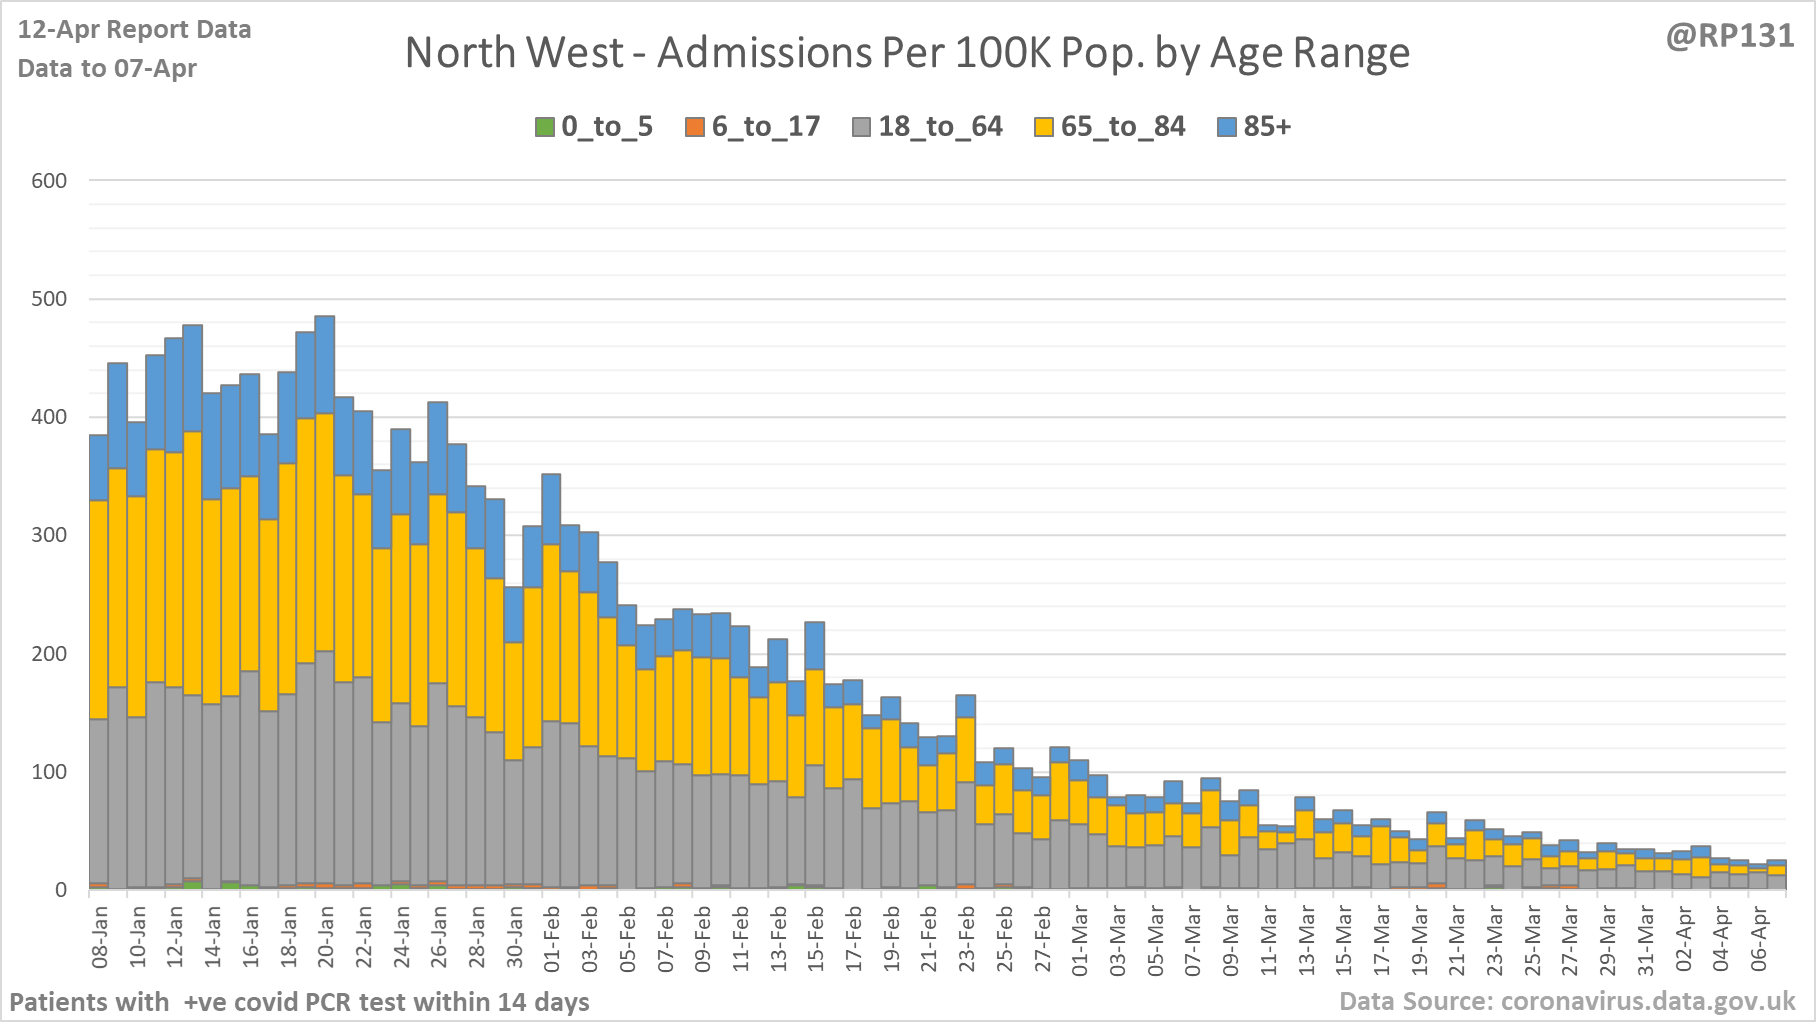
[16/20] Hospital age ranges of admissions (per 100K population) for NHS regions North East & Yorkshire, North West and Midlands.
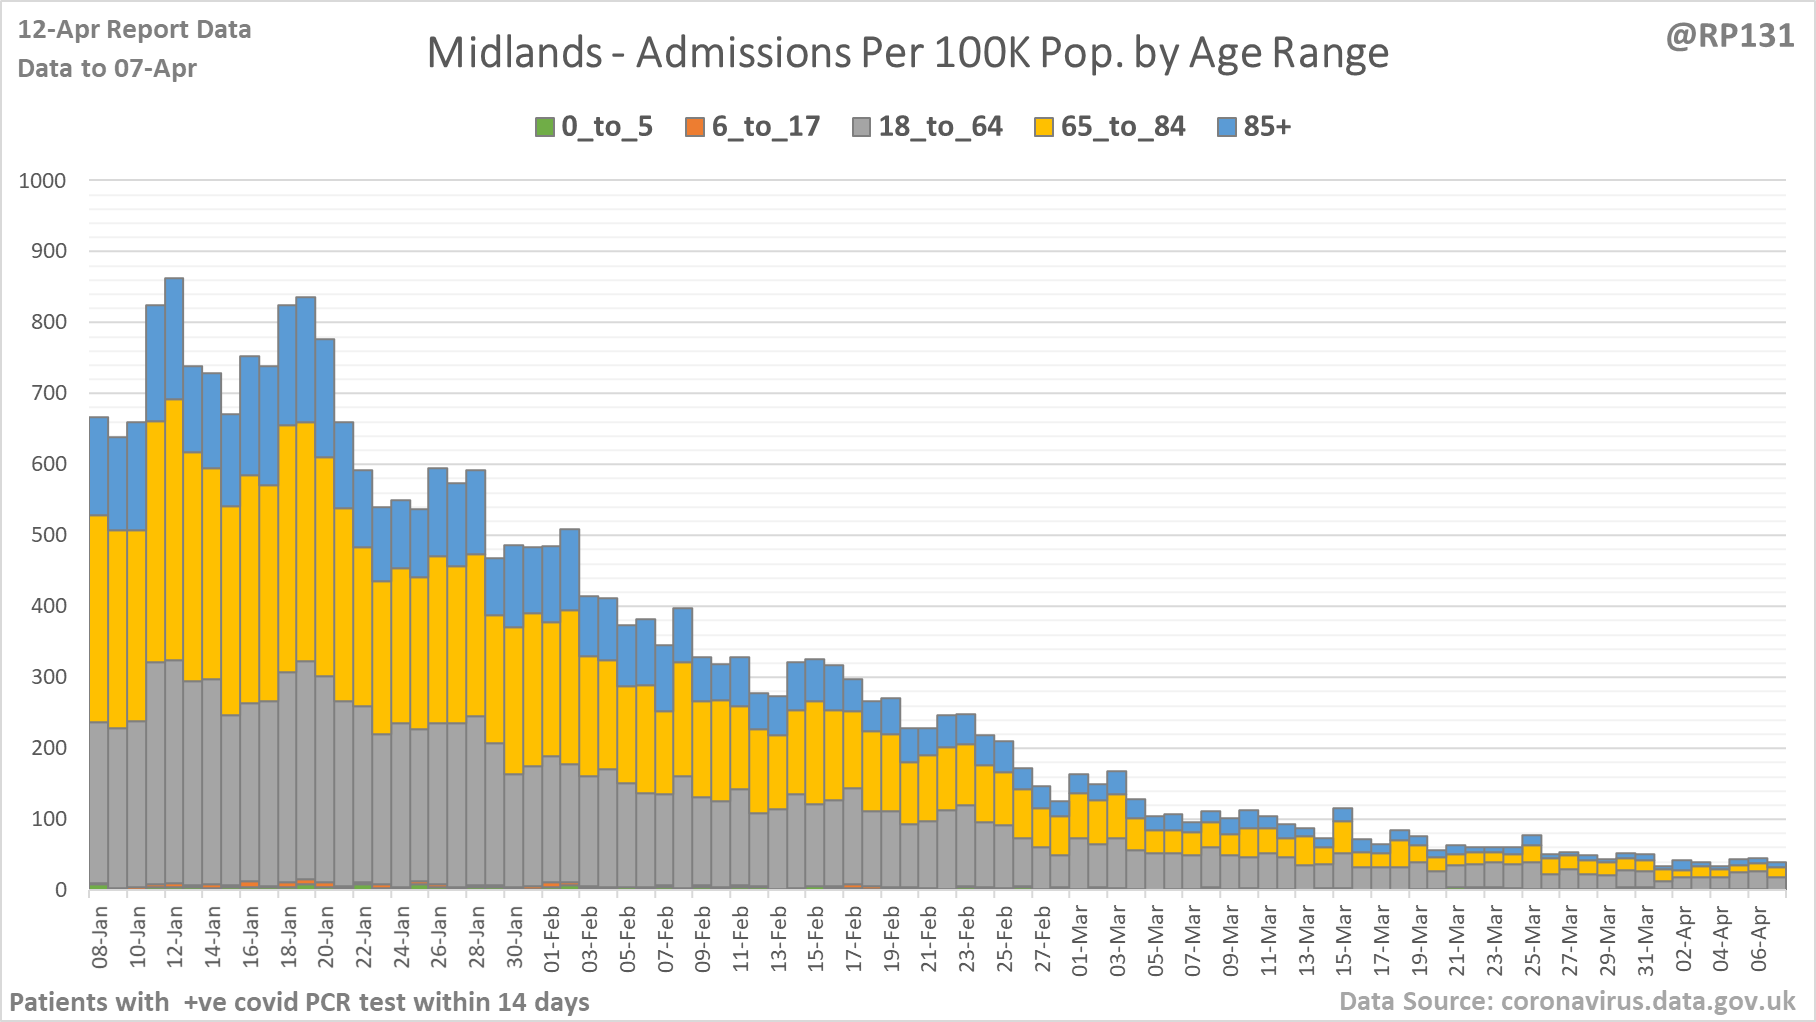
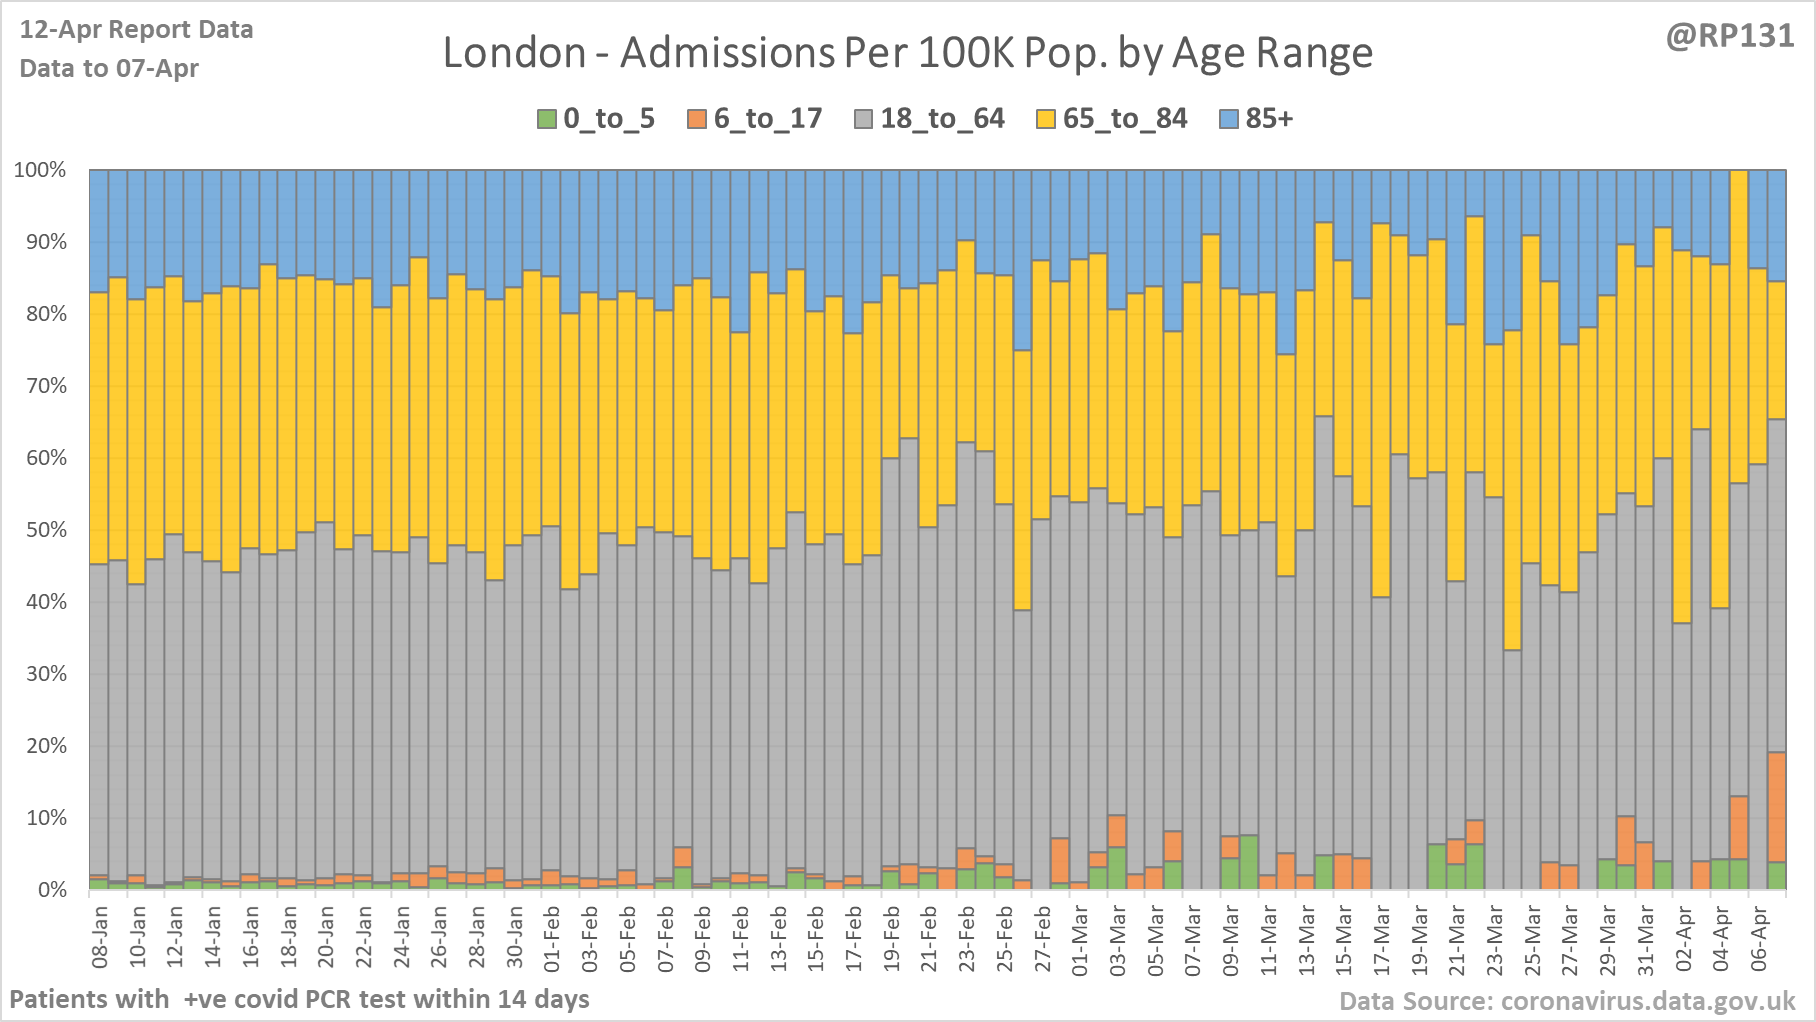
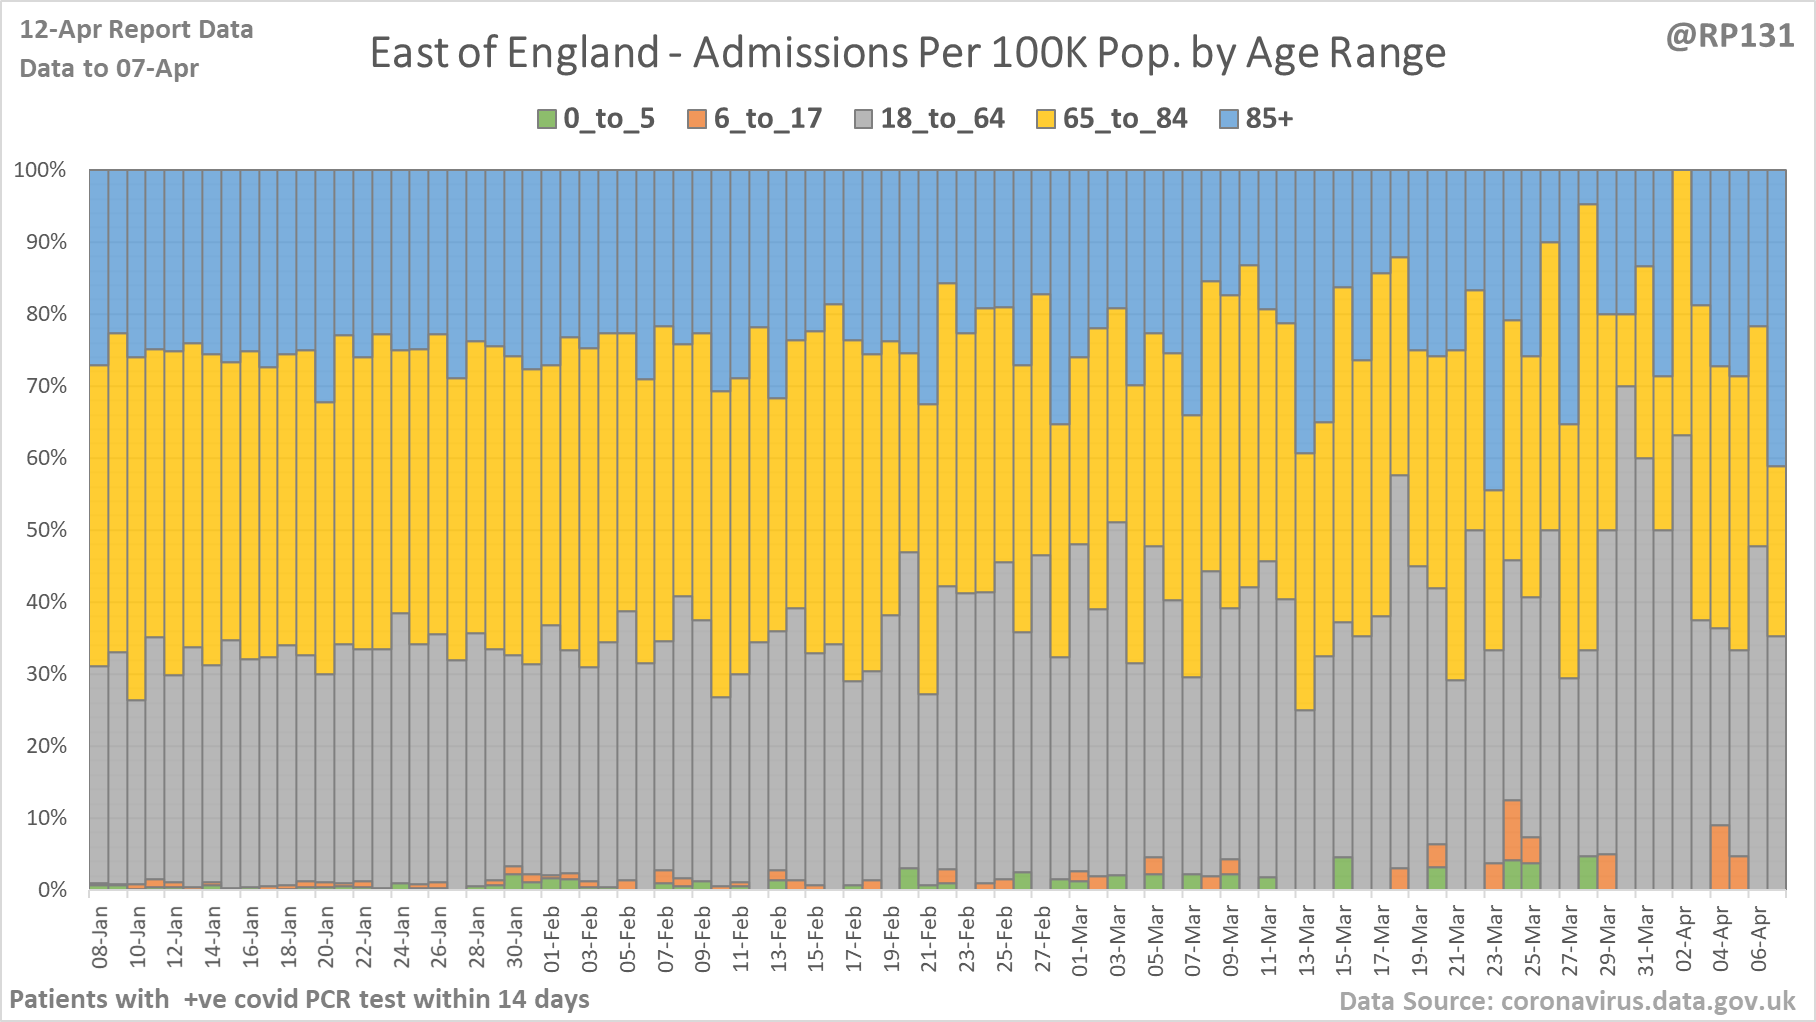
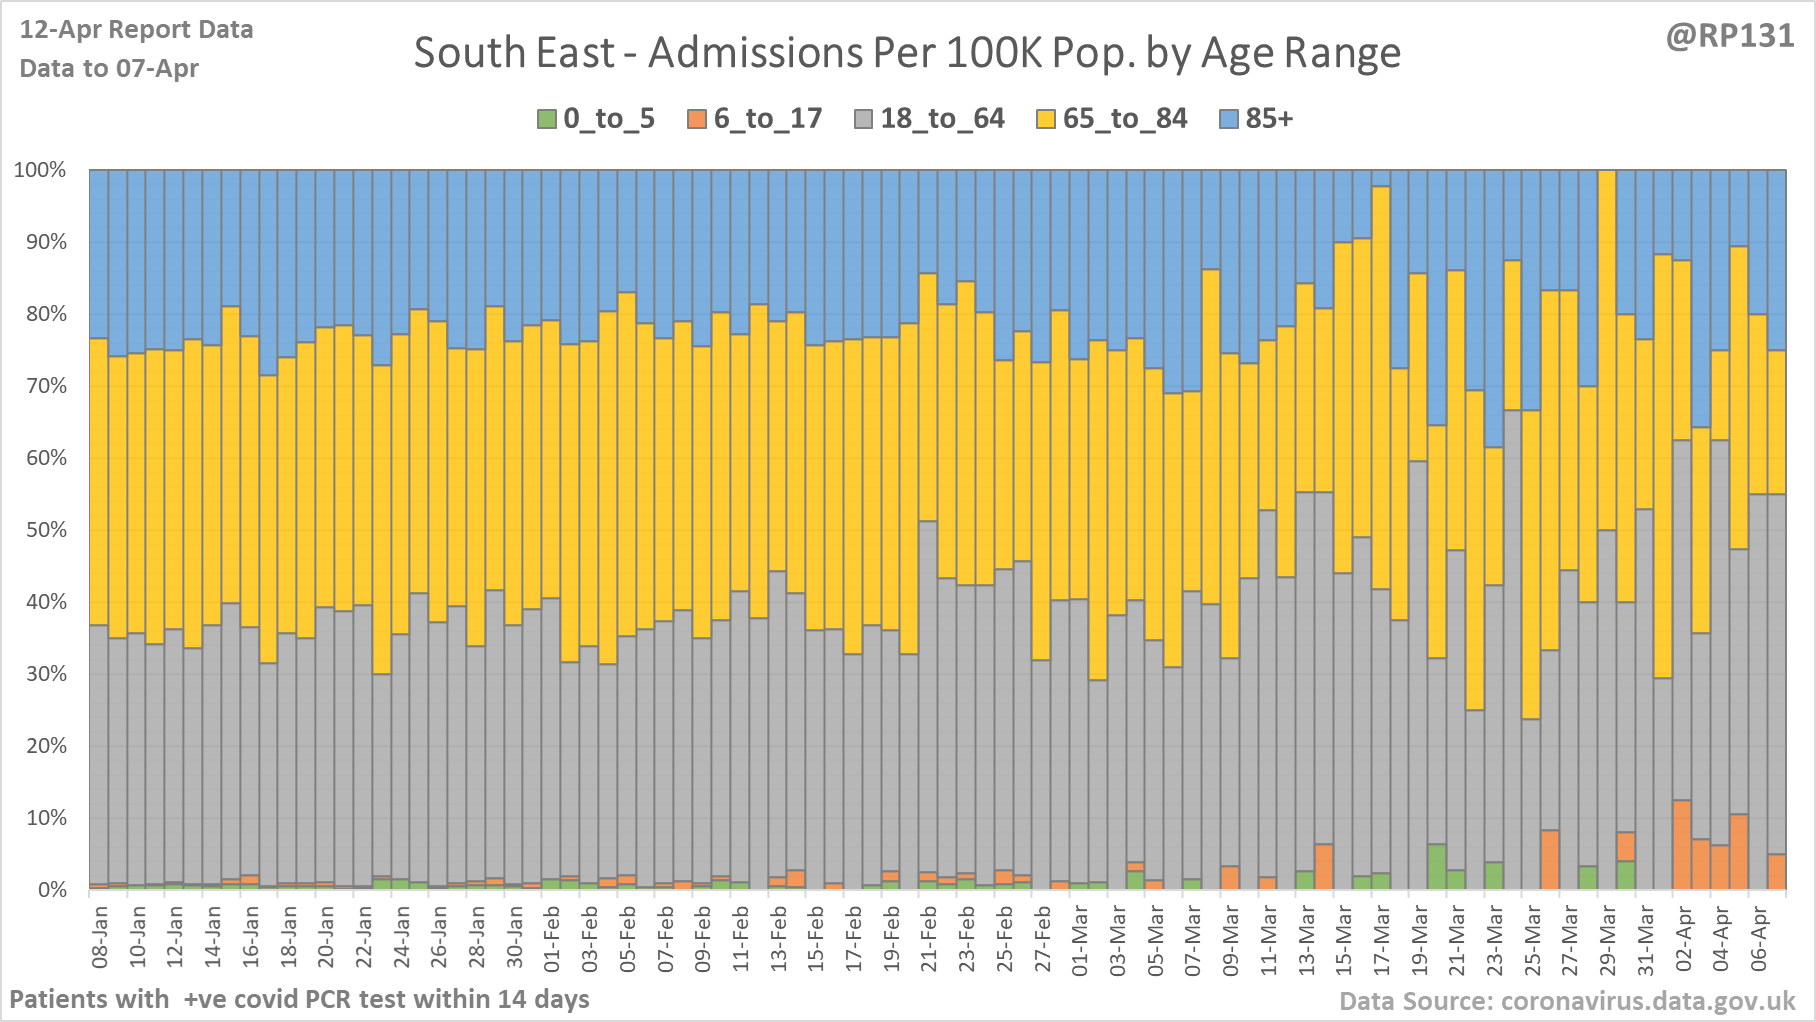
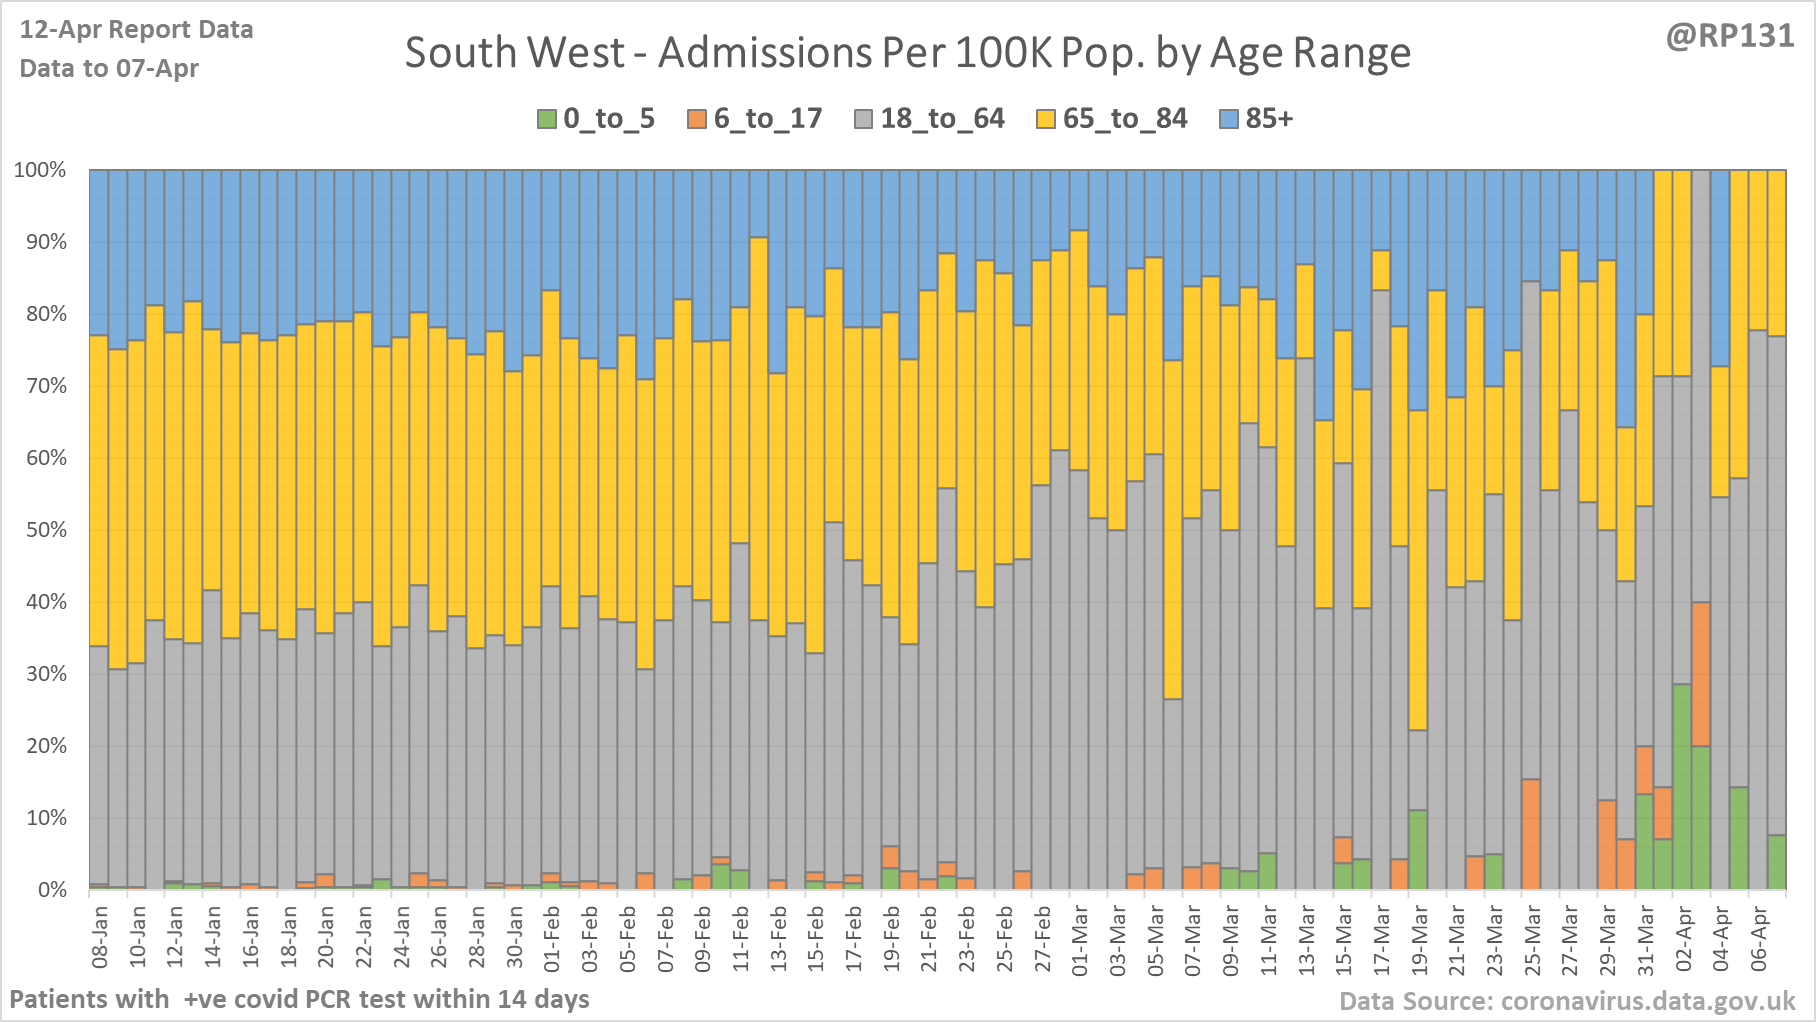
[17/20] Percentage view of hospital age ranges of admissions (per 100K population) for NHS regions London, East of England, South East and South West.
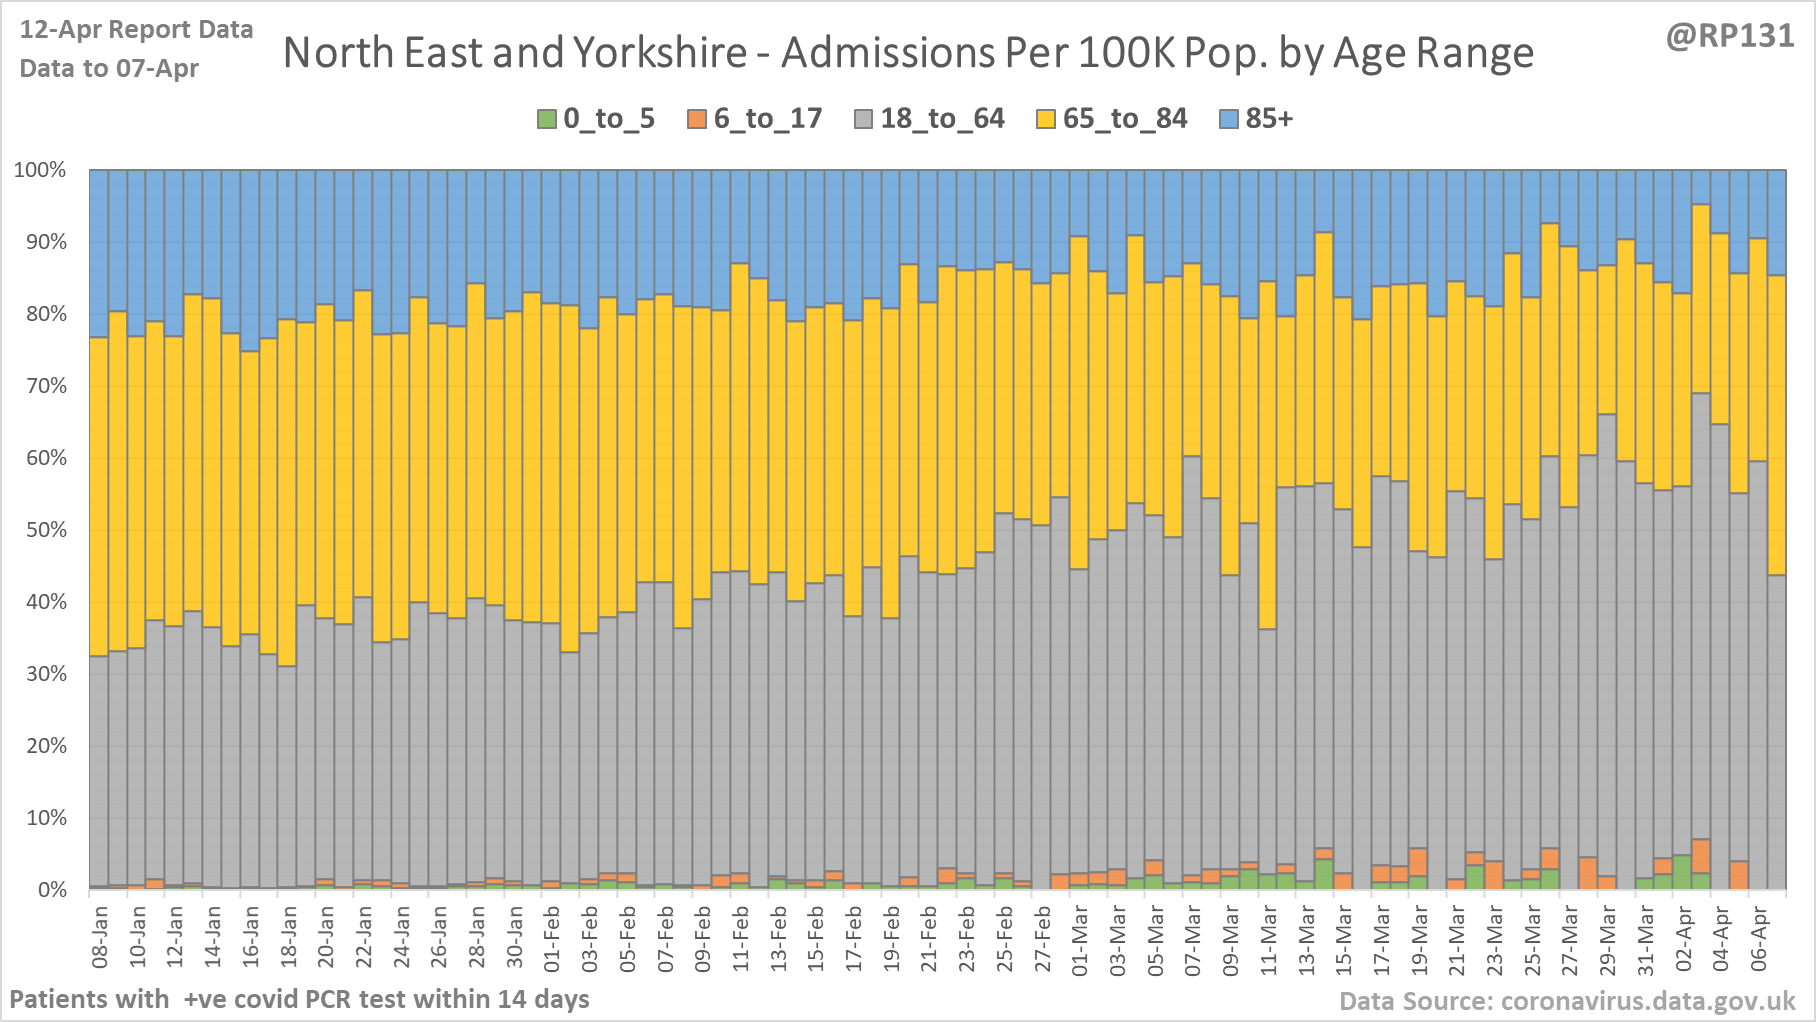
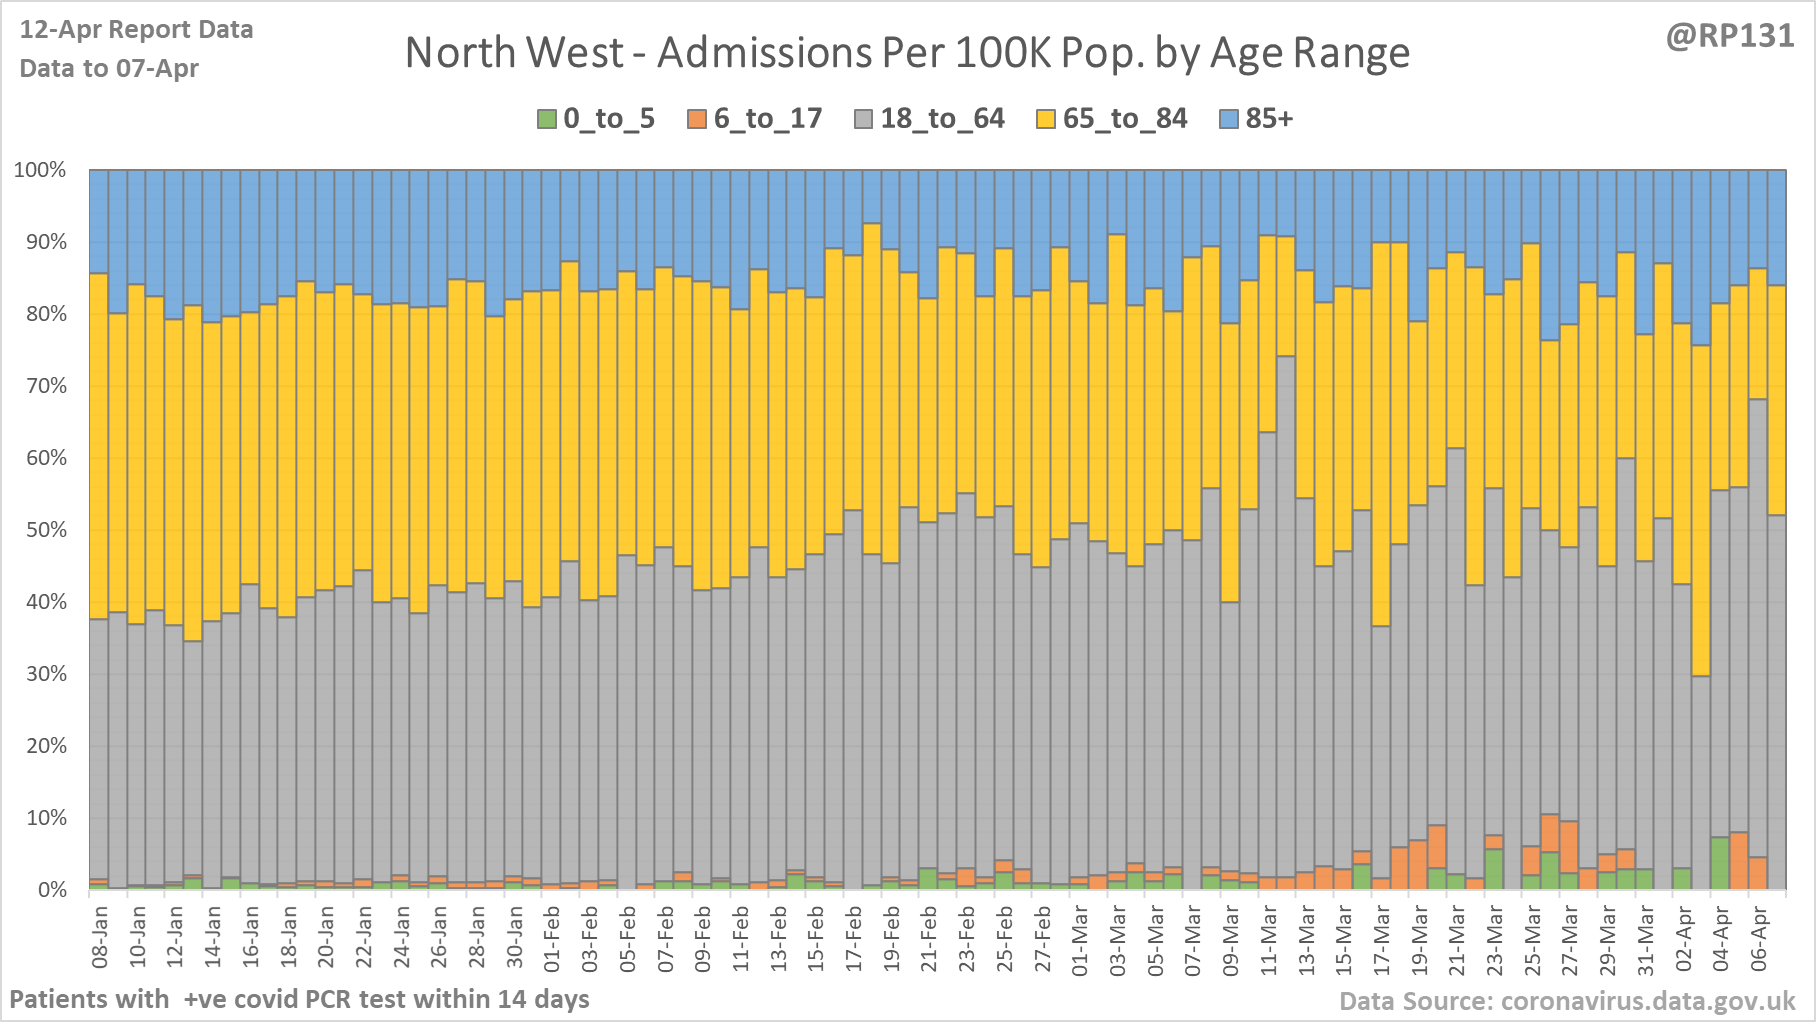
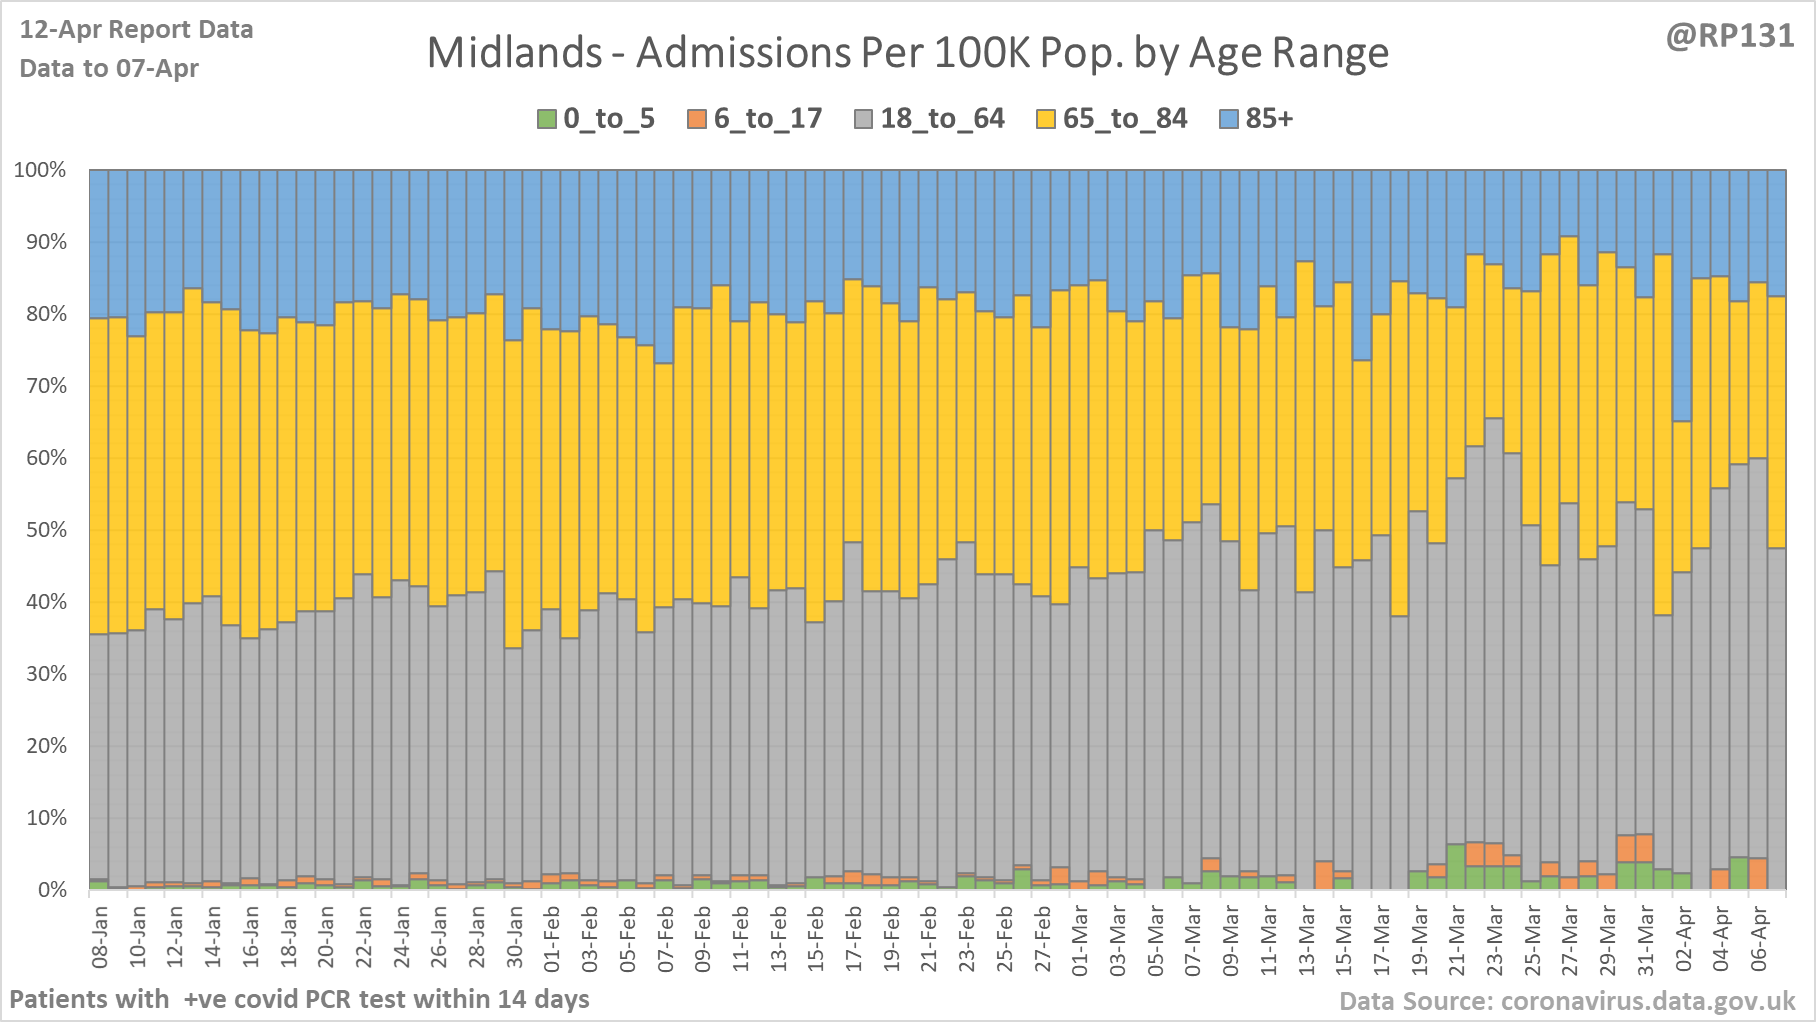
[18/20] Percentage view of hospital age ranges of admissions (per 100K population) for NHS regions North East & Yorkshire, North West and Midlands.
