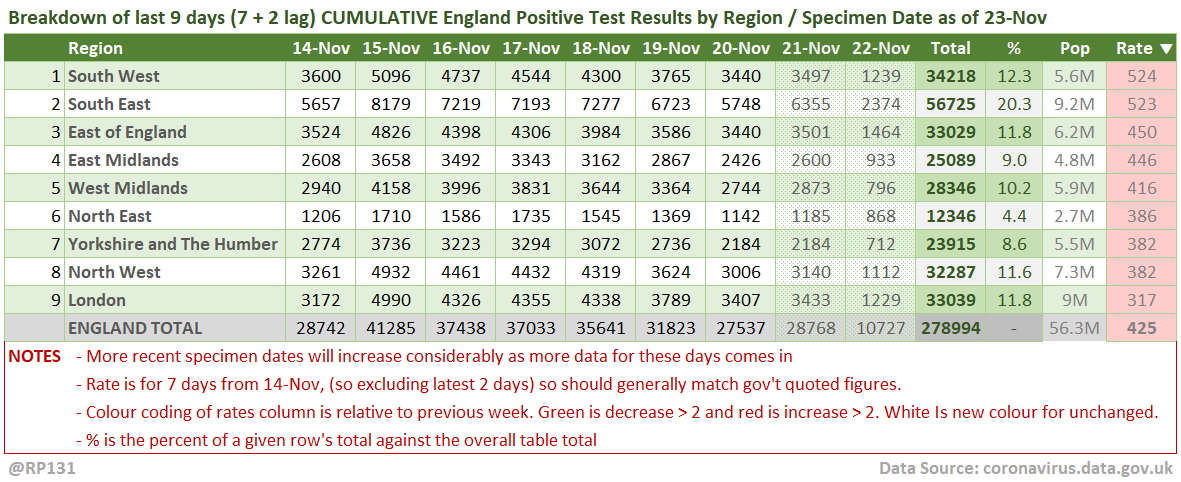
[1/13] #covid19uk - Tables thread. Starting with the top 50 England Local Authorities by positives per 100K population in last 7 days, up to 3 days ago. Bright green means lower than previous period.
[2/13] Link to full versions, sorted by:
Rate: https://coviddatasha...e_Rate_20211123.html
Count: https://coviddatasha...lative_20211123.html
Rate: https://coviddatasha...e_Rate_20211123.html
Count: https://coviddatasha...lative_20211123.html
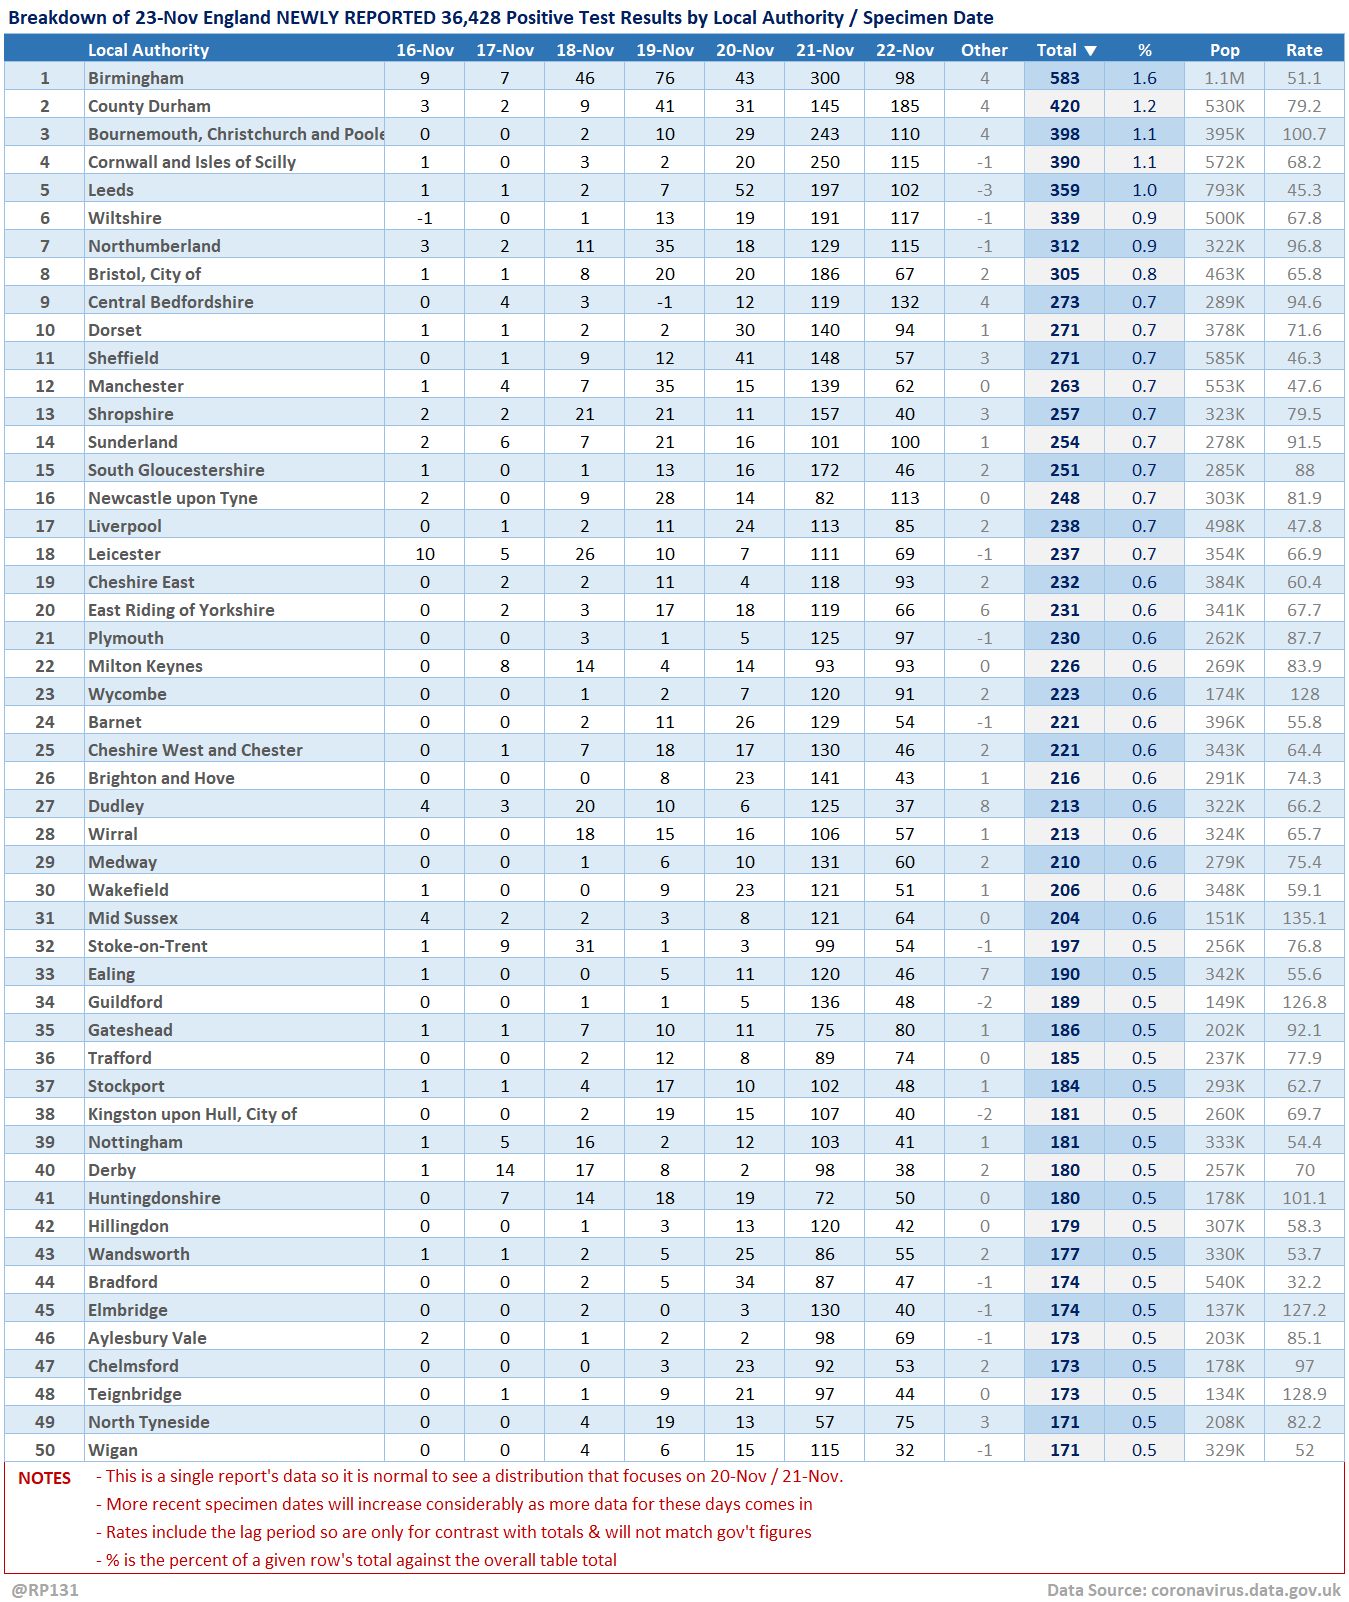
[4/13] Table view of today's 36,428 NEWLY REPORTED England positive test results by local authority and recent specimen dates. Here showing top 50 authorities which represent 52% of the population, but have 53% of the positives.
[5/13] Link to full table: https://coviddatasha.../Table_20211123.html
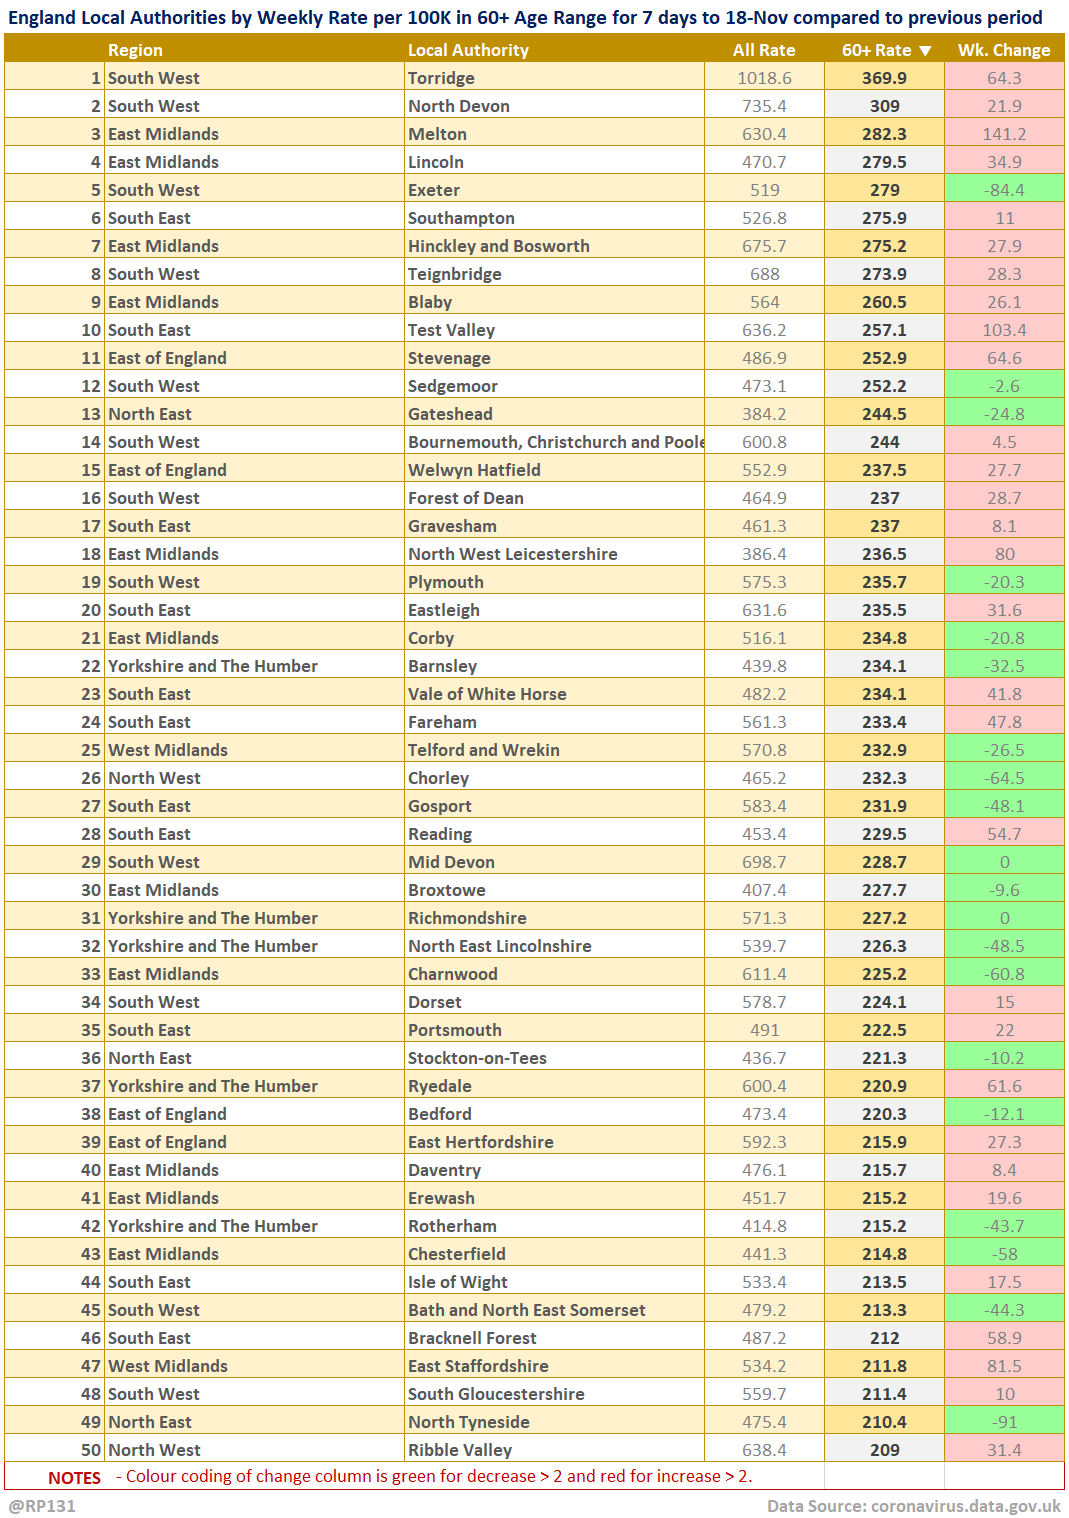
[7/13] Top 50 table view of latest availble Local Authority data for the 60+ age range for 7 days to 18-Nov sorted by descending rate per 100K population (of that age range). Change column is compared to previous week with red for increase and green for decrease.
[8/13] Link to full 60+ table: https://coviddatasha...bleAge_20211123.html
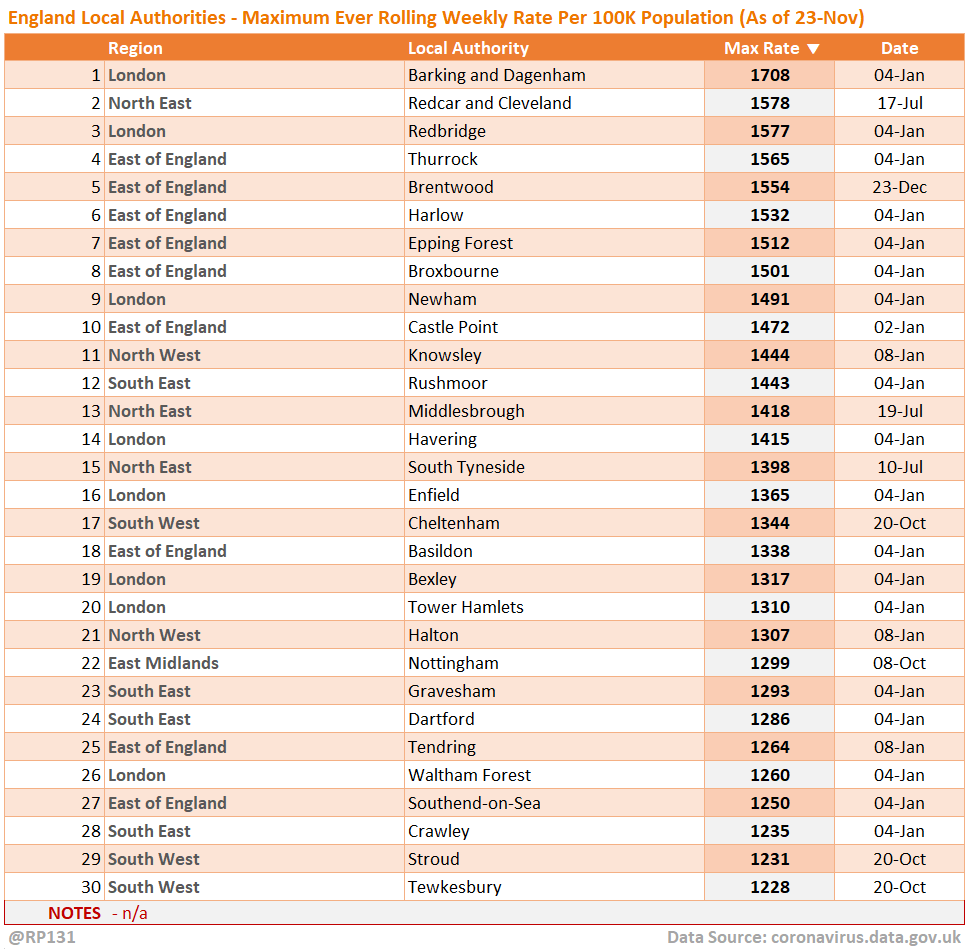
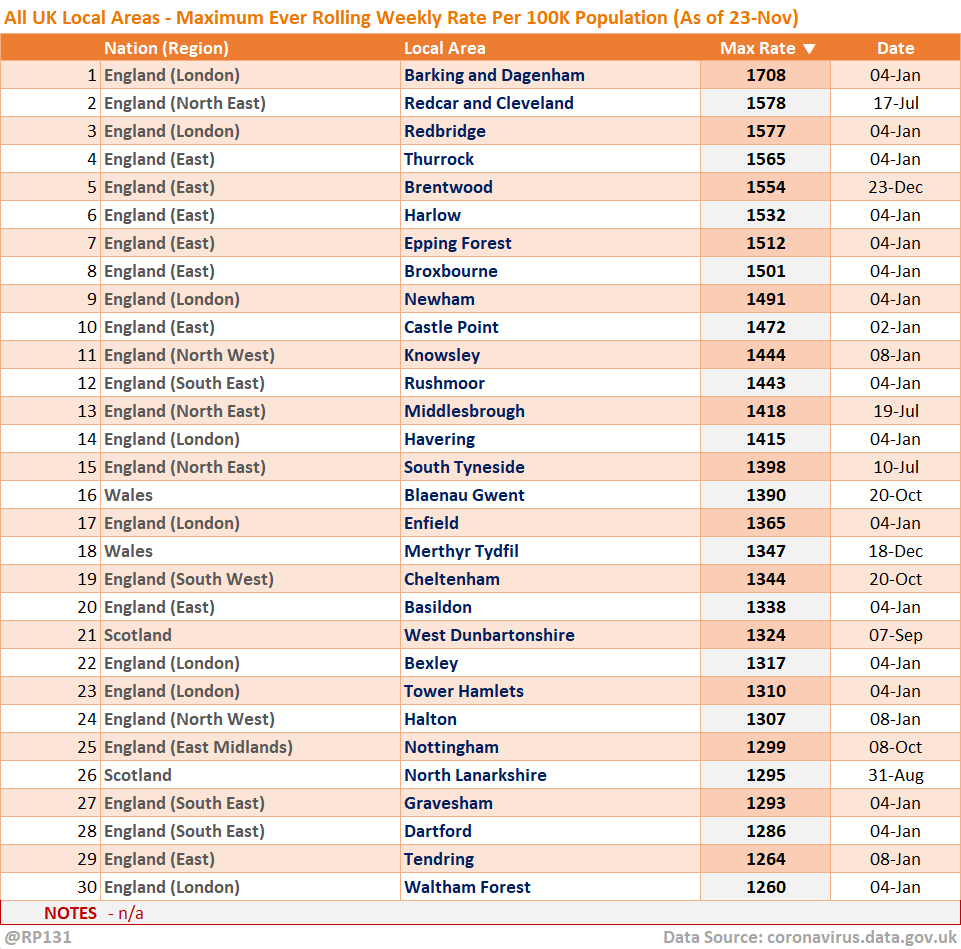
[9/13] Top 30 England local authorities by maximum weekly rate per 100K population recorded to date.
[11/13] Link to full versions:
England: https://coviddatasha...bleMax_20211123.html
UK: https://coviddatasha...Max_UK_20211123.html
England: https://coviddatasha...bleMax_20211123.html
UK: https://coviddatasha...Max_UK_20211123.html
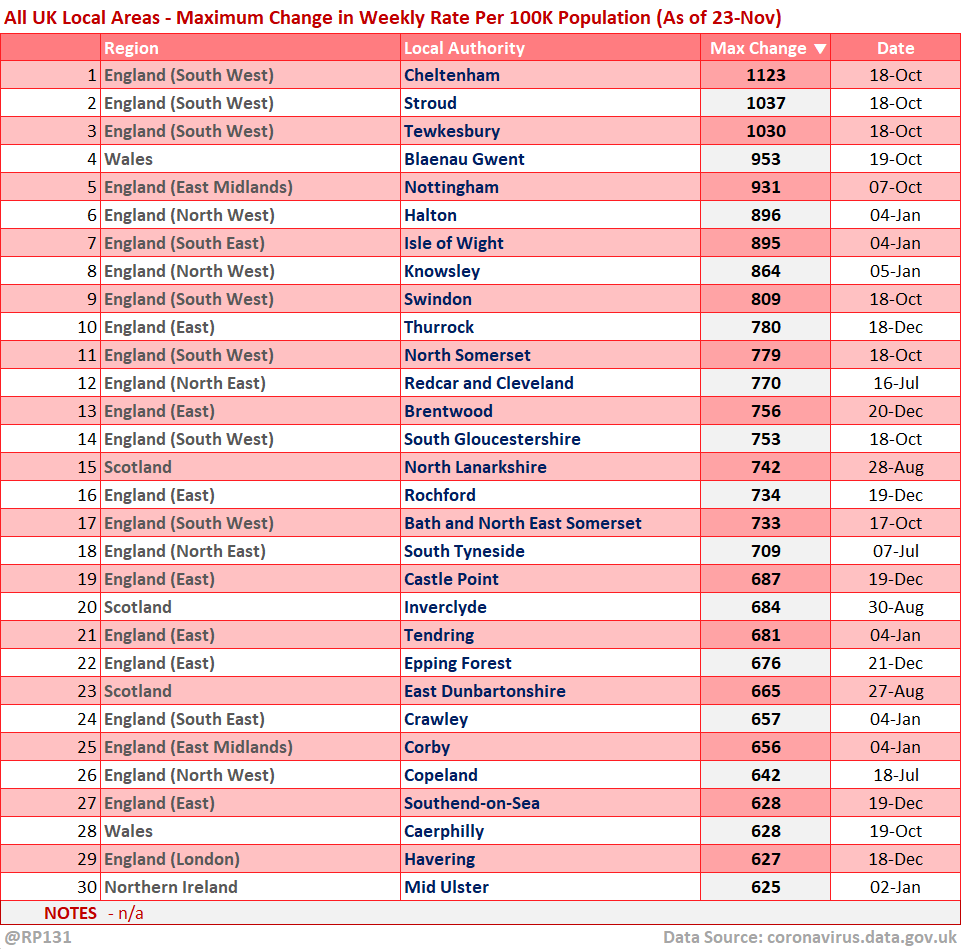
[13/13] Link to full versions:
England: https://coviddatasha...Change_20211123.html
UK: https://coviddatasha...nge_UK_20211123.html
England: https://coviddatasha...Change_20211123.html
UK: https://coviddatasha...nge_UK_20211123.html
